Market Prospects for Groundnut in West Africa COMMON FUND ...
Market Prospects for Groundnut in West Africa COMMON FUND ...
Market Prospects for Groundnut in West Africa COMMON FUND ...

You also want an ePaper? Increase the reach of your titles
YUMPU automatically turns print PDFs into web optimized ePapers that Google loves.
Citation: BR Ntare, F Waliyar, M Ramouch, E Masters and J Ndjeunga, eds. 2005.<br />
<strong>Market</strong> <strong>Prospects</strong> <strong>for</strong> <strong>Groundnut</strong> <strong>in</strong> <strong>West</strong> <strong>Africa</strong>. CFC Technical Paper No. 39. PO<br />
Box 74656, 1070 BR Amsterdam, The Netherlands: Common Fund <strong>for</strong><br />
Commodities; and Patancheru, India: International Crops Research Institute <strong>for</strong><br />
the Semi-Arid Tropics. 252 pp.
<strong>COMMON</strong> <strong>FUND</strong> FOR COMMODITIES<br />
ICRISAT<br />
CFC Technical Paper No. 39<br />
<strong>Market</strong> <strong>Prospects</strong> <strong>for</strong><br />
<strong>Groundnut</strong> <strong>in</strong> <strong>West</strong> <strong>Africa</strong><br />
Edited by<br />
BR Ntare, F Waliyar, M Ramouch, E Masters<br />
and J Ndjeunga
<strong>COMMON</strong> <strong>FUND</strong> FOR COMMODITIES<br />
Stadhouderskade 55, 1072 AB Amsterdam, The Netherlands<br />
Postal Address: P.O. Box 74656, 1070 BR Amsterdam, The Netherlands<br />
Tel: (31 20) 575 4949 • Fax: (31 20) 676 0231<br />
Telex 12331 cfc nl e-mail:Manag<strong>in</strong>g.Director@common-fund.org<br />
Website: www.common-fund.org<br />
Copyright © Common Fund <strong>for</strong> Commodities 2004<br />
The contents of this report may not be reproduced, stored <strong>in</strong> a data retrieval system or<br />
transmitted <strong>in</strong> any <strong>for</strong>m or by any means without prior written permission of the Common Fund<br />
<strong>for</strong> Commodities, except that reasonable extracts may be made <strong>for</strong> the purpose of comment or<br />
review provided the Common Fund <strong>for</strong> Commodities is acknowledged as the source.
Foreword<br />
<strong>Groundnut</strong> production, market<strong>in</strong>g and trade are major sources of<br />
employment, <strong>in</strong>come and <strong>for</strong>eign exchange <strong>in</strong> many <strong>West</strong> <strong>Africa</strong>n countries.<br />
<strong>Groundnut</strong> products are of central economic importance to millions of<br />
smallholders <strong>in</strong> this region. It generates 60% of the rural cash <strong>in</strong>come and<br />
accounts <strong>for</strong> about 70% of the rural labor <strong>for</strong>ce <strong>in</strong> Senegal and Gambia.<br />
However, groundnut trade rema<strong>in</strong>s heavily distorted, and this has affected the<br />
competitive position of various players <strong>in</strong> world markets.<br />
Previous <strong>in</strong>vestments by CFC and ICRISAT <strong>in</strong> groundnut research and<br />
development have concentrated on provid<strong>in</strong>g technology options to <strong>in</strong>crease<br />
yields and tolerance to abiotic and biotic stresses. While this has been highly<br />
successful <strong>in</strong> develop<strong>in</strong>g good varieties, attention needs to be devoted to<br />
factors of market demand. There is now clear evidence that <strong>in</strong>centives or<br />
opportunities <strong>for</strong> market surplus production provide the necessary pull <strong>for</strong><br />
adoption of new varieties. This shift <strong>in</strong> paradigm <strong>for</strong> technology development<br />
and dissem<strong>in</strong>ation requires the identification of partners and market l<strong>in</strong>kages<br />
beyond the common belief that markets are easily available if production is<br />
done well. The results of this study are meant to facilitate this process.<br />
A range of factors expla<strong>in</strong>s the limited competitiveness of groundnut <strong>in</strong><br />
the domestic, regional and <strong>in</strong>ternational markets. These <strong>in</strong>clude low<br />
production and strict rules on grades and standards, which most <strong>West</strong> <strong>Africa</strong>n<br />
producers often f<strong>in</strong>d difficult to meet. Domestic policies have also limited<br />
trade. This study has provided background <strong>in</strong><strong>for</strong>mation on groundnut<br />
production <strong>in</strong> <strong>West</strong> <strong>Africa</strong>, constra<strong>in</strong>ts to groundnut production, process<strong>in</strong>g<br />
and commercialization. Additionally, the study also presents some market<br />
prospects <strong>for</strong> groundnut and groundnut products, and explores ways to<br />
<strong>in</strong>crease groundnut competitiveness <strong>in</strong> the domestic, regional and<br />
<strong>in</strong>ternational markets.<br />
It is our hope and expectation that this report will be valuable <strong>in</strong> the<br />
promotion of groundnut production and trade not only <strong>in</strong> <strong>West</strong> <strong>Africa</strong> but also<br />
<strong>in</strong> all sub-Saharan <strong>Africa</strong> countries where the economies are still agriculturedependent.<br />
WD Dar<br />
Director General, ICRISAT<br />
Amb. Ali Mchumo<br />
Manag<strong>in</strong>g Director, CFC<br />
iii
Contents<br />
Executive Summary ..................................................................................... 1<br />
1.0 Introduction ......................................................................................... 4<br />
1.1 <strong>Groundnut</strong> and groundnut products <strong>in</strong> trade ................................. 4<br />
2.0 <strong>West</strong> <strong>Africa</strong>n groundnut markets .......................................................... 7<br />
2.1 Recent trends <strong>in</strong> production and consumption................................ 7<br />
2.2 <strong>Market</strong> characteristics of the study area ......................................... 7<br />
2.3 Conclusions .................................................................................. 10<br />
2.4 Strategies <strong>for</strong> <strong>West</strong> <strong>Africa</strong> ............................................................. 12<br />
3.0 Ma<strong>in</strong> produc<strong>in</strong>g countries on the <strong>in</strong>ternational market........................ 15<br />
3.1 Introduction: <strong>Groundnut</strong> and groundnut products <strong>in</strong> trade .......... 15<br />
3.2 Ch<strong>in</strong>a ............................................................................................ 16<br />
3.3 The United States of America ...................................................... 17<br />
3.4 Argent<strong>in</strong>a ...................................................................................... 20<br />
3.5 India ............................................................................................. 20<br />
3.6 Vietnam ........................................................................................ 21<br />
3.7 South <strong>Africa</strong> ................................................................................. 22<br />
3.8 Other <strong>Africa</strong>n orig<strong>in</strong>s .................................................................... 23<br />
4.0 World market trends and quality requirements ................................... 24<br />
4.1 Introduction ................................................................................ 24<br />
4.2 Europe ......................................................................................... 25<br />
4.3 The United States of America ..................................................... 28<br />
4.4 South <strong>Africa</strong> ................................................................................ 31<br />
4.5 Asian countries ............................................................................ 32<br />
5.0 <strong>West</strong> <strong>Africa</strong>: <strong>Market</strong> profiles of Senegal, Mali, Niger and Nigeria ....... 33<br />
5.1 Introduction ................................................................................. 33<br />
5.2 Senegal ........................................................................................ 34<br />
5.3 Mali ............................................................................................. 40<br />
5.4 Niger ........................................................................................... 46<br />
5.5 Nigeria ......................................................................................... 52<br />
5.6 Sub-regional market price data: Mali, Niger and Nigeria<br />
(2002-2003) ................................................................................ 59<br />
5.7 Additional observations................................................................ 62<br />
6.0 Background and methodology ............................................................ 64<br />
v
Appendices<br />
World Trade Data<br />
Appendix 1: Statistical analysis of world trade <strong>in</strong> groundnut.................... 71<br />
Appendix 2: Sample pricelist, Aldebaran Commodities, Rotterdam ........ 82<br />
Appendix 3: Current trade and domestic policies on groundnut trade<br />
(2003) ................................................................................. 84<br />
Appendix 4: US groundnut imports under AGOA, 2002 ........................ 86<br />
Quality Aspects <strong>in</strong> Trade<br />
Appendix 5: Quality aspects of groundnuts <strong>in</strong> trade ................................ 87<br />
Appendix 6: Aflatox<strong>in</strong> <strong>in</strong> groundnuts ....................................................... 92<br />
Appendix 7: World Health Organization on Mycotox<strong>in</strong>s .......................... 94<br />
Reference Data<br />
Appendix 8: European buyers and brokers of groundnut ......................... 97<br />
Appendix 9: <strong>Groundnut</strong> contacts <strong>in</strong> the USA ........................................ 104<br />
Appendix 10: Bibliography ....................................................................... 114<br />
vi
Executive Summary<br />
<strong>Groundnut</strong> trade <strong>in</strong> <strong>in</strong>ternational markets accounts <strong>for</strong> a mere 4-6% of total<br />
world production, while the majority of world groundnut production serves<br />
subsistence needs and requirements of domestic markets. In general, recent<br />
decades have seen an <strong>in</strong>crease <strong>in</strong> the consumption of groundnut <strong>for</strong> all uses.<br />
There has been a shift away from its use <strong>for</strong> oil and meal (<strong>for</strong> which there are<br />
substitutes, notably soya) and toward confectionary groundnut, <strong>for</strong> which<br />
there are no exact substitutes. However, as product quality standards are far<br />
higher <strong>for</strong> edible groundnut, this trend implies a correspond<strong>in</strong>g <strong>in</strong>crease <strong>in</strong><br />
product quality (particularly <strong>in</strong> terms of Aspergillus, the source of aflatox<strong>in</strong>).<br />
In general, the European groundnut market has become less diversified<br />
and more concentrated over the past decade. It is said that until the late1990s,<br />
large and small orig<strong>in</strong> shellers/suppliers provided products to a range of large<br />
and small dealers, to serve a range of large and small consumers ie, from enduse<br />
manufactur<strong>in</strong>g <strong>in</strong>dustries to supermarkets.<br />
S<strong>in</strong>ce the early 1970s, groundnut consumption patterns have shifted <strong>in</strong><br />
<strong>West</strong> <strong>Africa</strong> as <strong>in</strong> other parts of the world. While total consumption <strong>in</strong> eastern<br />
and southern <strong>Africa</strong> has decl<strong>in</strong>ed, groundnut utilization <strong>in</strong> <strong>West</strong> <strong>Africa</strong> has<br />
<strong>in</strong>creased significantly due to a shift toward edible applications. S<strong>in</strong>ce the late<br />
1980s, groundnut <strong>in</strong> <strong>West</strong> <strong>Africa</strong> has become primarily a food crop rather than<br />
oilseed. Between 1972 and 2000, the proportion of <strong>West</strong> <strong>Africa</strong>n groundnuts<br />
consumed as food grew by an astonish<strong>in</strong>g 209%, even as exports decl<strong>in</strong>ed<br />
precipitously dur<strong>in</strong>g the same period.<br />
The decl<strong>in</strong>e of <strong>Africa</strong>n groundnut exports is related to the trend toward<br />
production of edible groundnut, which was poorly timed <strong>in</strong> respect to<br />
<strong>in</strong>creas<strong>in</strong>g aflatox<strong>in</strong> restrictions as well as <strong>in</strong>creas<strong>in</strong>g <strong>in</strong>dustrial substitution by<br />
other oils, particularly soybean.<br />
Though all the countries which produce groundnut are prone to aflatox<strong>in</strong><br />
<strong>in</strong>festation, <strong>Africa</strong> is considered particularly problematic by <strong>in</strong>ternational<br />
buyers, as the production cha<strong>in</strong> <strong>in</strong> each country (with the exception of South<br />
<strong>Africa</strong>) is fragmented, production systems <strong>in</strong>sufficient to address the problem,<br />
aflatox<strong>in</strong> monitor<strong>in</strong>g by crop virtually nonexistent, and pre-shipment<br />
<strong>in</strong>spection services perceived as lack<strong>in</strong>g <strong>in</strong> reliability.<br />
Un<strong>for</strong>tunately, <strong>in</strong>ternational trade <strong>in</strong> groundnut is based on confidence<br />
and reliability <strong>in</strong> terms of supply as well as product quality. The current EU<br />
regulations on aflatox<strong>in</strong> have certa<strong>in</strong>ly contributed to an <strong>in</strong>creas<strong>in</strong>gly<br />
1
conservative tendency among European buyers, who are unlikely to take any<br />
unnecessary risks as regards aflatox<strong>in</strong>.<br />
An un<strong>for</strong>tunate and direct economic consequence is that <strong>for</strong> <strong>West</strong> <strong>Africa</strong><br />
to re-enter the world groundnut market (and particularly the European<br />
market, which offers perhaps the greatest potential), export prices would<br />
have to compete favorably with Ch<strong>in</strong>ese groundnut, which is abundant, cheap<br />
and enjoys a favorable reputation <strong>in</strong> terms of reliable supply and reliable<br />
quality.<br />
Recent prices <strong>for</strong> Ch<strong>in</strong>ese groundnut are on the order of $650 per MT –<br />
the same price as production of a ton of edible groundnut (arachide de bouche<br />
or ARB) under irrigation <strong>in</strong> Senegal. This means that the current and<br />
<strong>for</strong>eseeable marg<strong>in</strong>s of return are not <strong>in</strong> any case favorable to the re-entry of<br />
<strong>West</strong> <strong>Africa</strong>n exports on to the world market, even without regard to product<br />
quality and perceptions of <strong>in</strong>ternational buyers.<br />
On the other hand, though the trade l<strong>in</strong>kages are not as established (or<br />
cheap) as between <strong>West</strong> <strong>Africa</strong> and Europe, the South <strong>Africa</strong>n market does<br />
represent a significant potential opportunity <strong>for</strong> <strong>West</strong> <strong>Africa</strong>n producers. Due<br />
to a poor harvest <strong>in</strong> 2003, South <strong>Africa</strong> has been import<strong>in</strong>g groundnut from<br />
southern <strong>Africa</strong> and even Argent<strong>in</strong>a at premium prices – over $700 per MT<br />
(unsorted and CIF) <strong>in</strong> Malawi. There may be scope <strong>for</strong> entry <strong>in</strong>to the South<br />
<strong>Africa</strong>n market once aflatox<strong>in</strong> has been addressed by improved management<br />
and monitor<strong>in</strong>g of product quality at the crop level.<br />
The primary conclusion of this study is that resources should be devoted<br />
to improvement of the production cha<strong>in</strong> of the groundnut sector <strong>in</strong> each<br />
producer country, with <strong>in</strong>itial emphasis on production to satisfy national, subregional<br />
and even regional demand.<br />
While the structural details of such a program would be negotiated on a<br />
country-by-country basis – and state <strong>in</strong>tervention is <strong>in</strong> any case likely to<br />
rema<strong>in</strong> limited – common features might <strong>in</strong>clude the establishment of public<br />
warehouses and/or buy<strong>in</strong>g po<strong>in</strong>ts, at which production would be sorted,<br />
graded and tested <strong>for</strong> aflatox<strong>in</strong> contam<strong>in</strong>ation and other parameters of<br />
product quality.<br />
In assess<strong>in</strong>g the current and <strong>for</strong>eseeable market opportunities <strong>for</strong><br />
groundnut of <strong>West</strong> <strong>Africa</strong>n orig<strong>in</strong>, it will be crucial to build slowly and<br />
deliberately on exist<strong>in</strong>g strengths (<strong>in</strong>clud<strong>in</strong>g the availability of improved seed<br />
through the current project). It needs specific and focused attention to the<br />
production cha<strong>in</strong> – specifically cultivation, harvest and postharvest methods<br />
2
which prevent <strong>in</strong>fection of the product by Aspergillus, and thereby ensure<br />
product quality.<br />
It is thus strongly recommended that the project and ICRISAT consider<br />
the establishment of a harmonized sub-regional program to address the<br />
specific technical constra<strong>in</strong>ts of smallholder groundnut farmers of <strong>West</strong><br />
<strong>Africa</strong>. These constra<strong>in</strong>ts currently stand as an obstacle to export<br />
development, and put national populations at risk of serious health problems<br />
through consumption of groundnut <strong>in</strong>fected with aflatox<strong>in</strong>.<br />
With such a program <strong>in</strong> place, a system of product quality certification<br />
may be developed over time, <strong>in</strong> collaboration with national and <strong>in</strong>ternational<br />
analytical laboratories.<br />
In the meantime, the project could help to build national and regional<br />
trade opportunities <strong>for</strong> producers by monitor<strong>in</strong>g groundnut supply and price<br />
<strong>in</strong><strong>for</strong>mation on local and national markets, and facilitate the diffusion of such<br />
crucial <strong>in</strong><strong>for</strong>mation to sector stakeholders via rural radio and other locally<br />
appropriate means.<br />
3
4<br />
1.0 Introduction<br />
This study was commissioned by ICRISAT, with f<strong>in</strong>ancial support from the<br />
Common Fund <strong>for</strong> Commodities. The study was implemented <strong>in</strong> the United<br />
States, <strong>Africa</strong> and <strong>in</strong> Europe from 16 June to 15 December 2003. It will be<br />
presented to ICRISAT <strong>in</strong> Bamako at the annual project meet<strong>in</strong>g <strong>for</strong> the CFCfunded<br />
project, Development of susta<strong>in</strong>able groundnut seed systems <strong>in</strong> <strong>West</strong> <strong>Africa</strong>.<br />
1.1 <strong>Groundnut</strong> and groundnut products <strong>in</strong> trade<br />
<strong>Groundnut</strong> (also known as peanut) or Arachis hypogea is a domesticated<br />
pulse, a legum<strong>in</strong>ous oilseed rich <strong>in</strong> prote<strong>in</strong> and related to wild Arachis species<br />
<strong>in</strong>digenous to Brazil, Bolivia, Uruguay and northern Argent<strong>in</strong>a. World trade <strong>in</strong><br />
groundnut began with <strong>in</strong>dustrial extraction of groundnut oil <strong>in</strong> Marseilles <strong>in</strong><br />
the mid-19th century (Purseglove 1968,1988).<br />
<strong>Groundnut</strong> is traded <strong>in</strong> a number of <strong>for</strong>ms and the major markets have<br />
different patterns of consumption <strong>for</strong> each. <strong>Groundnut</strong> is designated by its<br />
type or variety (used <strong>in</strong> this sense as a generic term descriptive of a physical<br />
type, rather than a synonym <strong>for</strong> ‘cultivar’), and the size of the seeds, which<br />
must pass through a set of screens calibrated by the number of nuts <strong>in</strong> an<br />
ounce. <strong>Groundnut</strong> known as ‘40/50’ (the most common, medium-sized<br />
groundnut on the world market) would consist of between 40 and 50 seeds<br />
per ounce.<br />
The three basic groundnut types are the Virg<strong>in</strong>ia (the largest variety, used<br />
<strong>in</strong> the roasted snack <strong>in</strong>dustry), Runner (medium-sized, common <strong>in</strong><br />
confectionary and as peanut butter) and Spanish/Valencia (smallest, high <strong>in</strong> oil<br />
content and also used <strong>in</strong> peanut candy, confectionary and as peanut butter).<br />
The most basic <strong>for</strong>m of groundnut traded is groundnut <strong>in</strong>-shell, which<br />
accounts <strong>for</strong> the majority of transactions both with<strong>in</strong> the producer countries<br />
and <strong>in</strong>ternationally. Second <strong>in</strong> terms of volume of trade is shelled groundnut.<br />
<strong>Groundnut</strong> products may be divided <strong>in</strong>to edible groundnuts and oilseed<br />
groundnuts. The <strong>for</strong>mer are also known as confectionary groundnuts or<br />
arachide de bouche (ARB), and are traded whole <strong>for</strong> further process<strong>in</strong>g while<br />
the oilseed variety lends itself to extraction of edible oil. About two-thirds of<br />
the world’s groundnut production goes toward oil production. The ma<strong>in</strong><br />
groundnut oil export<strong>in</strong>g countries <strong>in</strong> any given year are Senegal and Argent<strong>in</strong>a.<br />
India has recently re-entered the market <strong>in</strong> response to unusually high prices<br />
<strong>in</strong> 2003, discussed further <strong>in</strong> Section 3.5.
As the oil content of the seed varies between 38-47% <strong>for</strong> confectionary<br />
and 47-55% <strong>for</strong> the oilseed varieties, the yield of oil is roughly equal to the<br />
yield of groundnut cake or meal. Quality standards <strong>for</strong> oilseed groundnut are<br />
much lower than those <strong>for</strong> edible groundnut, and groundnut meal may be<br />
chemically de-toxified of aflatox<strong>in</strong> residues by a simple <strong>in</strong>dustrial process<br />
(Kettlewell 2003). While groundnut oil prices have rema<strong>in</strong>ed fairly level over<br />
the past 25 years, groundnut meal prices have steadily decl<strong>in</strong>ed, largely <strong>in</strong><br />
response to competition from soya (Freeman et al. 1999). Dur<strong>in</strong>g 1999-2000,<br />
30% of world groundnut oil orig<strong>in</strong>ated from <strong>Africa</strong> (of which 14% was from<br />
Senegal), as did 40% of world groundnut cake, of which 15% orig<strong>in</strong>ated from<br />
Senegal (Ntare et al. 2003).<br />
The prote<strong>in</strong> content of groundnut ranges between 24-35% to that of the<br />
meal 40-50% (Rehm and Espig 1991). Alongside <strong>in</strong>dustrial production of<br />
groundnut oil <strong>in</strong> Niger, Senegal and Nigeria, household or artisanal extraction<br />
rema<strong>in</strong>s an important economic activity, particularly <strong>for</strong> rural women. After<br />
oil is extracted, the groundnut meal is used <strong>for</strong>mulat<strong>in</strong>g animal feeds. It may<br />
also processed <strong>in</strong>to human foods, such as kulikuli made from groundnut paste<br />
(by-product of traditional extraction) by women <strong>in</strong> Niger and Nigeria. This is<br />
both <strong>for</strong> household consumption as well as <strong>for</strong> sale.<br />
Edible groundnuts may be blanched by immersion <strong>in</strong> water. Most edible<br />
groundnuts are roasted and some are processed further. For example, the<br />
snack <strong>in</strong>dustry adds additional coat<strong>in</strong>gs, which requires a particularly<br />
consistent size and shape, and extra processes are needed to make peanut<br />
butter, which is also traded (and regulated) as a commodity. About 25% of the<br />
groundnut consumed on the world market is roasted, salted and eaten as a<br />
snack and more than half the groundnut consumed <strong>in</strong> the US is <strong>in</strong> the <strong>for</strong>m of<br />
peanut butter (Onwueme and S<strong>in</strong>a 1991). On the <strong>in</strong>ternational market, poor<br />
quality groundnut is used <strong>in</strong> the manufacture of animal feed and birdfood. In<br />
groundnut-produc<strong>in</strong>g countries, green groundnut (arachide vert), fresh<br />
groundnut (arachide frais) and groundnut seed are also traded.<br />
<strong>Groundnut</strong> is commonly exported <strong>in</strong> 50 kg sacks, <strong>in</strong> m<strong>in</strong>imum shipments<br />
of 18 to 22 MT (a conta<strong>in</strong>er load of <strong>in</strong>-shell and shelled groundnut,<br />
respectively). Buyers usually require a general phytosanitary health<br />
certification from a reputable laboratory, and possibly further certification<br />
that the product has been fumigated with an <strong>in</strong>secticide such as alum<strong>in</strong>ium<br />
phosphide. This requirement has been identified as a major constra<strong>in</strong>t to the<br />
development of an <strong>in</strong>ternational trade <strong>in</strong> organic groundnut, <strong>for</strong> which the<br />
profit marg<strong>in</strong>s have not yet become compell<strong>in</strong>g (Kettlewell 2003).<br />
5
In general, recent decades have seen an <strong>in</strong>crease <strong>in</strong> the consumption of<br />
groundnut <strong>for</strong> all uses. There has been a shift away from its use <strong>for</strong> oil and<br />
meal (<strong>for</strong> which there are substitutes, notably soya) and toward confectionary<br />
groundnut, <strong>for</strong> which there are no exact substitutes. Indeed, world imports of<br />
confectionary groundnut grew by an astonish<strong>in</strong>g 83% from 1979-81 to 1994-<br />
96 (Freeman et al. 1999). However, as product quality standards are far higher<br />
<strong>for</strong> edible groundnut, this trend implies a correspond<strong>in</strong>g <strong>in</strong>crease <strong>in</strong> product<br />
quality (particularly <strong>in</strong> terms of Aspergillus, the fungal source of the<br />
carc<strong>in</strong>ogen aflatox<strong>in</strong> (see Appendix 5, Quality aspects of groundnuts <strong>in</strong> trade).<br />
6
2.0 <strong>West</strong> <strong>Africa</strong>n groundnut markets<br />
2.1 Recent trends <strong>in</strong> production and consumption<br />
S<strong>in</strong>ce early 1970s, groundnut consumption patterns have shifted. While total<br />
consumption <strong>in</strong> eastern and southern <strong>Africa</strong> has decl<strong>in</strong>ed, groundnut<br />
utilization <strong>in</strong> <strong>West</strong> <strong>Africa</strong> has <strong>in</strong>creased significantly due to a shift toward<br />
edible applications. S<strong>in</strong>ce the late 1980s, groundnut <strong>in</strong> <strong>West</strong> <strong>Africa</strong> has<br />
become primarily a food crop rather than an oilseed, as <strong>in</strong>dicated <strong>in</strong> the table<br />
below. Between 1972 and 2000, the proportion of <strong>West</strong> <strong>Africa</strong>n groundnuts<br />
consumed as food grew by an astonish<strong>in</strong>g 209% (Table 1).<br />
Table 1. <strong>West</strong> <strong>Africa</strong>n utilization of groundnut by five-year average, 1972-2000.<br />
1972-75 1976-80 1981-85 1986-90 1991-95 1996-2000<br />
<strong>Groundnut</strong><br />
consumed (MT) 2,520,000 2,498,000 2,498,000 2,722,000 3,050,000 4,215,000<br />
Proportion as food 29.9% 36.0% 43.3% 44.5% 51.0% 55.3%<br />
Proportion crushed 61.3% 53.4% 43.2% 45.1% 37.3% 32.5%<br />
Seed, feed and waste 8.9% 10.7% 13.5% 10.5% 11.7% 12.2%<br />
Source: Revoredo and Fletcher 2002.<br />
Trade patterns have also shifted significantly dur<strong>in</strong>g the same period.<br />
From 1972-75, the four project countries had a significant profile on the<br />
<strong>in</strong>ternational market, together hold<strong>in</strong>g 14.5% of world exports (Nigeria had<br />
7.3%, Senegal 4.6%, Mali 2.1% and Niger 1.6% of total world exports). By the<br />
1996-2000 period, only Senegal rema<strong>in</strong>ed on the <strong>in</strong>ternational market, with a<br />
mere 0.6% of world exports dur<strong>in</strong>g that period (Revoredo and Fletcher 2002),<br />
90% of which was dest<strong>in</strong>ed <strong>for</strong> the European Union.<br />
The decl<strong>in</strong>e of <strong>Africa</strong>n groundnut exports is related to the trend toward<br />
production of edible groundnut, which was poorly timed <strong>in</strong> respect to<br />
<strong>in</strong>creas<strong>in</strong>g aflatox<strong>in</strong> restrictions as well as <strong>in</strong>creas<strong>in</strong>g <strong>in</strong>dustrial substitution by<br />
other oils, particularly cottonseed and soya.<br />
2.2 <strong>Market</strong> characteristics of the study area<br />
As the Senegal market operates accord<strong>in</strong>g to its own structures and<br />
procedures, with an overall net demand given its <strong>in</strong>dustrial base, and that of<br />
7
Gambia as well, Mali and Niger serve as net providers of groundnut to the<br />
excess demand of the Senegalese and Nigerian markets. This is not to<br />
oversimplify the complex trade relationships discussed further <strong>in</strong> this section.<br />
The market is still based largely on the oilseed and meal, but the trend <strong>in</strong> the<br />
last 30 years has been <strong>in</strong>creas<strong>in</strong>gly toward edible groundnut.<br />
In each of the countries studied, groundnut quality is determ<strong>in</strong>ed by<br />
condition (especially moisture content) <strong>in</strong> addition to characteristics (oil<br />
content and nut size).<br />
Results of the <strong>West</strong> <strong>Africa</strong> study <strong>in</strong>dicate that national markets serve a<br />
diversity of buyer preferences, nationally and on the part of sub-regional<br />
traders, eg, Nigerian traders buy<strong>in</strong>g on the Maradi and Niamey markets.<br />
A high oil yield was the most favored characteristic cited by buyers, but<br />
other attributes of certa<strong>in</strong> ‘traditional’ varieties are known to appeal to<br />
regional traders. Buyers seem to show a general preference <strong>for</strong> larger nuts<br />
(1-2 per pod) rather than the early-yield<strong>in</strong>g varieties, though others expressed<br />
a preference <strong>for</strong> the small reddish (Spanish) types, which are perceived as<br />
lower <strong>in</strong> humidity.<br />
Global trends (discussed above and <strong>in</strong> greater detail <strong>in</strong> Section 4) show<br />
broad displacement of groundnut as an oilseed crop, and <strong>in</strong>dicate a movement<br />
toward edible products of a wide variety of trade and consumer preferences.<br />
Though oilseed groundnut still dom<strong>in</strong>ates national markets <strong>in</strong> each of the<br />
countries studied, country data shows a price lead above oilseed groundnut,<br />
but the significance of this ‘premium’ is not strongly remunerative given<br />
higher production costs.<br />
Trends toward edible groundnut are reflective (or symptomatic) of<br />
market ga<strong>in</strong>s made by soya on the global market over a 30-year period, as a<br />
competitor to groundnut both as an oilseed and source of meal (Revoredo and<br />
Fletcher 2002).<br />
In <strong>West</strong> <strong>Africa</strong>, <strong>in</strong>creas<strong>in</strong>g competition is highest from cottonseed,<br />
production of which is ris<strong>in</strong>g <strong>in</strong> Mali and Nigeria, though palm oil and soya are<br />
also strong competitors. Production of sesame is also on the <strong>in</strong>crease <strong>in</strong> Niger<br />
and Nigeria (Ndjeunga, Ntare and Schill<strong>in</strong>g 2002). Like groundnut, and to a<br />
greater extent than soya, sesame has a great potential to meet nutritional<br />
needs as well as market potentials as an oilseed and source of meal.<br />
Un<strong>for</strong>tunately, <strong>West</strong> <strong>Africa</strong> is poorly situated to meet the demand <strong>for</strong><br />
edible groundnut unless a commitment is made to address supply cha<strong>in</strong> issues<br />
of postharvest process<strong>in</strong>g and product quality.<br />
8
The sub-regional market is constra<strong>in</strong>ed by high transaction costs, of<br />
which the highest is clearly transport account<strong>in</strong>g <strong>for</strong> more than half of<br />
transaction costs: 55% <strong>for</strong> regional or cross-border trade, and over 70% of<br />
domestically-traded groundnut. These estimates are consistent with Camara<br />
1992, Gaye 1992, Savadogo et al. 1992 and Gabre-Mahd<strong>in</strong> et al. 1992, as<br />
cited <strong>in</strong> Barry et al.: “Transportation costs represent more than half of total<br />
transfer costs of agricultural products <strong>in</strong> <strong>West</strong> <strong>Africa</strong>.”<br />
Transport costs <strong>for</strong> the Dosso region of Niger were also calculated <strong>in</strong> a<br />
previous study to be between 6 and 20 fCFA/dt*km (Abele 2000). Though<br />
most respondents expressed a strong desire to avoid storage <strong>for</strong> anyth<strong>in</strong>g more<br />
than the required m<strong>in</strong>imum (due to moisture content and related product<br />
quality considerations), storage costs were not found to be significant as<br />
compared to transport and related costs.<br />
The cost of trad<strong>in</strong>g groundnut nationally and regionally was considered <strong>in</strong><br />
Niger, where the most detailed market <strong>in</strong><strong>for</strong>mation was obta<strong>in</strong>ed and<br />
corroborated. A model was established on the basis of <strong>in</strong>terviews with traders<br />
on the national markets. A mid-level trader of Niamey moves 5,000 sacks of<br />
groundnut (<strong>in</strong> shell) each year, at an average value of fCFA 9,500. Based on the<br />
costs of transportation, storage, market dues and other costs, the transaction<br />
costs of a domestically-procured bag of groundnut total fCFA 615 above the<br />
farm-gate price, whereas the transaction costs of a sack obta<strong>in</strong>ed across the<br />
border rise to fCFA 2,615, a factor of more than 4.<br />
Transaction costs and their estimates, as both an element of total<br />
transaction costs, and as a percentage of total product value, is provided <strong>in</strong><br />
Table 2.<br />
On the whole, transaction costs comprised roughly 7% of the value of a<br />
sack of groundnut (<strong>in</strong>-shell). However, on the regional market (with a s<strong>in</strong>gle<br />
border cross<strong>in</strong>g), this figure rises to more than 27%.<br />
It is important to note that these figures represent aggregate transaction<br />
costs and not necessarily those borne by a s<strong>in</strong>gle party (ie, the trader himself).<br />
While national market transport costs are commonly borne by sellers (ie, by<br />
primary buyers, or by the producers themselves), regional trade is undertaken<br />
by specialists who hold strong preferences based on their consumers; <strong>for</strong><br />
<strong>in</strong>stance, <strong>in</strong> Ivory Coast variety 47-10, known <strong>for</strong> its high oil content is much<br />
preferred.<br />
A lack of reliable <strong>in</strong><strong>for</strong>mation on price and supply (as well as exchange<br />
rates) compounds risk and adds to transaction costs <strong>for</strong> both producers<br />
and traders.<br />
9
Table 2. Transaction costs analysis.<br />
2.3 Conclusions<br />
Faced with competition from other oilseed crops and <strong>in</strong>creased demand <strong>for</strong><br />
edible groundnut (on a global scale as well as with<strong>in</strong> <strong>West</strong> <strong>Africa</strong>), market<br />
trends favor a diversity of market applications, <strong>in</strong>clud<strong>in</strong>g oilseed and edible<br />
nuts (ARB).<br />
Oilseed and meal<br />
As an oilseed and meal crop, groundnut has steadily lost ground to its ma<strong>in</strong><br />
competitors, cottonseed and soya, and there is no immediate prospect of a<br />
reversal of this trend. However, despite a largely unremunerative market <strong>for</strong><br />
producers, comparative advantages of groundnut are the existence of wellestablished<br />
<strong>for</strong>mal and <strong>in</strong><strong>for</strong>mal market outlets and steady (mostly unmet)<br />
<strong>in</strong>dustrial demand, as well as the significance of groundnut <strong>in</strong> the <strong>West</strong> <strong>Africa</strong>n<br />
diet, which is not the case <strong>for</strong> cottonseed or soya.<br />
Cottonseed represents a by-product of a more remunerative crop than<br />
groundnut, and as such, it is well-positioned to compete as an oilseed. As meal<br />
10<br />
Percentage of total transaction cost<br />
Transaction Cost Domestic Export<br />
Sack 16% 3%<br />
<strong>Market</strong> tax 0.08% -<br />
Storage 9% 2%<br />
Loaders - 38%<br />
Vehicle 73% 17%<br />
Subtotal transport 73% 55%<br />
Percentage of average product value<br />
Transaction Cost Domestic Export<br />
Sack 1% 1%<br />
<strong>Market</strong> tax 0.05% 0.05%<br />
Storage 0.60% 0.60%<br />
Loaders - 10%<br />
Vehicle 4% 4%<br />
Subtotal transport 4% 14%
it is less valued given its lower prote<strong>in</strong> content and trace amounts of the toxic<br />
polyphenol gossypol, to which chickens <strong>in</strong> particular are sensitive.<br />
Though soya conta<strong>in</strong>s higher prote<strong>in</strong> content than groundnut, its use as a<br />
foodstuff <strong>in</strong> <strong>West</strong> <strong>Africa</strong> is not well-established. Though it may f<strong>in</strong>d<br />
acceptance on urban markets, soya oil does not satisfy the local market’s taste<br />
preferences, which favors groundnut oil. Sesame rema<strong>in</strong>s more of a food crop<br />
than an oilseed crop, with fewer product and market applications than<br />
groundnut.<br />
Given the subsistence status of most <strong>West</strong> <strong>Africa</strong>n farmers, groundnut<br />
offers more versatility as a well-established food crop (unlike cottonseed and<br />
soya) with a diversity of market applications (unlike sesame).<br />
The strong ‘traditional’ role of groundnut both <strong>in</strong> the kitchens and the<br />
markets of <strong>West</strong> <strong>Africa</strong> is likely to preserve the considerable market share <strong>for</strong><br />
groundnut as an oilseed and meal <strong>in</strong> addition to the grow<strong>in</strong>g market share of<br />
edible groundnut.<br />
Edible groundnut<br />
While the <strong>West</strong> <strong>Africa</strong>n oilseed and meal groundnut sub-sector is beset by<br />
competition, as an edible product groundnut has no direct competition – it is a<br />
very specific commodity <strong>in</strong> confectionery and other applications, has high<br />
prote<strong>in</strong> content, and is prevalent <strong>in</strong> <strong>West</strong> <strong>Africa</strong>n diets.<br />
However, despite its great potential, the edible groundnut markets are<br />
constra<strong>in</strong>ed by quality concerns with regards to <strong>in</strong>fection by Aspergillus. This<br />
entails <strong>in</strong>creased risk as well as postharvest labor <strong>in</strong>puts by the producer, both<br />
of which are difficult to quantify.<br />
Aflatox<strong>in</strong> not only represents a barrier to export, but considerable<br />
concern to public health, as groundnut provides a greater share of dietary<br />
prote<strong>in</strong> than does meat. In manag<strong>in</strong>g supply-cha<strong>in</strong> quality issues related to<br />
aflatox<strong>in</strong>, the challenge will be to persuade producers to <strong>in</strong>vest <strong>in</strong> improved<br />
postharvest process<strong>in</strong>g methods, improved seed and other <strong>in</strong>puts, despite the<br />
fragile economic position of most groundnut farmers.<br />
In general, farmers <strong>in</strong> each of the four countries studied are highly riskaverse,<br />
serv<strong>in</strong>g subsistence needs more than market demands. That the vast<br />
majority of sales <strong>in</strong> each county takes place immediately after the harvest<br />
(when prices are lowest) partly reflects payment of credit arrangements and<br />
other accumulated debts, <strong>in</strong>clud<strong>in</strong>g those accrued through purchase of food<br />
crops to supplement those grown by the household. Transaction costs are high,<br />
11
particularly as regards transport and border <strong>for</strong>malities <strong>in</strong> the case of<br />
regional trade.<br />
A major reason <strong>for</strong> high transaction costs is a general lack of <strong>in</strong><strong>for</strong>mation<br />
on price and supply <strong>for</strong> producers and small traders. While this aspect is<br />
problematic enough on national markets, the high cost of cross<strong>in</strong>g borders and<br />
transport greatly multiplies the cost of a poorly-timed purchase or sale.<br />
2.4 Strategies <strong>for</strong> <strong>West</strong> <strong>Africa</strong><br />
Though all the countries that produce groundnut are prone to aflatox<strong>in</strong><br />
<strong>in</strong>festation, <strong>Africa</strong> is considered particularly problematic by <strong>in</strong>ternational<br />
buyers. The perception is that production cha<strong>in</strong> <strong>in</strong> all countries (with the<br />
exception of South <strong>Africa</strong>) is fragmented, production systems <strong>in</strong>sufficient to<br />
address the problem, aflatox<strong>in</strong> monitor<strong>in</strong>g by crop virtually nonexistent, and<br />
pre-shipment <strong>in</strong>spection services lack reliability.<br />
Un<strong>for</strong>tunately, <strong>in</strong>ternational trade <strong>in</strong> groundnut is based on confidence<br />
and reliability <strong>in</strong> terms of supply as well as product quality. The current EU<br />
regulations on aflatox<strong>in</strong> have certa<strong>in</strong>ly contributed to an <strong>in</strong>creas<strong>in</strong>gly<br />
conservative tendency among European buyers, who are unlikely to take any<br />
unnecessary risks as regards aflatox<strong>in</strong>.<br />
An un<strong>for</strong>tunate and direct economic consequence is that <strong>for</strong> <strong>West</strong> <strong>Africa</strong><br />
to re-enter the world groundnut market (and particularly the European<br />
market, which offers perhaps the greatest potential), export prices would<br />
have to compete favorably with Ch<strong>in</strong>ese groundnut, which is abundant, cheap<br />
and enjoys a favorable reputation <strong>in</strong> terms of reliable supply and quality.<br />
Even without these perceptions, the current and <strong>for</strong>eseeable marg<strong>in</strong>s of<br />
return do not favor the re-entry of <strong>West</strong> <strong>Africa</strong>n exports <strong>in</strong> world market:<br />
recent prices <strong>for</strong> Ch<strong>in</strong>ese groundnut are on the order of $650 per MT – the<br />
same price as production of a ton of edible groundnut (ARB) under irrigation<br />
<strong>in</strong> Senegal.<br />
On the other hand, though the trade l<strong>in</strong>kages are not as established (or<br />
cheap) as those between <strong>West</strong> <strong>Africa</strong> and Europe, the South <strong>Africa</strong>n market<br />
does represent a significant potential opportunity <strong>for</strong> <strong>West</strong> <strong>Africa</strong>n producers.<br />
Due to a poor harvest <strong>in</strong> 2003, South <strong>Africa</strong> has been import<strong>in</strong>g groundnut<br />
from southern <strong>Africa</strong> and even Argent<strong>in</strong>a at premium prices – over $700 per<br />
MT (unsorted and CIF) <strong>in</strong> Malawi. There may be scope <strong>for</strong> entry on to the<br />
South <strong>Africa</strong>n market once aflatox<strong>in</strong> has been addressed by improved<br />
management and monitor<strong>in</strong>g of product quality at the crop level.<br />
12
The primary conclusion of this study is that resources should be devoted<br />
to improvement of the production cha<strong>in</strong> of the groundnut sector <strong>in</strong> each<br />
producer country, with <strong>in</strong>itial emphasis on production to satisfy national, subregional<br />
and even regional demand.<br />
While the structural details of such a program would be negotiated on a<br />
country-by-country basis – and state <strong>in</strong>tervention is <strong>in</strong> any case likely to<br />
rema<strong>in</strong> limited – common features might <strong>in</strong>clude the establishment of public<br />
warehouses and/or buy<strong>in</strong>g po<strong>in</strong>ts, at which production would be sorted,<br />
graded and tested <strong>for</strong> aflatox<strong>in</strong> contam<strong>in</strong>ation and other parameters of<br />
product quality.<br />
In assess<strong>in</strong>g the current and <strong>for</strong>eseeable market opportunities <strong>for</strong><br />
opportunities <strong>for</strong> groundnut of <strong>West</strong> <strong>Africa</strong>n orig<strong>in</strong>, it will be crucial to build<br />
slowly and deliberately on exist<strong>in</strong>g strengths (<strong>in</strong>clud<strong>in</strong>g the availability of<br />
improved seed through the current project), with specific and focused<br />
attention to the production cha<strong>in</strong> – specifically those cultivation, harvest and<br />
postharvest methods which prevent <strong>in</strong>fection of the product by Aspergillus,<br />
and thereby ensure product quality.<br />
The follow<strong>in</strong>g recommendations are made on the basis of <strong>in</strong>terviews with<br />
a wide variety of stakeholders, from the groundnut farmers of the focus<br />
countries to European buyers and brokers <strong>in</strong> groundnut:<br />
In terms of potential export of <strong>West</strong> <strong>Africa</strong>n groundnut to Europe, it is<br />
important to note that pre-shipment <strong>in</strong>spection and certification is not<br />
universally accepted by European buyers – <strong>in</strong>clud<strong>in</strong>g certification both by<br />
governmental <strong>in</strong>spection bodies and by private companies contracted to<br />
importers. The great importance of reputation – of a proven track record of<br />
responsible per<strong>for</strong>mance – cannot be over-estimated.<br />
In order to <strong>in</strong>itiate an export relationship to a European buyer, <strong>for</strong> <strong>in</strong>stance,<br />
it may thus be necessary <strong>for</strong> an export<strong>in</strong>g entity to first assemble a<br />
m<strong>in</strong>imum order of one conta<strong>in</strong>er of groundnut – typically 18 MT of <strong>in</strong>-shell<br />
or 22 MT of shelled product – and pay <strong>for</strong> the transit shipment of the<br />
product to the port of the purchaser (probably Rotterdam). If, on analysis <strong>in</strong><br />
transit, the shipment is proven to be ‘clean’, the purchase price and<br />
transport costs will happily be borne by the buyer – and an important<br />
precedent will have been established.<br />
First, the export<strong>in</strong>g entity must seek to identify aflatox<strong>in</strong>-free groundnut. This<br />
may be the produce of a given locality, cooperative or even of an <strong>in</strong>dividual<br />
13
farmer. The advantages of be<strong>in</strong>g able to offer aflatox<strong>in</strong>-free groundnut even <strong>in</strong><br />
smaller quantities (m<strong>in</strong>imum 18/22 MT) may entice importers to take the risk<br />
and purchase from an as-yet unproven po<strong>in</strong>t of orig<strong>in</strong>.<br />
There is considerable advantage to provid<strong>in</strong>g hand-picked and selected<br />
(HPS) groundnut, as would be the case from <strong>West</strong> <strong>Africa</strong>. Production<br />
standards can slip when mechanical grad<strong>in</strong>g technologies are employed, as<br />
recently happened <strong>in</strong> South <strong>Africa</strong>.<br />
If aflatox<strong>in</strong>-free groundnut cannot be found <strong>in</strong> sufficient quantities to<br />
assemble a m<strong>in</strong>imum shipment of 18/22 MT, it may be more sensible to<br />
aim <strong>for</strong> a different sub-sector of the <strong>in</strong>ternational market – either animal<br />
feed, birdfood or oil-stock, each of which allows <strong>for</strong> successively greater<br />
levels of aflatox<strong>in</strong> contam<strong>in</strong>ation.<br />
Given the great importance of the ‘track record’ of the various po<strong>in</strong>ts of<br />
orig<strong>in</strong> as regards reliability of quality, it is more important <strong>for</strong> a given<br />
exporter to deal responsibly with the issue of product quality than to try to<br />
push an <strong>in</strong>ferior product on the importer. Given the great str<strong>in</strong>gency of<br />
transit <strong>in</strong>spection services (particularly <strong>in</strong> European ports), one can be quite<br />
certa<strong>in</strong> that any quality problem will <strong>in</strong>deed be noticed – and if this comes<br />
as a surprise to the buyer, it is most unlikely that the seller will ever be<br />
offered a second chance under current and <strong>for</strong>eseeable market conditions.<br />
It is thus strongly recommended that the project and ICRISAT consider the<br />
establishment of a harmonized sub-regional program to address the specific<br />
technical constra<strong>in</strong>ts of the smallholder groundnut farmers of <strong>West</strong> <strong>Africa</strong>.<br />
These currently stand as an obstacle to export development, and put<br />
national populations at <strong>in</strong>creased risk of serious health problems through<br />
consumption of groundnut <strong>in</strong>fected with aflatox<strong>in</strong>.<br />
With such a program <strong>in</strong> place, a system of product quality certification may<br />
be developed over time, <strong>in</strong> collaboration with national and <strong>in</strong>ternational<br />
analytical laboratories.<br />
In the meantime, the project could help to build national and regional<br />
trade opportunities <strong>for</strong> producers by monitor<strong>in</strong>g groundnut supply and price<br />
<strong>in</strong><strong>for</strong>mation on local and national markets, and facilitate the diffusion of such<br />
crucial <strong>in</strong><strong>for</strong>mation to sector stakeholders via rural radio and other locally<br />
appropriate means.<br />
14
3.0 Ma<strong>in</strong> produc<strong>in</strong>g countries on<br />
the <strong>in</strong>ternational market<br />
3.1 Introduction: <strong>Groundnut</strong> and groundnut<br />
products <strong>in</strong> trade<br />
<strong>Groundnut</strong> trade on <strong>in</strong>ternational markets accounts <strong>for</strong> a mere 4-6% of total<br />
world production; the vast majority of world groundnut production serves<br />
subsistence needs and domestic market requirements.<br />
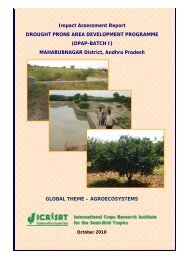
Moreover, exports of edible groundnut are concentrated among only a<br />
few countries of orig<strong>in</strong> – most notably Ch<strong>in</strong>a, the United States, Argent<strong>in</strong>a<br />
and India – between which relative market shares have changed considerably<br />
over the past 30 years (Figure 1).<br />
Figure 1. Trend <strong>in</strong> the world edible groundnut export market share, major<br />
exporters, 1972-98.<br />
Source: Peanut Trade and the World Trade Organization<br />
This section briefly describes the recent and current export production<br />
of these four ma<strong>in</strong> countries of orig<strong>in</strong>, as well as South <strong>Africa</strong>. Of these<br />
countries, Argent<strong>in</strong>a and South <strong>Africa</strong> may be considered as particularly<br />
export-oriented, while the domestic market share is generally first priority <strong>for</strong><br />
Ch<strong>in</strong>a, the US and India.<br />
While the role of trade regulations <strong>in</strong>clud<strong>in</strong>g tariffs, duties and quotas<br />
will be touched upon, a concise summary of regulatory trade policies may be<br />
found <strong>in</strong> Appendix 3, Current trade and domestic policies on groundnut<br />
(2003).<br />
15
3.2 Ch<strong>in</strong>a<br />
With a production base of over 15 million tons (MT) of groundnut <strong>in</strong> 2002,<br />
Ch<strong>in</strong>a produces close to half of the total world crop (this dom<strong>in</strong>ance is rather<br />
graphically illustrated on the FAOSTAT database, where Ch<strong>in</strong>ese groundnut<br />
production figures are actually situated above the world total – all other<br />
produc<strong>in</strong>g countries be<strong>in</strong>g strictly relegated to alphabetical order!).<br />
Account<strong>in</strong>g <strong>for</strong> over 26% of shelled groundnut exports and 34% of <strong>in</strong>shell<br />
exports over the past decade, Ch<strong>in</strong>a is by far the world’s largest producer<br />
and exporter of groundnut.<br />
Ch<strong>in</strong>a is generally considered to be a responsible country of orig<strong>in</strong> <strong>in</strong><br />
terms of aflatox<strong>in</strong> conta<strong>in</strong>ment, though problems have been known <strong>in</strong> recent<br />
years – particularly <strong>in</strong> the production areas of Henan and Liaon<strong>in</strong>g. In the<br />
1999 crop – which was problematic <strong>for</strong> all world orig<strong>in</strong>s – high moisture levels<br />
and fungal contam<strong>in</strong>ation were noted <strong>in</strong> the Hsuji variety, and the Virg<strong>in</strong>ia was<br />
affected both by fungal contam<strong>in</strong>ation and by aflatox<strong>in</strong>. Nonetheless, Ch<strong>in</strong>a is<br />
still recognized as consistently reliable <strong>in</strong> terms of quality.<br />
Ch<strong>in</strong>ese groundnut is among the most competitively priced of the three<br />
‘reliable’ orig<strong>in</strong>s <strong>in</strong> terms of aflatox<strong>in</strong> – the other two are Argent<strong>in</strong>a and the<br />
USA. Prices <strong>for</strong> groundnut of Ch<strong>in</strong>ese orig<strong>in</strong> typically range between $600 to<br />
$650 per ton, and occasionally higher. The Ch<strong>in</strong>ese orig<strong>in</strong> has been described<br />
by one importer as a “click fund,” which can supply a nearly unlimited volume<br />
of product once a certa<strong>in</strong> market price is reached.<br />
Ch<strong>in</strong>ese producers are highly responsive to market conditions, with a<br />
magnitude of response that can be very impressive. Between the 1999 and<br />
2000 crops, production of groundnut <strong>in</strong>creased by about 15%, <strong>in</strong> response to<br />
low maize prices <strong>in</strong> 1999. Fortunately <strong>for</strong> the producers, the 2000 Ch<strong>in</strong>ese<br />
groundnut crop was much less affected by aflatox<strong>in</strong> contam<strong>in</strong>ation than was<br />
the 1999 crop, so most of this <strong>in</strong>creased production was sold.<br />
Domestic demand <strong>in</strong> Ch<strong>in</strong>a is quite a considerable factor, particularly <strong>for</strong><br />
crush<strong>in</strong>g to serve the groundnut oil market, which takes up approximately<br />
60% of the Ch<strong>in</strong>ese groundnut crop. <strong>Groundnut</strong> oil prices are currently at a<br />
stagger<strong>in</strong>g (and, most agree, unsusta<strong>in</strong>able) high of $1,400 per MT, up from<br />
the usual $900. This factor is currently push<strong>in</strong>g up the price of all groundnut<br />
types and applications, and is not expected to cont<strong>in</strong>ue.<br />
16
3.3 The United States of America<br />
Hav<strong>in</strong>g supplied over 17% of the world’s shelled groundnut exports and over<br />
22% of <strong>in</strong>-shell exports over the past decade, the United States is the second<br />
largest exporter of shelled groundnut <strong>in</strong> the world. However, the US share of<br />
the world groundnut market has decl<strong>in</strong>ed precipitously over the past two<br />
decades, from approximately 32.9% between 1981 and 1985 (correspond<strong>in</strong>g<br />
to a trade volume of 354,000 MT) to 19.8% between 1996 and 2000,<br />
correspond<strong>in</strong>g to a trade volume of 294,000 MT (Revoredo and Fletcher<br />
2002).<br />
Export of US-orig<strong>in</strong> groundnut has historically been strongly regulated<br />
by the US government, l<strong>in</strong>ked directly and legislatively to the domestic<br />
market. Perhaps the clearest synopsis of the <strong>for</strong>mer US government regulation<br />
of the groundnut sector is provided by the American Peanut Coalition, as put<br />
<strong>for</strong>ward on their website:<br />
The [US] federal peanut program consist[ed] of a system of<br />
restrictive production quotas, high price supports and severe import<br />
restrictions. Together, these features fix the domestic price <strong>for</strong><br />
peanut quota owners well above the world market price. The<br />
program mandates by law the amount of peanuts that can be grown<br />
<strong>for</strong> domestic consumption, fixes the excessive price that quota<br />
holders receive <strong>for</strong> peanuts and fixes the quantity of imported<br />
peanuts that are eligible <strong>for</strong> access to the US market.<br />
American Peanut Coalition, ‘www.go-peanuts.org’<br />
Given the grand scope and Byzant<strong>in</strong>e <strong>in</strong>tricacies of US government<br />
<strong>in</strong>tervention <strong>in</strong> the groundnut sector, it would be easy to become lost <strong>in</strong> a<br />
tangential history, which would ultimately be of little practical use here. What<br />
follows is a very brief account of this history and current US production and<br />
market conditions as they may specifically relate to the assignment.<br />
Government regulation of the US groundnut market <strong>in</strong> general, and<br />
exports <strong>in</strong> particular, began with the Agricultural Adjustment Act of 1933, a<br />
piece of classic ‘New Deal’ legislation which <strong>in</strong>itially provided commodity<br />
loans and set market<strong>in</strong>g quota limits on groundnut, tobacco, sugar and milk.<br />
Section 22 of the 1933 Act authorized the US president to set quantitative<br />
import restrictions on agricultural products <strong>for</strong> which price support programs<br />
were adm<strong>in</strong>istered by the United States Department of Agriculture (USDA).<br />
The 1933 Act effectively established what was to become the ‘peanut<br />
program’ of the USDA.<br />
17
Follow<strong>in</strong>g a 1936 rul<strong>in</strong>g that certa<strong>in</strong> aspects of production control <strong>in</strong> the<br />
1933 Act were unconstitutional, the US Congress responded with the<br />
Agricultural Adjustment Act of 1938, under which the peanut program was<br />
further developed by price supports <strong>in</strong> addition to quota limits. The peanut<br />
program would eventually go well beyond this, to set crop f<strong>in</strong>anc<strong>in</strong>g<br />
arrangements, and even to determ<strong>in</strong>e areas of groundnut production.<br />
<strong>Groundnut</strong>s are currently the sole food product <strong>for</strong> which the US federal<br />
government controls domestic supply. It determ<strong>in</strong>es the specific volume of<br />
groundnut to be sold dur<strong>in</strong>g a given year, and by whom through restrictive<br />
annual quotas, which also establish what proportion of the US crop will be<br />
allowed to enter the export market dur<strong>in</strong>g any given year, and at what price.<br />
The effect of this <strong>in</strong>tervention was essentially to make groundnuts and<br />
groundnut products artificially ‘scarce’ – and correspond<strong>in</strong>gly more expensive<br />
than they would otherwise be accord<strong>in</strong>g to the supply and demand of a free<br />
and unregulated market. The US (Government) General Account<strong>in</strong>g Office<br />
estimated <strong>in</strong> 1997 that American consumers are obliged to spend as much as<br />
$513 million more each year <strong>for</strong> groundnut products protected under the<br />
peanut program.<br />
In recent years, and specifically with the re<strong>for</strong>ms brought to the US<br />
groundnut sector under the 2002 Farm Act, the US groundnut sector has been<br />
liberalized. Perhaps the most concise account of these changes comes from<br />
Begh<strong>in</strong>, Diop, Matthey and Sewadeh 2003:<br />
18<br />
The 2002 farm bill elim<strong>in</strong>ated production quotas with a quota<br />
buyout and converted the <strong>for</strong>mer peanut price support program to a<br />
system of direct and countercyclical payments and a price floor cum<br />
production subsidy (non-recourse loans with market<strong>in</strong>g loan<br />
provisions). The key features of the new program are as follows:<br />
1. All groundnut producers now have equal access to a market<strong>in</strong>g<br />
loan program, under which producers can pledge their crops as<br />
collateral to obta<strong>in</strong> a market<strong>in</strong>g loan rate ($355/short ton).<br />
Producers may repay the loan at a rate that is the lesser of the<br />
repayment rate set by the US Department of Agriculture<br />
(USDA) plus <strong>in</strong>terest or the market<strong>in</strong>g loan rate plus <strong>in</strong>terest, or<br />
they can <strong>for</strong>feit the loan (Revoredo and Fletcher 2002).
2. Producers with a history of groundnut production dur<strong>in</strong>g the<br />
1998-2001 period receive a fixed “decoupled” payment and a<br />
countercyclical payment. Eligible production is the product of<br />
average yield <strong>in</strong> the base period and 85 percent of base-period<br />
acres. The countercyclical payment kicks <strong>in</strong> when market prices<br />
fall below an established target price of $495 net of the direct<br />
payment ($36/short ton). The payment rate is the difference<br />
between the target price net of the fixed payment and the higher<br />
of the 12-month national average market price <strong>for</strong> the market<strong>in</strong>g<br />
year <strong>for</strong> groundnuts or the market<strong>in</strong>g assistance loan rate.<br />
3. Former owners of groundnut quotas receive compensation<br />
payments <strong>for</strong> the loss of quota asset value (see Revoredo and<br />
Fletcher 2002 <strong>for</strong> details).<br />
The elim<strong>in</strong>ation of production quotas decreased the price paid by<br />
US food processors and thus <strong>in</strong>creased domestic use of peanuts. It<br />
also took away the logic of import<strong>in</strong>g confectionery peanuts to<br />
lower the cost of process<strong>in</strong>g food items <strong>in</strong>tensive <strong>in</strong> peanuts. The<br />
US TRQ scheme is still <strong>in</strong> place but is redundant and the TRQs<br />
rema<strong>in</strong> underfilled (Fletcher and Revoredo 2003). The lower cost<br />
of production of peanut butter/paste <strong>in</strong> the United States follows<br />
the same logic. The <strong>in</strong>centive to import cheaper peanut butter/<br />
paste from Argent<strong>in</strong>a or Mexico has thus been seriously mitigated<br />
by the recent changes <strong>in</strong> the farm program. Production <strong>in</strong>centives<br />
created by the 2002 farm bill vary among different types of<br />
producers but the net effect is likely to be an <strong>in</strong>crease <strong>in</strong><br />
production. The fixed and countercyclical payments provide some<br />
<strong>in</strong>centives to <strong>in</strong>crease production and can be viewed as supply<strong>in</strong>duc<strong>in</strong>g<br />
subsidies (Adams et al. 2001).<br />
<strong>Groundnut</strong> of US orig<strong>in</strong> consistently sets the upper price limit of the<br />
<strong>in</strong>ternational market, with export prices from $600 to as high as $950 per ton.<br />
US groundnut enjoys an envied reputation <strong>for</strong> quality as well as reliability of<br />
supply.<br />
This is not to imply that the US crop is always a reliable source of supply,<br />
nor that it is always uni<strong>for</strong>mly free of aflatox<strong>in</strong>, which has <strong>in</strong>deed proven to be<br />
a serious problem <strong>in</strong> recent years. The most notable aflatox<strong>in</strong> <strong>in</strong>festation of the<br />
US crop was seen <strong>in</strong> the 1999, particularly <strong>in</strong> the southeastern US production<br />
areas (<strong>in</strong>clud<strong>in</strong>g Georgia and Virg<strong>in</strong>ia) – which suffered 60-70% rejection<br />
19
accord<strong>in</strong>g to European aflatox<strong>in</strong> standards. Of the lots certified as ‘aflatox<strong>in</strong>free’<br />
by the USDA dur<strong>in</strong>g that year – purchased at a premium of $30-40 per<br />
ton by a Dutch import<strong>in</strong>g company – about 60% were subsequently found to<br />
exceed EU standards <strong>for</strong> aflatox<strong>in</strong>. In that year, only the southwestern US<br />
production areas could supply aflatox<strong>in</strong>-free Virg<strong>in</strong>ia and Runner grades <strong>in</strong><br />
shells.<br />
3.4 Argent<strong>in</strong>a<br />
Argent<strong>in</strong>a accounts <strong>for</strong> over 16% of world shelled groundnut exports over the<br />
past decade, mak<strong>in</strong>g it the third largest exporter of shelled groundnut.<br />
Approximately 28.3% of the Argent<strong>in</strong>e crop was exported <strong>in</strong> 2001.<br />
Argent<strong>in</strong>e orig<strong>in</strong> is considered ‘the first replacement’ <strong>for</strong> US orig<strong>in</strong>.<br />
Argent<strong>in</strong>e groundnut is commonly priced between $600 and $900 per ton;<br />
prices are largely determ<strong>in</strong>ed by the US groundnut crop and Argent<strong>in</strong>a<br />
provides an important ‘backup’ supply <strong>for</strong> the US domestic market.<br />
Given its extensive domestic requirements of about 43,000 MT per year<br />
as well as its <strong>in</strong>ternational quality profile, world demand <strong>for</strong> Argent<strong>in</strong>e<br />
groundnut commonly exceeds available supply, and contracts may thus be<br />
made far <strong>in</strong> advance. However, this is not to say that aflatox<strong>in</strong> is not a problem<br />
<strong>in</strong> Argent<strong>in</strong>a – it certa<strong>in</strong>ly proved so <strong>in</strong> 1999 – and even (competitively-priced)<br />
Ch<strong>in</strong>a can compete quite favorably with Argent<strong>in</strong>a <strong>in</strong> terms of product quality.<br />
The 2001 national economic crisis had severe consequences <strong>for</strong><br />
Argent<strong>in</strong>e groundnut exporters, despite a good harvest and a clean crop.<br />
Export duties of 10% were en<strong>for</strong>ced (and rema<strong>in</strong> <strong>in</strong> place today), which –<br />
together with the cancellation of the 5% export subsidy – led to a total 15%<br />
net reduction <strong>in</strong> <strong>in</strong>come. Even the devaluation of the Argent<strong>in</strong>e peso to the<br />
dollar could not mitigate the damage, as many Argent<strong>in</strong>e exporters hold<br />
<strong>in</strong>vestment loans <strong>in</strong> US dollars, and could thus not fully benefit from an<br />
apparently beneficial exchange rate.<br />
3.5 India<br />
India supplied 9.1% of world shelled groundnut exports over the past decade,<br />
and nearly 7% of <strong>in</strong>-shell exports as well. Price-wise, groundnut of Indian<br />
orig<strong>in</strong> is consistently below that of Ch<strong>in</strong>a, at the bottom of the ‘big four’<br />
countries of orig<strong>in</strong>, a reflection of what might charitably be called quality<br />
concerns.<br />
20
Considered an ‘aflatox<strong>in</strong>-prone’ country of orig<strong>in</strong>, India is currently<br />
uni<strong>for</strong>mly shunned by European importers. The Indian groundnut export<br />
market was largely devastated by the adoption of the EU regulations <strong>for</strong><br />
aflatox<strong>in</strong>. Accord<strong>in</strong>g to statistics from the Indian Oilseeds & Produce<br />
Exporters Association (IOPEA), from 1997/98 to 2001/02, Indian groundnut<br />
exports fell by nearly 50%; FAOSTAT figures are consistent with this<br />
estimate. Exports of Indian groundnut to the EU are now limited to bird food<br />
usage (IOPEA 2003).<br />
<strong>Prospects</strong> <strong>for</strong> rehabilitation (or development) of the <strong>in</strong>ternational<br />
reputation of Indian groundnut, and its re-entry <strong>in</strong>to the European market are<br />
not very promis<strong>in</strong>g <strong>in</strong> the <strong>for</strong>eseeable future. In the meantime, Indonesia<br />
currently absorbs much of the Indian export crop, as it is less expensive than<br />
groundnut of Ch<strong>in</strong>ese orig<strong>in</strong>.<br />
Regardless of the <strong>in</strong>ternational demand <strong>for</strong> Indian groundnut, production<br />
has <strong>in</strong>creased significantly <strong>in</strong> recent years, most recently <strong>in</strong> response to<br />
opportunities on the world market <strong>for</strong> groundnut oil, which peaked at $1,500<br />
<strong>in</strong> August 2003.<br />
It is estimated that as much as 92% of the Indian groundnut crop is<br />
crushed <strong>for</strong> oil, ma<strong>in</strong>ly to serve the domestic market. With the bumper<br />
groundnut harvest <strong>in</strong> 1993, and after an <strong>in</strong>terregnum of 40 years, India reentered<br />
the world market as a supplier of groundnut oil, <strong>in</strong> direct competition<br />
with Senegal and Argent<strong>in</strong>a, both of which suffered significant crop losses<br />
dur<strong>in</strong>g the current (2003/2004) harvest.<br />
Though the world groundnut oil price re-adjusted itself rapidly with the<br />
re-emergence of India as a supplier (down to $1,170 by January 2004), this<br />
level is still significantly better than the domestic price. Fortunately <strong>for</strong> Indian<br />
producers, the export of over 50,000 MT of oil effectively protected the<br />
domestic price structure from crash<strong>in</strong>g <strong>in</strong> response to the 2003 bumper<br />
harvest (Ganguli 2004).<br />
3.6 Vietnam<br />
Vietnam accounts <strong>for</strong> 8.2% of world shelled groundnut exports, most of which<br />
are dest<strong>in</strong>ed <strong>for</strong> Indonesia, Malaysia, the Philipp<strong>in</strong>es and Japan. Although<br />
some groundnut of Vietnamese orig<strong>in</strong> has recently reached the US market<br />
under Pacific Rim trade agreements, it is rather scarce on the European<br />
market.<br />
21
3.7 South <strong>Africa</strong><br />
Account<strong>in</strong>g <strong>for</strong> 2.2% of shelled groundnut exports over the past decade, South<br />
<strong>Africa</strong>n groundnut is considered to be among the best quality <strong>in</strong> the world, and<br />
is commonly priced on a par with Argent<strong>in</strong>a, rang<strong>in</strong>g from $600 to as high as<br />
$870 per ton.<br />
A very high domestic demand also tends to float South <strong>Africa</strong>n<br />
groundnut prices, a factor discussed further under Section 4.4. South <strong>Africa</strong>n<br />
groundnut is prom<strong>in</strong>ent on the European market, and has recently ga<strong>in</strong>ed a<br />
reasonable foothold on the US market as well.<br />
However, overall quality of South <strong>Africa</strong>n groundnut has slipped a bit <strong>in</strong><br />
recent years, as the uni<strong>for</strong>mity of varieties present <strong>in</strong> any given lot is not as<br />
assured as it was previously. This decl<strong>in</strong>e <strong>in</strong> consistency is blamed on the<br />
recent <strong>in</strong>troduction of mach<strong>in</strong>e grad<strong>in</strong>g technologies, as opposed to the <strong>for</strong>mer<br />
reliance on hand-picked and selected (HPS) lots.<br />
The production and market<strong>in</strong>g of South <strong>Africa</strong>n groundnuts is facilitated<br />
by a well-organized network compris<strong>in</strong>g producer cooperatives, trade<br />
associations and other private sector stakeholders, <strong>in</strong>clud<strong>in</strong>g <strong>Groundnut</strong><br />
International and Safr<strong>in</strong>ut. The quality of the South <strong>Africa</strong>n groundnut crop is<br />
certified by the Perishable Products Export Control Board (PPECB), a<br />
parastatal body with great <strong>in</strong>ternational credibility with<strong>in</strong> the groundnut<br />
sector.<br />
Aflatox<strong>in</strong> can be a problem, however, particularly <strong>in</strong> the drier production<br />
areas. The South <strong>Africa</strong>n groundnut crop has been devastated by aflatox<strong>in</strong><br />
contam<strong>in</strong>ation twice <strong>in</strong> recent years – <strong>in</strong> 1999 and aga<strong>in</strong> <strong>in</strong> 2002. In spite of<br />
this, South <strong>Africa</strong> is still considered a reliable supplier of groundnut on the<br />
<strong>in</strong>ternational market, largely due to the reliability of the pre-shipment<br />
<strong>in</strong>spection services of the PPECB, to the quality control activities of its<br />
(European-certified) shell<strong>in</strong>g plants, and to the active and reliable monitor<strong>in</strong>g<br />
of crop conditions by commercial bodies such as Safr<strong>in</strong>ut and <strong>Groundnut</strong><br />
International.<br />
Accord<strong>in</strong>g to Dutch importers, over half of the 2002 South <strong>Africa</strong>n<br />
groundnut crop has been estimated to be contam<strong>in</strong>ated with aflatox<strong>in</strong> above<br />
EU standards.<br />
22
3.8 Other <strong>Africa</strong>n orig<strong>in</strong>s<br />
Other <strong>Africa</strong>n countries that export groundnut – most notably Gambia,<br />
Senegal, Sudan and Zimbabwe – are generally considered highly aflatox<strong>in</strong>prone<br />
countries of orig<strong>in</strong>. In most cases the European importers will not trust<br />
pre-shipment <strong>in</strong>spection from these countries, even by national affiliates of<br />
<strong>in</strong>ternational firms such as Société Générale de Surveillance (SGS). This<br />
negative bias is entirely supported by current EU regulations, and re<strong>in</strong><strong>for</strong>ced<br />
by the conclusions of a 2001 expert panel analysis of EU aflatox<strong>in</strong> regulations.<br />
Limited quantities of Gambian and Gu<strong>in</strong>ean groundnut have recently<br />
ga<strong>in</strong>ed access to the US market under the <strong>Africa</strong> Growth and Opportunities<br />
Act (see Appendix 4, US groundnut imports under AGOA, 2002).<br />
23
4.1 Introduction<br />
24<br />
4.0 World market trends and<br />
quality requirements<br />
As noted above, the lion’s share of the groundnut export market is taken by<br />
just a few countries. <strong>Groundnut</strong> import patterns, on the other hand, are<br />
considerably more fragmented. Nonetheless, only a few large markets offer<br />
much promise <strong>for</strong> groundnut of <strong>West</strong> <strong>Africa</strong>n orig<strong>in</strong>. Chief among them is the<br />
European market, although recent quality standards have greatly impeded<br />
access to this market <strong>for</strong> groundnut of all orig<strong>in</strong>s.<br />
The chart (Figure 2) below <strong>in</strong>dicates price trends <strong>for</strong> the most common<br />
size of shelled edible groundnut, 40 to 50 count per ounce (“40/50s”), from<br />
the three major countries of orig<strong>in</strong>, on the Rotterdam market.<br />
Figure 2. Price trends on the Rotterdam market <strong>for</strong> shelled groundnut, size<br />
40/50, Standard Edible Grade.<br />
Source: Revoredo and Fletcher 2002.<br />
As noted by Revoredo and Fletcher, the two major spikes represent<br />
scarcity of groundnut from the US crop, which <strong>in</strong> the second case had clear<br />
<strong>in</strong>ternational repercussions. A price premium <strong>for</strong> US groundnut is clearly<br />
<strong>in</strong>dicated – $50 above that of Argent<strong>in</strong>e orig<strong>in</strong>, and $53 above that of Ch<strong>in</strong>ese<br />
orig<strong>in</strong>.
The characteristics of the major <strong>in</strong>ternational groundnut markets as<br />
export dest<strong>in</strong>ations will be discussed below.<br />
4.2 Europe<br />
The European groundnut market is centered on two trad<strong>in</strong>g hubs, ie,<br />
Rotterdam and London. While Rotterdam is the center of the edible<br />
groundnut trade, and France the center of the European groundnut oil market<br />
(of particular reference to Senegal), the UK market <strong>in</strong>cludes buyers of<br />
groundnuts <strong>for</strong> the <strong>for</strong>mulation of animal feed and birdfood, both of which<br />
have significantly lower quality requirements than those <strong>for</strong> edible groundnut.<br />
In general European demand <strong>for</strong> groundnut has been <strong>in</strong>creas<strong>in</strong>g <strong>in</strong> recent<br />
decades, shift<strong>in</strong>g from an oilseed-dom<strong>in</strong>ated market toward <strong>in</strong>creased<br />
demand <strong>for</strong> edible groundnut, about 80% of which is roasted <strong>for</strong> further<br />
process<strong>in</strong>g <strong>in</strong>to snack foods or peanut butter. While peanut butter accounts<br />
<strong>for</strong> as much as about 35% of total groundnut consumption the cont<strong>in</strong>ental<br />
markets, the figure is closer to 5% <strong>for</strong> the UK market (Kettlewell 2003).<br />
The decl<strong>in</strong>e of the groundnut oil market due to competition from<br />
sunflower, soya and rapeseed has brought the European demand <strong>for</strong> oilseed<br />
groundnut down from about 500,000 MT per year <strong>in</strong> 1983 to about 200,000<br />
MT today (Kettlewell 2003). The ma<strong>in</strong> European processors and ref<strong>in</strong>ers of<br />
groundnut oil are Cereol (France), Romi (Netherlands), Anglia (UK) and<br />
Karlshamns (Sweden and UK).<br />
In general, the European groundnut market has become less diversified<br />
and more concentrated over the past decade. It is said that until the late1990s,<br />
a range of large and small orig<strong>in</strong> shellers/suppliers provided products to large<br />
and small dealers to serve large and small consumers – from end-use<br />
manufactur<strong>in</strong>g <strong>in</strong>dustries to supermarkets. In recent years, the pattern has<br />
shifted toward large orig<strong>in</strong> shellers/suppliers provid<strong>in</strong>g products to a few small<br />
dealers serv<strong>in</strong>g a few large consumers, with an <strong>in</strong>creas<strong>in</strong>g market share taken<br />
up by supermarket cha<strong>in</strong>s.<br />
There is a correspond<strong>in</strong>g overall trend toward mergers between the<br />
larger import<strong>in</strong>g houses, result<strong>in</strong>g <strong>in</strong> the absorption or disappearance of the<br />
smaller trad<strong>in</strong>g companies (which <strong>for</strong>merly traded large volumes), <strong>in</strong> favor of<br />
fewer, larger trad<strong>in</strong>g companies, which tend to trade <strong>in</strong> (paradoxically) smaller<br />
volumes, due <strong>in</strong> part to quality problems of supply. The merger between<br />
Cargill and the Golden Peanut Company <strong>in</strong> March 2000 is seen as evidence<br />
25
that <strong>in</strong> the new market environment, even the larger suppliers are not immune<br />
from the problems affect<strong>in</strong>g smaller players.<br />
With their dim<strong>in</strong>ished presence <strong>in</strong> the market, the f<strong>in</strong>anc<strong>in</strong>g <strong>for</strong>merly<br />
provided by the trad<strong>in</strong>g houses has largely dried up, to the detriment of<br />
smaller suppliers and, ultimately, end-users, who must chase dim<strong>in</strong>ished<br />
stocks of reliable quality product.<br />
Where the larger dealers <strong>for</strong>merly held great quantities of stock <strong>in</strong><br />
Europe, result<strong>in</strong>g <strong>in</strong> a more reliable and predictable market supply, stocks are<br />
now held <strong>in</strong>creas<strong>in</strong>gly by the orig<strong>in</strong> suppliers – who must bear the <strong>in</strong>herent<br />
costs (and risks) of hold<strong>in</strong>g such stock. As the risk and transaction costs have<br />
<strong>in</strong>creased, the overall liquidity of the market has dim<strong>in</strong>ished, and return on<br />
<strong>in</strong>vestment has decl<strong>in</strong>ed.<br />
In addition to these constrict<strong>in</strong>g factors, <strong>in</strong>creased access to<br />
communications technologies <strong>in</strong> recent years, <strong>in</strong>clud<strong>in</strong>g Internet-based<br />
sources of market <strong>in</strong><strong>for</strong>mation and electronic commerce, also serve to ‘shr<strong>in</strong>k’<br />
the supply cha<strong>in</strong> <strong>in</strong> ways that may ultimately <strong>in</strong>crease the competition faced<br />
by smaller suppliers, even as these technologies af<strong>for</strong>d <strong>in</strong>creased access to<br />
distant markets.<br />
The logical conclusion of these comb<strong>in</strong>ed trends is an <strong>in</strong>creas<strong>in</strong>gly direct<br />
<strong>in</strong>teraction between suppliers (eg, shellers and exporters of groundnut) and<br />
the end-users (eg, manufacturers and, <strong>in</strong>creas<strong>in</strong>gly, supermarket cha<strong>in</strong>s). The<br />
implications of these emerg<strong>in</strong>g market trends will <strong>in</strong>clude <strong>in</strong>creased<br />
competition among suppliers, <strong>in</strong> terms of both product quality and price.<br />
As it stands, smaller suppliers, larger traders and small end-users are all<br />
‘feel<strong>in</strong>g the p<strong>in</strong>ch’. This is evidenced by the disappearance <strong>in</strong> recent years of<br />
both the smaller suppliers and the larger trad<strong>in</strong>g and brokerage houses, the<br />
absorption of small end-use manufacturers <strong>in</strong>to large companies. There is also<br />
the emergence of an <strong>in</strong>creas<strong>in</strong>gly merciless market <strong>in</strong> terms of quality, <strong>in</strong><br />
which orig<strong>in</strong>s perceived as ‘unreliable’ – such as India – are <strong>for</strong> all practical<br />
purposes consigned to oblivion.<br />
In addition to these recent trends, the European (and world) groundnut<br />
markets were drastically affected by the adoption of European Commission<br />
Regulation EC No. 1525/9 on 16 July 1998 (amend<strong>in</strong>g Commission<br />
Regulation No. 194/97 of 31 January 1997), which set maximum levels <strong>for</strong><br />
aflatox<strong>in</strong> <strong>in</strong> certa<strong>in</strong> foodstuffs. A separate Commission Directive (98/53/CE)<br />
was adopted the same day to harmonize methods of sampl<strong>in</strong>g and analysis<br />
<strong>for</strong> aflatox<strong>in</strong> levels <strong>in</strong> foodstuffs. Both regulations were effective as from<br />
26
1 January 1999 (official journal of the European Communities, 17 July 1998,<br />
L 201/93 and L 201/101).<br />
European Commission Regulation EC No. 1525/9 set maximum<br />
permitted levels of aflatox<strong>in</strong> B 1 at 2μg/kg (or parts per billion, ppb), and the<br />
limits <strong>for</strong> total aflatox<strong>in</strong>s (B 1 + B 2 + G 1 + G 2 ) at 4 ppb <strong>in</strong> groundnuts<br />
<strong>in</strong>tended <strong>for</strong> direct human consumption or as an <strong>in</strong>gredient <strong>in</strong> foodstuffs. The<br />
limits <strong>for</strong> groundnuts to be subjected to further process<strong>in</strong>g by sort<strong>in</strong>g or some<br />
other physical treatment prior to human consumption were set at 8 ppb <strong>for</strong><br />
aflatox<strong>in</strong> B 1, and 15 ppb <strong>for</strong> total aflatox<strong>in</strong>s (B 1 + B 2 + G 1 + G 2 ).<br />
In general, the new EU aflatox<strong>in</strong> standards are seen as hav<strong>in</strong>g greatly<br />
<strong>in</strong>creased the risk <strong>in</strong>herent <strong>in</strong> an already “hazardous” <strong>in</strong>dustry – risk, which is<br />
not well borne given the additional pressure it puts on a market of <strong>in</strong>herently<br />
low profitability.<br />
Price implications have followed accord<strong>in</strong>gly, only add<strong>in</strong>g to the risk<br />
borne by the various market stakeholders. S<strong>in</strong>ce the EU code was established,<br />
it has become clear that the quality of a given crop has become much more<br />
important than its total size <strong>in</strong> determ<strong>in</strong><strong>in</strong>g prices, caus<strong>in</strong>g great difficulty <strong>in</strong><br />
the prediction and <strong>for</strong>ecast<strong>in</strong>g of market trends based on crop development, as<br />
was the case <strong>in</strong> the past. S<strong>in</strong>ce <strong>in</strong> some cases reliable test<strong>in</strong>g is only per<strong>for</strong>med<br />
with the arrival of a given shipment <strong>in</strong> port, potential price distortions may<br />
create havoc along the supply cha<strong>in</strong>, as prices calculated well <strong>in</strong> advance might<br />
prove <strong>in</strong>sufficient to guarantee specified quality <strong>in</strong> required volume.<br />
As a partial result, European end-users are primarily and <strong>in</strong>creas<strong>in</strong>gly<br />
<strong>in</strong>terested <strong>in</strong> m<strong>in</strong>imiz<strong>in</strong>g their risk by obta<strong>in</strong><strong>in</strong>g ‘aflatox<strong>in</strong>-free’ (or ‘aflanegative’)<br />
groundnut. Importers have come to share this concern, po<strong>in</strong>t<strong>in</strong>g out<br />
that where any aflatox<strong>in</strong> exists, one cannot be confident that any method of<br />
analysis will adequately safeguard the buyer.<br />
Despite Commission Directive (98/53/CE), the practical difficulties of<br />
adequate and representative sampl<strong>in</strong>g, and the variability and <strong>in</strong>consistency of<br />
analytical methods – particularly by pre-shipment <strong>in</strong>spectors – only add to<br />
these quality-related <strong>in</strong>securities.<br />
One major importer provided a graphic example, of a hypothetical case<br />
<strong>in</strong> which 20% of the lots of a given shipment are found to be contam<strong>in</strong>ated<br />
above EU regulations – say 20 conta<strong>in</strong>ers out of a total shipment of 100.<br />
Follow<strong>in</strong>g this <strong>in</strong>itial analysis, if the rema<strong>in</strong><strong>in</strong>g 80 conta<strong>in</strong>ers of ‘approved’<br />
groundnuts are analyzed a second time, it is most likely that 20% of these will<br />
be found to be contam<strong>in</strong>ated with aflatox<strong>in</strong> above EU regulations – and so on.<br />
27
Aflatox<strong>in</strong>-free stock carries a price premium of up to $50 per ton, which<br />
is acceptable to purchasers, given the risks <strong>in</strong>volved <strong>in</strong> accept<strong>in</strong>g groundnut<br />
with any titre of aflatox<strong>in</strong>.<br />
Given the priority of aflatox<strong>in</strong>-free product <strong>for</strong> European importers and<br />
end-users, the purchase of any groundnut <strong>in</strong>volves a certa<strong>in</strong> quality risk,<br />
regardless of pre-shipment <strong>in</strong>spection and the result<strong>in</strong>g documentation of<br />
analysis. As one buyer pithily put it, “This is not a paper bus<strong>in</strong>ess – this is a<br />
product bus<strong>in</strong>ess!”<br />
While <strong>in</strong>ternational pre-shipment <strong>in</strong>spectors <strong>in</strong> one country may be<br />
considered ‘reliable’ due to their particular track record, <strong>in</strong>spectors affiliated<br />
to the same company <strong>in</strong> another country may not be trusted by the importer.<br />
Like any other <strong>in</strong>ternational franchise, quality and reliability of pre-shipment<br />
<strong>in</strong>spection services can and does vary considerably by country, with<br />
implications of untenable risk <strong>for</strong> importers consider<strong>in</strong>g new, unproven orig<strong>in</strong>s<br />
– much less those that may have proven unreliable <strong>in</strong> the past.<br />
One of the few options available to smaller or unproven suppliers is to<br />
build and cultivate long-term relationships with a few importers, and work<br />
through the difficult <strong>in</strong>itial period of build<strong>in</strong>g trust, reputation and a ‘track<br />
record’ of proven per<strong>for</strong>mance, <strong>in</strong> terms of product quality and its consistency,<br />
as well as reliability of supply.<br />
At present, only three countries – the USA, Argent<strong>in</strong>a and Ch<strong>in</strong>a – are<br />
considered to be consistently reliable suppliers to European importers. Other<br />
countries of orig<strong>in</strong> are try<strong>in</strong>g to ga<strong>in</strong> entry to the European market, however –<br />
notably Sudan, Brazil, Paraguay, Nicaragua, Israel and Australia.<br />
4.3 The United States of America<br />
Though the quality standards of the US import market <strong>for</strong> groundnut are<br />
considerably less str<strong>in</strong>gent than EU specifications – allow<strong>in</strong>g <strong>for</strong> total aflatox<strong>in</strong><br />
levels of 15 ppb <strong>in</strong> edible groundnut, consistent with the Codex Alimentarius<br />
regulations – entry <strong>in</strong>to the US market has <strong>for</strong> many years been blocked by a<br />
complex barrier of price supports, import quotas and other protectionist<br />
legislation.<br />
Recent years have seen considerable erosion of these trade barriers, but it<br />
rema<strong>in</strong>s to be seen how promis<strong>in</strong>g the US market may prove <strong>for</strong> groundnut of<br />
<strong>West</strong> <strong>Africa</strong>n orig<strong>in</strong>. The ‘allowability’ of groundnut imports as commodities<br />
28
to receive special duty-free status as imports from selected <strong>Africa</strong>n countries<br />
(<strong>in</strong>clud<strong>in</strong>g the four of concern here) under the current <strong>Africa</strong> Growth and<br />
Opportunities Act (AGOA) is not very clear.<br />
Several published sources <strong>in</strong>dicate (and lament) that both raw<br />
groundnuts and peanut butter are excluded as duty-free imports under<br />
AGOA. However, the US Trade Commission 2003 Tariff Database <strong>in</strong>dicates<br />
that a number of commodity classes (under the US Harmonized Tariff<br />
Schedule) of both <strong>in</strong>-shell and shelled groundnut – raw, blanched or otherwise<br />
treated – are <strong>in</strong>deed eligible <strong>for</strong> duty-free import under AGOA, as is crude<br />
and ref<strong>in</strong>ed groundnut oil (though peanut butter is specifically excluded).<br />
However, accord<strong>in</strong>g to US Trade Commission statistics, very few <strong>Africa</strong>n<br />
countries have yet taken advantage of the apparent duty-free status <strong>for</strong><br />
groundnut granted under AGOA – <strong>in</strong>clud<strong>in</strong>g South <strong>Africa</strong>, Gambia and<br />
Gu<strong>in</strong>ea – and the volume of groundnut imported from these countries s<strong>in</strong>ce<br />
AGOA began <strong>in</strong> 2000 rema<strong>in</strong>s quite negligible. South <strong>Africa</strong> has also exported<br />
a modest volume of peanut butter to the US s<strong>in</strong>ce 2000, though this is<br />
excluded <strong>for</strong> duty-free importation to the US under AGOA.<br />
From these recent statistics, prospects <strong>for</strong> <strong>West</strong> <strong>Africa</strong>n groundnut<br />
exports to the US under AGOA does not seem particularly promis<strong>in</strong>g per se,<br />
but further enquiry will be conducted, and clarification sought, directly from<br />
US AGOA trade officials <strong>in</strong> the course of the rema<strong>in</strong>der of this study.<br />
A brief history of regulation<br />
As noted above, the history of US government <strong>in</strong>tervention <strong>in</strong> the groundnut<br />
sector dates back to the Agricultural Adjustment Acts of 1933 and 1938,<br />
Section 22 of which put <strong>in</strong> place what was to become the Peanut Program of<br />
the USDA. <strong>Groundnut</strong> imports were <strong>in</strong>itially one of a number of basic<br />
commodities to be proscribed by a set of restrictive quotas and tariffs, but<br />
those <strong>for</strong> groundnut have proven far more endur<strong>in</strong>g (and <strong>in</strong>volved) than those<br />
<strong>for</strong> any other commodity.<br />
In 1953, dur<strong>in</strong>g a decl<strong>in</strong>e <strong>in</strong> commodity prices l<strong>in</strong>ked to the US-Korean<br />
War, additional trade restrictions on groundnut were <strong>in</strong>itiated under Section<br />
22 of the 1933 Act, but were contested under the General Agreement on<br />
Tariffs and Trade (GATT). From 1956, <strong>in</strong> response to the GATT action,<br />
import quotas <strong>for</strong> groundnut were determ<strong>in</strong>ed on an annual basis, and slowly<br />
grew <strong>in</strong> response to <strong>in</strong>creas<strong>in</strong>g domestic requirements, as well as successive<br />
<strong>in</strong>ternational trade agreements.<br />
29
With the 1996 US Freedom to Farm Act (Farm Act 1996), under the<br />
Uruguay Round Agreement of GATT (now the World Trade Organization, or<br />
WTO), Section 22 of the Agricultural Adjustment Act of 1933 was<br />
elim<strong>in</strong>ated, and groundnut import quotas were ultimately replaced with an ad<br />
valorem tariff fixed by import tariff rate quota (TRQ). The 1996 Farm Act is<br />
considered the first serious step <strong>in</strong> the deregulation of the US groundnut<br />
market (after a false start <strong>in</strong> 1981).<br />
The purpose of the USDA peanut program is primarily to protect the<br />
price of raw <strong>in</strong>-shell groundnut meant specifically <strong>for</strong> direct human<br />
consumption, and groundnut to be utilized <strong>for</strong> oil or meal or other uses,<br />
whereas the groundnut TRQ covers raw <strong>in</strong>-shell groundnut and also shelled<br />
groundnut, blanched and ‘others’. An exception to this is peanut butter, which<br />
is regulated by a separate and additional TRQ. The full, <strong>for</strong>mal specification of<br />
the US groundnut TRQ is put <strong>for</strong>ward <strong>in</strong> the US Harmonized Tariff Schedule<br />
of the United States (HTSUS), Chapter 12, Note 2(b).<br />
Considerable upward adjustments to US groundnut TRQs have been<br />
brought about under the North American Free Trade Agreement (NAFTA),<br />
and are likely to rise further under the Free Trade Area of the Americas<br />
(FTAA), which will af<strong>for</strong>d greater access to the US market <strong>for</strong> currently m<strong>in</strong>or<br />
(but upcom<strong>in</strong>g) countries of orig<strong>in</strong>, such as Nicaragua and Brazil. From the<br />
orig<strong>in</strong>al import quota of 775 MT set <strong>for</strong> 1933, by 1995 the quota (as TRQ)<br />
had risen to 33,871 MT, and upto 56,938 MT five years later.<br />
Under NAFTA, the US has granted preferential US market access to<br />
groundnuts and groundnut products of Canadian and Mexican orig<strong>in</strong>, result<strong>in</strong>g<br />
<strong>in</strong> a dramatic rise <strong>in</strong> US groundnut imports from these countries.<br />
Hav<strong>in</strong>g effectively replaced the import quota <strong>for</strong> groundnut, even the US<br />
tariff rate is steadily decreas<strong>in</strong>g. From <strong>in</strong>itial rates of 192.7% <strong>for</strong> <strong>in</strong>-shell<br />
groundnut and 155% <strong>for</strong> shelled groundnut <strong>in</strong> 1995, by 2000 the ad valorem<br />
tariff <strong>for</strong> US groundnut imports had been reduced to 163.8% <strong>for</strong> <strong>in</strong>-shell<br />
groundnut and 131.8% <strong>for</strong> shelled groundnut under WTO.<br />
Under NAFTA, however, the 2000 ad valorem tariff <strong>for</strong> shelled<br />
groundnut was 93%. Under NAFTA quotas, the import of Mexican peanuts<br />
grew by 1400% between 1993 and 2000, to a value of $1.8 million, while the<br />
import of Canadian peanuts grew by a more modest 10% to $289 million.<br />
From an <strong>in</strong>itial TRQ (1994) of 3,377 MT, groundnut of Mexican orig<strong>in</strong> will be<br />
allowed to enter the US market freely, <strong>in</strong> unlimited supply and free of tariff as<br />
of 2008. Already, Mexican peanut butter is permitted to enter the US market<br />
freely and without quota, tariff or any other restrictions.<br />
30
In addition, a bilateral trade agreement was reached between the US and<br />
Argent<strong>in</strong>a <strong>in</strong> 1994, allocat<strong>in</strong>g to Argent<strong>in</strong>a upto 78% of the US groundnut<br />
tariff-rate quota over the follow<strong>in</strong>g five years, from 26,341 MT <strong>in</strong> 1995 to<br />
43,901 MT <strong>in</strong> 2000. A similar tariff-rate quota allocation was given under the<br />
agreement <strong>for</strong> Argent<strong>in</strong>e peanut paste and peanut butter, with an <strong>in</strong>-quota<br />
amount of 3,650 MT dur<strong>in</strong>g 1995, with an <strong>in</strong>-quota tariff rate identical to, and<br />
fixed <strong>for</strong> reduction at the same level as that of Canada under NAFTA.<br />
Until recently, Argent<strong>in</strong>a, Mexico and Nicaragua accounted <strong>for</strong> over 90<br />
percent of US groundnut imports (USDA/FAS 2000), with Argent<strong>in</strong>a<br />
provid<strong>in</strong>g 75 percent. In 2000, however, Ch<strong>in</strong>a has recently surpassed<br />
Nicaragua to provide the third largest share of US groundnut imports, with a<br />
trade volume of 4,900 MT dur<strong>in</strong>g 2000.<br />
This volume is <strong>for</strong>eseen to <strong>in</strong>crease, as Ch<strong>in</strong>a – already a ‘Most Favored<br />
Nation’ (MFN) under US trade concessions – is expected to negotiate <strong>for</strong> a<br />
larger share of the US groundnut TRQ under bilateral trade agreements, and<br />
<strong>in</strong> future meet<strong>in</strong>gs of the WTO.<br />
Given the costs <strong>in</strong>volved <strong>in</strong> ‘rent’ to ma<strong>in</strong>ta<strong>in</strong> the US groundnut tariff<br />
quota, there is some recent speculation that the groundnut TRQs have<br />
outlived their usefulness, and that their elim<strong>in</strong>ation would only benefit<br />
domestic consumers and would have little impact on producers.<br />
4.4 South <strong>Africa</strong><br />
While not specifically mentioned <strong>in</strong> the terms of reference <strong>for</strong> this<br />
assignment, the South <strong>Africa</strong>n groundnut market is highly significant <strong>in</strong><br />
<strong>in</strong>ternational terms, and it may prove useful to consider recent developments<br />
<strong>in</strong> the task of build<strong>in</strong>g an <strong>in</strong>creased presence <strong>for</strong> <strong>West</strong> <strong>Africa</strong>n groundnut<br />
producers <strong>in</strong> <strong>in</strong>ternational trade.<br />
In addition to its productivity and reliability as a source of high-quality<br />
groundnut to serve <strong>in</strong>ternational markets, domestic demand <strong>for</strong> groundnut <strong>in</strong><br />
South <strong>Africa</strong> rides consistently higher than supply. Because groundnut quality<br />
standards <strong>for</strong> the domestic market are considerably less str<strong>in</strong>gent than those<br />
govern<strong>in</strong>g the export market (particularly to Europe), domestic demand<br />
serves as a market buffer, absorb<strong>in</strong>g stocks that are affected by lower levels of<br />
aflatox<strong>in</strong>.<br />
Even dur<strong>in</strong>g a normal year, groundnut is required to serve domestic<br />
market demand, and is imported from southern <strong>Africa</strong>n countries (notably<br />
Zimbabwe and Malawi), and even from further afield. One European<br />
31
importer speculated that Senegalese groundnut has probably entered the<br />
South <strong>Africa</strong>n market.<br />
In a year of serious aflatox<strong>in</strong> contam<strong>in</strong>ation such as this, groundnut may<br />
be even imported from the United States or Argent<strong>in</strong>a. This year, Dr Juan<br />
Estrada of ICRISAT-Malawi reports purchase offers of up to $750 per MT,<br />
FoT Lilongwe <strong>for</strong> ungraded farmer stock – a previously unheard-of price level<br />
<strong>for</strong> Malawian producers.<br />
4.5 Asian countries<br />
The ma<strong>in</strong> buyers of groundnut <strong>in</strong> Asia <strong>in</strong>clude Indonesia, the Philipp<strong>in</strong>es,<br />
Malaysia and Japan. Normally these countries buy the bulk of their product<br />
from Ch<strong>in</strong>a, but as of last year – with Ch<strong>in</strong>ese groundnut sold at relatively high<br />
prices – Asian buyers sought alternatives from Indian, South <strong>Africa</strong>n and<br />
Vietnamese orig<strong>in</strong>s.<br />
32
5.0 <strong>West</strong> <strong>Africa</strong>: <strong>Market</strong> profiles of Senegal,<br />
Mali, Niger and Nigeria<br />
5.1 Introduction<br />
This section will provide a summary of groundnut market patterns <strong>in</strong> the four<br />
focus countries, <strong>in</strong> a sub-regional context.<br />
As described <strong>in</strong> the Background and methodology section, a variety of<br />
<strong>in</strong>vestigative methods, contact persons and documentary resources, <strong>in</strong>clud<strong>in</strong>g<br />
published and unpublished reports, were used as a basis upon which the<br />
follow<strong>in</strong>g country profiles were developed.<br />
The follow<strong>in</strong>g is a brief account of the four focus countries us<strong>in</strong>g available<br />
data. S<strong>in</strong>ce it was not possible to access precisely the same data <strong>for</strong> each<br />
country, and given that some of the official data appears contradictory <strong>in</strong><br />
places, this should not be read as a strict comparison of the four national<br />
groundnut sectors based on identical criteria, but rather as a general account<br />
us<strong>in</strong>g all <strong>in</strong><strong>for</strong>mation available.<br />
While the country profiles provide an accurate summary of each of the<br />
four project countries, the regional picture is more difficult to ascerta<strong>in</strong>.<br />
Although fragments of the whole have been gleaned dur<strong>in</strong>g each country<br />
study, specific data on actual volumes traded rema<strong>in</strong>s patchy and<br />
contradictory; <strong>in</strong> some cases the official figures run directly aga<strong>in</strong>st the most<br />
elementary economic logic.<br />
Nonetheless, the significance of regional trade <strong>in</strong> groundnut products <strong>for</strong><br />
each of the countries studied cannot be missed, and regional trade patterns<br />
between the four producer countries are clear.<br />
Price cycle comparisons<br />
Comparison of groundnut prices between the four producer countries is<br />
facilitated by the fact that three of the four share a common currency, the<br />
Franc CFA (fCFA). In the case of Nigeria, data has been presented <strong>in</strong> both<br />
Nigerian Naira and <strong>in</strong> fCFA <strong>for</strong> comparison. It should be noted that dur<strong>in</strong>g the<br />
period studied (January 2002 to December 2003) the Naira lost over 41% of<br />
its value to the CFA. However, the implications of a highly fluid official<br />
exchange rate between Naira and CFA cannot be fully addressed here;<br />
however, the runn<strong>in</strong>g monthly exchange rate has been <strong>in</strong>cluded <strong>for</strong> illustrative<br />
reference.<br />
33
A secondary (though perhaps more significant) obstacle to comparison of<br />
the annual price cycles between markets lies <strong>in</strong> the lack of reliable figures<br />
<strong>in</strong>dicative of volumes traded at each particular price. That is, if one month (at<br />
price ‘a’) accounts <strong>for</strong> a large preponderance of groundnut sales, and another<br />
month (at price ‘k’) a t<strong>in</strong>y fraction, it would be <strong>in</strong>accurate and mislead<strong>in</strong>g to<br />
accord both prices the same weight by averag<strong>in</strong>g them together (along with<br />
the other prices/months) <strong>for</strong> which data was available <strong>for</strong> that particular<br />
market. In view of this uncerta<strong>in</strong>ty, annual price averages are denoted as<br />
‘averages,’ and are <strong>in</strong>cluded <strong>for</strong> “rough and dirty” comparison of the markets<br />
studied.<br />
F<strong>in</strong>ally, the reliability of the price data is not entirely assured. The<br />
absence of figures <strong>for</strong> a particular month (as denoted by the ‘–’) may <strong>in</strong>dicate<br />
a lack of documentation, and not necessarily a lack of product actually on offer<br />
at the time. Some data here seems contradictory, as well; on several markets<br />
the price of a particular product drops <strong>in</strong> the month be<strong>for</strong>e it (apparently)<br />
disappears, contrary to the simple notion that scarcity drives price. However,<br />
given the fact that product quality decl<strong>in</strong>es over time, it is possible that this<br />
lower price represents the ‘dregs’ of the harvest, hence the lower price, as all<br />
of the ‘quality’ groundnut had been sold first.<br />
Nonetheless, the differences between price cycles does appear<br />
pronounced enough to provide an <strong>in</strong>dication of the pattern of remuneration,<br />
with prices tend<strong>in</strong>g to be higher with proximity to demand, particularly the<br />
process<strong>in</strong>g <strong>in</strong>dustries which purchase groundnut, or national borders en route<br />
to regional centers of demand.<br />
5.2 Senegal<br />
Production<br />
<strong>Groundnut</strong> production <strong>in</strong> this country is historic <strong>in</strong> every sense, and Senegal<br />
was the entry po<strong>in</strong>t from which the crop <strong>in</strong>troduced to <strong>West</strong> <strong>Africa</strong> nearly two<br />
hundred years ago. As of 1998, an estimated one million people (a tenth of the<br />
population) were <strong>in</strong>volved <strong>in</strong> groundnut production and process<strong>in</strong>g<br />
(Akobundu 1998). In recent years, however, cultivation patterns <strong>in</strong> the<br />
Senegalese ‘<strong>Groundnut</strong> Bas<strong>in</strong>’ have shifted away from groundnut, toward<br />
maize and other food crops, as well as cotton (Afrol March 2002).<br />
<strong>Groundnut</strong> production has historically been very largely devoted to the<br />
oilseed sub-sector (a recent CIRAD estimate puts it to a factor of 95%). On<br />
34
the world market, Senegal and Argent<strong>in</strong>a are the two ma<strong>in</strong> exporters of<br />
groundnut oil, ma<strong>in</strong>ly to Europe, the US and Ch<strong>in</strong>a. Of the four project<br />
countries, Senegal has led <strong>in</strong> groundnut exports, particularly to Europe –<br />
though with the adoption of the current EU aflatox<strong>in</strong> regulations, these<br />
exports have been drastically reduced.<br />
The French applied research organization CIRAD has <strong>in</strong>vested <strong>in</strong><br />
development of the edible or confectionary groundnut sub-sector (ARB)<br />
based on improved varieties and irrigated cultivation. CIRAD and the Institut<br />
de Technologie Alimentaire (ITA) are undertak<strong>in</strong>g to establish a quality<br />
control and quality certification system, and thus revive the Senegalese ‘brand’<br />
through an <strong>in</strong>ternationally-recognized quality label (Dimanche and Kane<br />
2002). However, the limit<strong>in</strong>g technical factor <strong>in</strong> develop<strong>in</strong>g an export market<br />
<strong>for</strong> edible groundnut rema<strong>in</strong>s the need <strong>for</strong> uptake by producers of improved<br />
production and postharvest techniques <strong>in</strong> order to address the threat of<br />
Aspergillus <strong>for</strong> product quality control.<br />
Dur<strong>in</strong>g the 2003 groundnut harvest, huge heaps of whole groundnut<br />
plants dry<strong>in</strong>g <strong>in</strong> the sun were observed ly<strong>in</strong>g <strong>in</strong> the middle of open fields across<br />
the ‘<strong>Groundnut</strong> Bas<strong>in</strong>’ as they have been dur<strong>in</strong>g harvest <strong>for</strong> many decades,<br />
open to the elements and susceptible to <strong>in</strong>fection by Aspergillus with any<br />
unseasonable ra<strong>in</strong>fall – as <strong>in</strong>deed was the case <strong>in</strong> 2003.<br />
<strong>Groundnut</strong> production dur<strong>in</strong>g the 2003 harvest has been relatively poor<br />
(4,800,000 MT was orig<strong>in</strong>ally expected, and less than 4,650,000 MT was<br />
realized) result<strong>in</strong>g <strong>in</strong> an enthusiastic commercial response by Indian producers<br />
to seize an opportunity to rejo<strong>in</strong> the <strong>in</strong>ternational market <strong>in</strong> groundnut oil with<br />
anticipated export of 50,000 MT this year, after a 40-year <strong>in</strong>terregnum (Times<br />
of India 2004).<br />
<strong>Groundnut</strong> sector survey<br />
A total of 228 households were studied, of which 216 produced groundnut.<br />
Production patterns with<strong>in</strong> this sample were strongly biased toward oilseed or<br />
arachide huilerie (97% of the producers). Only 21% of the producers studied<br />
produced the more profitable edible variety (ARB), and only 4% produced<br />
seed, of which none was the N1 seed required by a commercial seed<br />
multiplication program.<br />
Over 78% of respondents felt that they did not have sufficient access to<br />
groundnut seed. 89% of respondents relied on their own (‘ord<strong>in</strong>ary’) seed, only<br />
72% purchased any seed at all, and only 25% were us<strong>in</strong>g improved (N2) seed.<br />
35
In reflection of their higher value, over 90% of the ARB producers and all<br />
of the seed producers purchased seed, while only 60% of the oilseed growers<br />
<strong>in</strong>vested <strong>in</strong> seed to supplement their own.<br />
Production and market<strong>in</strong>g<br />
The groundnut trade <strong>in</strong> Senegal has been characterized by strong state<br />
<strong>in</strong>tervention and control, with annual prices fixed <strong>in</strong> advance and ‘panterritorially’<br />
(Gray 2002), ie, consistent across the country without relevance<br />
to proximity to the production areas or <strong>in</strong>dustry. The vast bulk of the harvest<br />
was sold to state-owned oil mills, which are still <strong>in</strong> operation.<br />
Unlike the other three countries, <strong>in</strong> which the groundnut sector was<br />
liberalized and privatized by the early 1990s, with subsidies and protective<br />
tariffs abolished, the Government of Senegal has persisted <strong>in</strong> an<br />
<strong>in</strong>terventionist approach to the groundnut sector. This has only come apart <strong>in</strong><br />
a series of abrupt (yet limited) steps s<strong>in</strong>ce 1997, <strong>in</strong>volv<strong>in</strong>g very direct and<br />
concerted pressure from the multilateral <strong>in</strong>stitutions, <strong>in</strong> particular the World<br />
Bank and EU.<br />
While a full account of the process of liberalization and privatization of<br />
the <strong>West</strong> <strong>Africa</strong>n groundnut sector lies beyond the scope of this study, Begh<strong>in</strong>,<br />
Diop, Matthey and Sewadeh 2003 propose a model <strong>for</strong> understand<strong>in</strong>g of the<br />
effects of protectionist tariffs, subsidies and other <strong>for</strong>ms of state <strong>in</strong>tervention<br />
and control of the groundnut sector. Look<strong>in</strong>g at <strong>Africa</strong>, they observe:<br />
36<br />
Taxation of groundnut farmers was high <strong>in</strong> the 1970s, but s<strong>in</strong>ce the<br />
early1990s when world prices decl<strong>in</strong>ed the situation has reversed <strong>in</strong><br />
most <strong>Africa</strong>n countries (Badiane and K<strong>in</strong>teh 1994). In Senegal and<br />
Gambia, the ma<strong>in</strong> rationale <strong>for</strong> state <strong>in</strong>tervention <strong>in</strong> the groundnut<br />
sector has been to safeguard the viability of state-owned process<strong>in</strong>g<br />
mills. Consequently, groundnut farmers’ share of the export price<br />
has been consistently lower than 60 percent <strong>in</strong> these two countries<br />
(Badiane and Gaye 1999). This policy has been counterproductive,<br />
s<strong>in</strong>ce it has led farmers to bypass large public process<strong>in</strong>g companies,<br />
lead<strong>in</strong>g to <strong>in</strong>creased excess capacities and f<strong>in</strong>ancial difficulties.<br />
Trade policies vary widely among <strong>Africa</strong>n traditional groundnut<br />
exporters.<br />
Senegal and Malawi apply tariffs to processed groundnuts and<br />
oil to encourage <strong>in</strong>-country process<strong>in</strong>g of groundnuts (oil<br />
production <strong>in</strong> the case of Senegal). In contrast, Gambia and Nigeria
have a liberal trade policy with no border <strong>in</strong>tervention. South<br />
<strong>Africa</strong>’s tariff structure exhibits a slight escalation; processed<br />
groundnuts are subject to a tariff of 6% while unprocessed<br />
groundnuts enter duty free. State trad<strong>in</strong>g occurs <strong>in</strong> several<br />
countries, allow<strong>in</strong>g en<strong>for</strong>cement of duties on oil imports (eg,<br />
Senegal).<br />
Appendix 3, Current trade and domestic policies on groundnut (2003),<br />
shows the various tariff rates applied by <strong>Africa</strong>n countries on processed<br />
products (from Begh<strong>in</strong>, Diop, Matthey and Sewadeh 2003).<br />
Under pressure from the World Bank and the EU, the Government of<br />
Senegal has <strong>in</strong> recent years begun to liberalize the groundnut sector, <strong>in</strong>clud<strong>in</strong>g<br />
the dissolution of the <strong>for</strong>mer state monopoly on produce market<strong>in</strong>g, and the<br />
currently-anticipated privatization of the oil mills still operated by the state<br />
corporation SONACOS.<br />
However, the process has not met with uni<strong>for</strong>m success; producers were<br />
<strong>in</strong>itially slow to embrace the ‘free market,’ and have spread their risk by<br />
mov<strong>in</strong>g cautiously toward open market sales, while ma<strong>in</strong>ta<strong>in</strong><strong>in</strong>g a strong<br />
tendency to sell through parastatal organs at the <strong>for</strong>merly mandated (fixed)<br />
price. This conservative commercial tendency on the part of the producer has<br />
been expla<strong>in</strong>ed as a strategy of m<strong>in</strong>imiz<strong>in</strong>g risk, s<strong>in</strong>ce producers endure a very<br />
precarious existence – compounded by erratic ra<strong>in</strong>fall, environmental<br />
degradation and population pressures on the land – which does not <strong>in</strong> strict<br />
economic terms pay <strong>for</strong> itself (Gray 2002).<br />
In November of 2001, Sonagra<strong>in</strong>es, the parastatal organiz<strong>in</strong>g most of the<br />
collection and transportation of the Senegalese groundnut through the official<br />
market, was <strong>for</strong>ced to abruptly dissolve <strong>in</strong> response to World Bank and EU<br />
pressure, <strong>in</strong> order to allow <strong>for</strong> the development of private alternatives which<br />
were, however, slow to develop. Farmers were reportedly confused as to how<br />
to market their products and there were reports of private transport operators<br />
tak<strong>in</strong>g rough advantage of the situation by buy<strong>in</strong>g up groundnut stocks at<br />
steeply discounted prices (Afrol April 2002).<br />
Though the oil mills themselves still belong to SONACOS at the time of<br />
writ<strong>in</strong>g, the sale of SONACOS has been imm<strong>in</strong>ent <strong>for</strong> the past year, and the<br />
critical question rema<strong>in</strong>s whether it will be sold as a unit (as the Government<br />
of Senegal seems to prefer) or broken up (as the World Bank is said to favor).<br />
Meanwhile, the market has not stood still <strong>for</strong> SONACOS, which set up<br />
600 receipt and collection market<strong>in</strong>g po<strong>in</strong>ts <strong>for</strong> the 2003 harvest production<br />
37
of 400,000 MT. As this figure is well below the capacity of the SONACOS oil<br />
mills, the entire amount is expected to be purchased by SONACOS this year.<br />
Product pric<strong>in</strong>g<br />
This section of the country profile will draw heavily on a recent PhD thesis<br />
(The <strong>Groundnut</strong> <strong>Market</strong> <strong>in</strong> Senegal: Exam<strong>in</strong>ation of Price and Policy Changes)<br />
by Dr James Katon Gray, which has already been cited twice above. The study<br />
upon which the thesis is based is beautifully suited to a (statistically valid)<br />
analysis of the Senegal groundnut sector as it stands today, and as such its<br />
tim<strong>in</strong>g was most favorable to the objectives of this study. Dr Gray also k<strong>in</strong>dly<br />
consented to communicate with the author <strong>in</strong> response to specific questions<br />
raised by the Senegal study (Gray 2004, personal communication).<br />
In his thesis Gray exam<strong>in</strong>es the recent (and current) micro-economic<br />
impacts on the producer – and thereby the production economy itself –<br />
result<strong>in</strong>g from the first steps toward ‘liberalization’ of the Senegal groundnut<br />
sector. He proposes that the abolition of the pan-territorial price system “will<br />
have an overall benefit to Senegalese society,” though producers distant from<br />
the oil mills would be faced with lower prices <strong>in</strong> reflection of transport costs.<br />
The official market<br />
Liberalization of the Senegal groundnut sector began <strong>in</strong> 1995, two years prior<br />
to the survey. As <strong>in</strong>dicated <strong>in</strong> Table 3, producers chose not to wander far from<br />
the previously-mandated state market<strong>in</strong>g channels.<br />
Table 3. <strong>Groundnut</strong> sales on the official circuit as a % of production <strong>in</strong> the first two<br />
trad<strong>in</strong>g years follow<strong>in</strong>g liberalization.<br />
Department 1995/96 1996/97<br />
Kaolack 77% 72%<br />
Fatick 70% 72%<br />
Foundiougne 84% 82%<br />
Gossas 63% 46%<br />
Nioro 65% 76%<br />
Kaffr<strong>in</strong>e 69% 50%<br />
Total average 72% 65%<br />
Source: Gaye, March 1998 <strong>in</strong> Gray 2002.<br />
Although about 25% of respondents chose to enter the open market with<br />
their produce, nearly 75% of the producer households cont<strong>in</strong>ued to sell on the<br />
38
official market. The oil mills were still owned by the parastatals – as they<br />
rema<strong>in</strong> today, if only just – and the purchas<strong>in</strong>g agents cont<strong>in</strong>ued to buy<br />
farmers’ production at the official price (1997) of fCFA 150 per kg.<br />
Prices and official market<strong>in</strong>g channels <strong>for</strong> the three types of groundnuts<br />
vary, with a heavy predom<strong>in</strong>ance of lower-value oilseed, as noted above. Some<br />
farmers <strong>in</strong>vest further <strong>in</strong> production of higher-value ARB, and some are<br />
contracted to multiply N1 seed to produce improved N2 seed, with the<br />
necessary <strong>in</strong>puts of fertilizer and fungicide.<br />
In the survey, over 77% of officially marketed production was oilseed,<br />
20% ARB, and less than 3% was seed. Of the 169 households that sold<br />
groundnut, 86% sold oilseed (average 2.3 MT per household); 35% sold ARB<br />
(average 1.5 MT per household) and 4% sold seed (average 1.5 MT).<br />
Product pric<strong>in</strong>g shows a dist<strong>in</strong>ct – though not strong – differentiation by<br />
product type, with little variation with<strong>in</strong> these price categories. While 97% of<br />
the 302 producers who sold oilseed obta<strong>in</strong>ed the official price of fCFA150 per<br />
kg, three sellers obta<strong>in</strong>ed less than the official price, with prices of 102, 109<br />
and 110 fCFA per kg respectively.<br />
Remuneration from ARB was not found to be as commensurate with the<br />
<strong>in</strong>vestment required as might be expected; nearly half of those who sold ARB<br />
received only the official market price of 150 fCFA per kg, and nearly a<br />
quarter more aga<strong>in</strong> received only 151; only 12% received 20% received more<br />
than 155, and only 6% received more than 160 fCFA per kg <strong>for</strong> their produce.<br />
The prices reflected m<strong>in</strong>imal returns on the extra <strong>in</strong>vestment of ARB<br />
production, even <strong>in</strong> terms of seed alone.<br />
The economics of ARB production <strong>in</strong> Senegal, and <strong>in</strong>terventions by<br />
CIRAD, have been studied <strong>in</strong> depth by Louis Boakye-Yiadom, 2003, <strong>in</strong> An<br />
Economic Surplus Evaluation of Aflatox<strong>in</strong>-Reduc<strong>in</strong>g Research: A Case Study of<br />
Senegal’s Confectionery <strong>Groundnut</strong> Sector.<br />
Table 4. Official groundnut sales prices <strong>in</strong> 2002.<br />
Mean SD n<br />
Arachide huilerie 149.7 4.4 75<br />
Arachide de bouche 151.7 4.6 302<br />
Arachide semence 157.5 4.5 12<br />
Source: Gray 2002.<br />
39
The open market<br />
Although nearly 25% of the respondent households sold some groundnut on<br />
the open (parallel) market, more than three quarters of these cont<strong>in</strong>ued to sell<br />
most of their production on the official market. While a total of 45 MT were<br />
sold by respondents on the open market, this represented only 35% of the<br />
total marketed (128 MT), and only 27% of total production.<br />
On the open market, 95% of the groundnut was sold <strong>in</strong>-shell (coque sèche<br />
or CS). <strong>Groundnut</strong> sold <strong>in</strong> all other <strong>for</strong>ms – shelled and treated (décortiquée et<br />
triée or D&T), green groundnuts (vert or VERTE), and as peanut butter (saxsax<br />
triturés or SST) – amounted to just over 2 MT, of a total 404 MT<br />
surveyed.<br />
Price differentials between these products reflect both the weight of the<br />
shell and value added <strong>in</strong> process<strong>in</strong>g. Prices <strong>for</strong> groundnut products on the open<br />
market were averaged 168 fCFA per kg <strong>for</strong> groundnut <strong>in</strong> shell (CS), 223<br />
fCFA/kg <strong>for</strong> shelled groundnut (D&T), 168 fCFA/kg <strong>for</strong> green groundnuts,<br />
and 350 fCFA/kg <strong>for</strong> peanut butter.<br />
5.3 Mali<br />
The follow<strong>in</strong>g section presents a summary of applied research on groundnut<br />
production and trade <strong>in</strong> Mali. The study was undertaken by the Institut d’<br />
Économie Rurale (Kondio 2003), with specific reference to case studies <strong>in</strong><br />
each of the three the ma<strong>in</strong> production zones: Kita <strong>in</strong> the southwest production<br />
area, which produces a third of the total crop, Kolokani (Bamako area) and<br />
San (southern production zone).<br />
<strong>Groundnut</strong> production <strong>in</strong> Mali began around 1840, and production rose<br />
steadily except <strong>for</strong> the period of the Second World War, when production<br />
slumped sharply <strong>for</strong> a few years. Though production grew rapidly dur<strong>in</strong>g the<br />
1960s, the volume traded through official channels began to decl<strong>in</strong>e. The<br />
Government of Mali responded <strong>in</strong> 1971 with Operation Arachidière<br />
(‘Operation <strong>Groundnut</strong>’) to promote groundnut cultivation, organize the<br />
official market<strong>in</strong>g system and diffuse improved production methods. Thus<br />
began a series of bilateral and multilateral projects aimed at <strong>in</strong>creas<strong>in</strong>g<br />
groundnut production and productivity, which cont<strong>in</strong>ue to the present day.<br />
Unlike Senegal, prices <strong>in</strong> Mali are negotiated between buyers and sellers<br />
at each market without regard to officially-mandated rates. Prices vary<br />
40
etween markets, and over time throughout the year, l<strong>in</strong>ked to the relative<br />
abundance or scarcity of groundnut depend<strong>in</strong>g on the seasonality of the crop<br />
and its trade.<br />
Production and market<strong>in</strong>g<br />
<strong>Groundnut</strong> markets have been studied <strong>in</strong> the four ma<strong>in</strong> produc<strong>in</strong>g areas of<br />
Kita, Bougouni, Kolokani and San from 1995 to 2003. Initial data was<br />
collected by the Cellule de Planification et de Statistique, M<strong>in</strong>istère du<br />
Développement Rural et de l’Eau (Diagnostique de la Filière Arachide au<br />
Mali, 1998). Additional data was compiled by the Institut d’Economie Rurale<br />
(Kondié 2003).<br />
Improved groundnut varieties currently grown <strong>in</strong> Mali <strong>in</strong>clude Mossi-tiga<br />
(CN94-C), Saméké (JL 24), Kolofa (TS 32-1), 55-437, Niakhali-tiga<br />
(GH119-20), Samakho (73-28), Waliyar-tiga (ICG 7878), ICG (FDRS) 10,<br />
Kaarta-tiga, 47-10, 28-206, Flower 11 and 47-10.<br />
An estimated 60% of production reaches the market, mostly <strong>in</strong>-shell<br />
groundnut. Accord<strong>in</strong>g to IER, <strong>in</strong>-shell groundnut represented 65% of the<br />
marketed volumes (more than 90% <strong>in</strong> Kita, Bougouni and San). Only <strong>in</strong><br />
Kolokani did most producers <strong>in</strong>vest further process<strong>in</strong>g to market a shelled<br />
product, compris<strong>in</strong>g 83% of marketed volumes.<br />
The seasonality of groundnut market<strong>in</strong>g and the correspond<strong>in</strong>g seasonal<br />
price cycle vary between the four production areas studied. In Kita, Kolokani<br />
and San, product sales are well distributed throughout the year, with most<br />
volumes traded from December to June, January and June and December to<br />
August, respectively.<br />
In Bougouni, however, irrigated production allows producers to cultivate<br />
off-season, <strong>in</strong> order to sell 80% of their produce fresh dur<strong>in</strong>g August and<br />
September, when other markets are dry and demand is highest. The<br />
rema<strong>in</strong>der is sold from October to April. The highest prices <strong>for</strong> <strong>in</strong>-shell<br />
groundnut are obta<strong>in</strong>ed dur<strong>in</strong>g June and July dur<strong>in</strong>g the plant<strong>in</strong>g season, when<br />
groundnut is scarce on most markets.<br />
In the producer areas, groundnut trade is conducted primarily by farmers<br />
look<strong>in</strong>g <strong>for</strong> secondary <strong>in</strong>come dur<strong>in</strong>g the dry season follow<strong>in</strong>g the harvest,<br />
under contract to wholesalers based <strong>in</strong> the towns <strong>in</strong> production areas, who<br />
provide pre-f<strong>in</strong>anc<strong>in</strong>g or guaranteed purchase of produce collected <strong>for</strong> a price<br />
negotiated <strong>in</strong> advance. Transport costs vary considerably from area to area,<br />
depend<strong>in</strong>g on the condition of the roads.<br />
41
Generally these ‘primary wholesalers’ buy only when they have as well<br />
been pre-f<strong>in</strong>anced, or have a trustworthy guarantee <strong>for</strong> purchase from a<br />
secondary level of wholesalers based <strong>in</strong> Bamako and Kayes, the centers of<br />
consumption and export. This commercial system is based on personal<br />
confidence and trust, and thus is difficult <strong>for</strong> newcomers to enter. Most of<br />
these secondary wholesalers do not trade exclusively <strong>in</strong> groundnut, rather <strong>in</strong> a<br />
range of agricultural commodities (<strong>in</strong>clud<strong>in</strong>g millet, sorghum and maize) as a<br />
strategy to m<strong>in</strong>imize risk.<br />
Although storage times vary somewhat between the production areas, <strong>in</strong><br />
general the market favors movement of produce as quickly as possible, and<br />
little <strong>in</strong>vestment is made <strong>in</strong> storage treatments and facilities. There is thus no<br />
speculative stock<strong>in</strong>g to speak of, partly reflect<strong>in</strong>g limited access to capital.<br />
Product pric<strong>in</strong>g<br />
In general, the producers have very limited powers of negotiation as regards<br />
price <strong>for</strong>mation. Prices are fundamentally negotiated between the primary<br />
and secondary wholesalers not <strong>in</strong> the production areas, but rather <strong>in</strong> the<br />
centers of consumption and export.<br />
Lack of access to market <strong>in</strong><strong>for</strong>mation greatly hampers the negotiat<strong>in</strong>g<br />
ability of the producers. As the wholesalers are relatively few, urban and <strong>in</strong><br />
communication with each other, they have the ability to set prices between<br />
themselves, while the producers – though many – are generally scattered and<br />
poorly organized, with the exception of Kita.<br />
As <strong>in</strong> Niger and Nigeria, prices are neither consistent across the country<br />
(‘pan-territorial’ as <strong>in</strong> Senegal), nor are they ‘fixed’ <strong>for</strong> the year; they vary<br />
widely throughout the year as a function of their availability, accord<strong>in</strong>g to the<br />
annual production cycle (see Figure 3).<br />
Figure 3. Seasonal producer price fluctuations on Kita market, January<br />
1994–May 1997.<br />
42
While the harvest extends from October through December, market<strong>in</strong>g<br />
takes place <strong>in</strong> most areas from December through May, to the beg<strong>in</strong>n<strong>in</strong>g of<br />
June. From April through August, prices steadily rise as the product becomes<br />
scarce. Prices fall to their lowest po<strong>in</strong>t from September through November <strong>in</strong><br />
anticipation of the new harvest, due to the high moisture content and<br />
perishability of the new harvest as it dries, and probably <strong>in</strong> response to<br />
decl<strong>in</strong><strong>in</strong>g product quality of whatever rema<strong>in</strong>s of the previous harvest.<br />
In Mali, there is a price differential between groundnut shelled manually<br />
and that shelled by a mach<strong>in</strong>e. <strong>Groundnut</strong> shelled by hand obta<strong>in</strong>ed a<br />
premium of between fCFA 10 and 25 per kg as compared to the mach<strong>in</strong>edecorticated<br />
product, which is more prone to damage ie, crack<strong>in</strong>g of the<br />
kernels.<br />
<strong>Market</strong> profiles<br />
Kita<br />
One of the first production areas, Kita is considered ‘the <strong>Groundnut</strong> Bas<strong>in</strong> of<br />
Mali,’ contribut<strong>in</strong>g 21% of the total groundnut production of the country.<br />
Popular varieties <strong>in</strong> Kita are the early variety 47-10 <strong>in</strong> the northern areas<br />
of Didjian, Sébécoro and Toukoto, and the late-yield<strong>in</strong>g 28-206, which<br />
requires more water (800-1000 mm) <strong>in</strong> the southern areas of Kokofata,<br />
Sagabari and Sirakoro. In general, the only crop <strong>in</strong>puts purchased are<br />
fungicides, as fertilizers and <strong>in</strong>secticides are commonly seen as too expensive<br />
by producers.<br />
As noted above, market<strong>in</strong>g of groundnut takes place throughout the year,<br />
with about 60% of the crop sold between January and May. Stock<strong>in</strong>g of<br />
groundnut on farm is limited one or two months. Recent production trends <strong>in</strong><br />
Kita <strong>in</strong>dicate a greater will<strong>in</strong>gness on the part of the producers to <strong>in</strong>vest <strong>in</strong><br />
transport from production areas <strong>in</strong> order to obta<strong>in</strong> better market prices<br />
<strong>in</strong> Kita.<br />
The costs of transport and handl<strong>in</strong>g have been calculated by IER at fCFA<br />
12.4 per kg of shelled groundnut. Farmers do not usually <strong>in</strong>vest their time <strong>in</strong><br />
shell<strong>in</strong>g, which is done ma<strong>in</strong>ly by the collectors. Collectors, <strong>in</strong> turn, sell to<br />
primary wholesalers <strong>in</strong> order to reduce transport costs, which are calculated<br />
by the bag rather than by weight (Kondié 2003).<br />
43
Primary wholesalers of Kita moved between 190 and 1,000 MT of<br />
shelled groundnut dur<strong>in</strong>g the year of the study, rarely leav<strong>in</strong>g Kita as transport<br />
has become the responsibility of the farmers or collectors. Stock<strong>in</strong>g times are<br />
limited, from a week to a month, partially reflect<strong>in</strong>g limited work<strong>in</strong>g capital.<br />
Trad<strong>in</strong>g l<strong>in</strong>ks extend from Kita to Bamako as a center of consumption (of<br />
over half the annual crop), and Kayes (25-30%) as a gateway to Senegal and<br />
beyond. Gu<strong>in</strong>ean and Ivorian exporters also operate <strong>in</strong> Kita, but only dur<strong>in</strong>g<br />
harvest and immediately afterwards. Some production also f<strong>in</strong>ds its way to<br />
Mauritania, either through Senegal or directly via Nioro. The <strong>for</strong>eign<br />
exporters generally do not pre-f<strong>in</strong>ance what they buy, and are thus obliged to<br />
purchase <strong>in</strong> cash whatever the primary wholesalers have <strong>in</strong> stock upon their<br />
arrival <strong>in</strong> Kita, without <strong>in</strong>vest<strong>in</strong>g <strong>in</strong> longer-term commercial arrangements.<br />
Accord<strong>in</strong>g to the Système d’In<strong>for</strong>mation du Marché Céréalier (SIM),<br />
product prices <strong>in</strong> Kita reflect a differential of fCFA 10.2 between the price<br />
paid to the producer and the sell<strong>in</strong>g price to the secondary wholesaler or<br />
exporter.<br />
The annual price cycle of Kita shows a full cycle (difference between<br />
lowest and highest annual price) about a factor of 2.3, rang<strong>in</strong>g between 150 to<br />
as high as 250 fCFA per kg accord<strong>in</strong>g to the season.<br />
Interest<strong>in</strong>gly, the early-yield<strong>in</strong>g variety 47-10 is appreciated <strong>in</strong> Ivory<br />
Coast <strong>for</strong> its high oil content, and it thus obta<strong>in</strong>s a price premium of fCFA 5 to<br />
25 over the late-yield<strong>in</strong>g variety 28-206. High levels of impurities or moisture<br />
will often result <strong>in</strong> a reduced price paid to the producer or collector.<br />
Kolokani<br />
Like Kita, Kolokani is one of the oldest groundnut-produc<strong>in</strong>g areas of Mali.<br />
<strong>Groundnut</strong> is grown ma<strong>in</strong>ly <strong>in</strong> the northern areas of the region, while cotton is<br />
grown <strong>in</strong> southern Kolokani. Yields <strong>in</strong> Kolokani are about 700 kg per hectare,<br />
as compared with an average of 1,000 kg per hectare <strong>in</strong> Kita. Despite this<br />
limited yield, groundnut is the ma<strong>in</strong> source of <strong>in</strong>come <strong>in</strong> the producer areas of<br />
Kolokani.<br />
The only improved variety used <strong>in</strong> Kolokani is 47-10 (early yield<strong>in</strong>g<br />
variety), as it is better adapted to the pluviometry of the area. As <strong>in</strong> Kita,<br />
fungicides are the only <strong>in</strong>puts used by most farmers <strong>in</strong> Kolokani. Animal<br />
traction is an important means of cultivation.<br />
The costs of transport and handl<strong>in</strong>g of groundnut <strong>in</strong> Kolokani is<br />
estimated by IER at fCFA 5.8 per kg. Transport to market is normally<br />
44
undertaken by collectors, as producers cannot af<strong>for</strong>d to transport their<br />
produce. The primary wholesalers of Kolokani move between 140 and 910<br />
MT of shelled groundnut annually, along with other types of agricultural<br />
produce.<br />
Wholesalers of Kolokani make a significantly greater <strong>in</strong>vestment <strong>in</strong> stock,<br />
stor<strong>in</strong>g produce from 4 to 6 months <strong>for</strong> purely speculative purposes, <strong>in</strong> order<br />
to <strong>in</strong>crease profits accord<strong>in</strong>g to the annual groundnut price cycle. Stocks are<br />
sold by September <strong>in</strong> order to avoid the annual price slump, which arrives<br />
with the new harvest.<br />
About 52% of the annual harvest is dest<strong>in</strong>ed <strong>for</strong> Bamako, 36% <strong>for</strong> Nara<br />
(one of two gateways to Mauritania), and some to Nioro (the second gateway).<br />
Some Ivorian buyers also frequent Kolokani. A m<strong>in</strong>imal proportion of the<br />
annual production of Kolokani is bought by manufacturers of peanut butter.<br />
Wholesalers will sometimes transport their stocks to Nara, though prices<br />
there are not particularly favorable despite strong demand <strong>in</strong> Mauritania.<br />
Wholesalers will not transport their produce directly to Mauritania because of<br />
security concerns – which may expla<strong>in</strong> the price pressure <strong>in</strong> Nara, as it is the<br />
Mauritanian buyers who must undertake the security risk of gett<strong>in</strong>g there<br />
and back.<br />
<strong>Market</strong> prices <strong>for</strong> shelled groundnut <strong>in</strong> Kolokani range between fCFA<br />
250 and 350 kg.<br />
San<br />
A traditional (if somewhat neglected) area of groundnut production, San has<br />
begun to focus on the crop. This has occurred under a recent government<br />
program <strong>for</strong> <strong>in</strong>come diversification <strong>in</strong> areas unfavorable to cotton production.<br />
Yields <strong>in</strong> San are lower than <strong>in</strong> Kita or Kolokani, limited to 640 kg per hectare<br />
due to limited ra<strong>in</strong>fall. San produces an estimated 5% of the national total<br />
groundnut crop.<br />
In addition to the collectors who serve the primary wholesalers of San,<br />
traders or ‘half-wholesalers’ also operate <strong>in</strong> the weekly markets of the<br />
production areas, notably Téné and Tom<strong>in</strong>ian.<br />
For the wholesalers of San, groundnut is a product of secondary<br />
importance, as most specialize <strong>in</strong> trad<strong>in</strong>g the millet bound <strong>for</strong> the northern<br />
towns of Mopti and Gao, rice, sorghum and beans. Volumes of groundnut<br />
traded by these wholesalers are limited to between 0.6 and 2.5 MT per year.<br />
45
Buyers of groundnut from the San wholesalers are ma<strong>in</strong>ly wholesalers<br />
from Mopti and Gao, though Ivorian buyers come to San seek<strong>in</strong>g Tigadièni,<br />
a local groundnut variety which is highly esteemed <strong>in</strong> Cote d’Ivoire.<br />
Reliable market price data <strong>for</strong> San is not available.<br />
Boungouni<br />
The groundnut produc<strong>in</strong>g area of Boungouni is divided between the moist<br />
Sudan and dry Gu<strong>in</strong>ea savanna zones. As <strong>in</strong> San, groundnut yields <strong>in</strong><br />
Boungouni are limited to 760 kg per hectare.<br />
The producers of Boungouni specialize <strong>in</strong> the production of fresh<br />
groundnut <strong>for</strong> which Bamako provides high demand. Up to 80% of sales are<br />
made dur<strong>in</strong>g August and September, just be<strong>for</strong>e the price drops.<br />
As Boungouni is favored by available transport to Bamako, producers and<br />
collectors tend to market their produce <strong>in</strong> the city; the role of wholesalers <strong>in</strong><br />
Boungouni is m<strong>in</strong>imal, account<strong>in</strong>g <strong>for</strong> only an estimated 18% of traded<br />
volumes. Transport costs from production areas are estimated at fCFA 8.7 to<br />
Boungouni, and fCFA 13 to Bamako (IER 2003). Accord<strong>in</strong>gly, the wholesalers<br />
are obliged to move around the production areas seek<strong>in</strong>g product, <strong>for</strong> which<br />
they must cover transport costs to Boungouni.<br />
The volumes traded by the wholesalers of Boungouni ranged between 16<br />
and 300 MT per year. About 90% of the trade takes place between October<br />
and April.<br />
While wholesalers of Bamako buy the first (<strong>in</strong>-shell) harvest dur<strong>in</strong>g<br />
August and September, exporters (from Cote d’Ivoire, Gu<strong>in</strong>ea, Mauritania<br />
and even Algeria) favor the high oil-yield<strong>in</strong>g improved variety 47-10 <strong>in</strong><br />
particular. Other buyers <strong>in</strong>clude producers of peanut butter to satisfy local<br />
demand.<br />
5.4 Niger<br />
Fifteen respondents – farmers, collectors, traders, artisanal and <strong>in</strong>dustrial<br />
processors – were <strong>in</strong>terviewed us<strong>in</strong>g a <strong>for</strong>mal questionnaire from June to<br />
September 2003 (see follow<strong>in</strong>g pages). Three respondents were <strong>in</strong>terviewed<br />
<strong>in</strong> Dosso, ten <strong>in</strong> Maradi, one <strong>in</strong> Dan Issa, and one <strong>in</strong> Niamey. Additional<br />
statistical <strong>in</strong><strong>for</strong>mation was obta<strong>in</strong>ed from the Système d’In<strong>for</strong>mation sur les<br />
Marchés Agricoles (SIMA) of the M<strong>in</strong>istry of Agriculture.<br />
46
This market profile is based on the actual data collected, while<br />
government price statistics are also presented <strong>for</strong> comparison. In most cases,<br />
they are consistent with the data collected.<br />
Table 5. Production figures <strong>for</strong> groundnut <strong>in</strong>-shell (2000-2003) <strong>for</strong> Niger.<br />
Planted Yield Production<br />
Department (ha) (Kg/ha) (MT)<br />
2000-2001<br />
Agadez 0 0 0<br />
Diffa 157 39 6<br />
Dosso 21,006 498 10,461<br />
Maradi 175,819 339 59,603<br />
Niamey 71 113 8<br />
Tahoua 19,830 296 5,870<br />
Tillabery 7,300 144 1,051<br />
Z<strong>in</strong>der 136,155 266 36,217<br />
Niger<br />
2002-2003<br />
360,338 314 113,216<br />
Agadez 0 0 0<br />
Diffa 215 426 92<br />
Dosso 33,379 668 22,283<br />
Maradi 142,255 372 52,901<br />
Niamey - - -<br />
Tahoua 81,409 546 44,434<br />
Tillabery 8,279 399 3,302<br />
Z<strong>in</strong>der 69,018 445 30,717<br />
Niger 334,555 460 153,729<br />
Source: Résultats Déf<strong>in</strong>itifs de la Campagne Agricole 2000/2001.<br />
47
<strong>Groundnut</strong> Trader/Trade Association Questionnaire<br />
(CONFIDENTIAL)<br />
Name of respondent: Date:<br />
Name of enterprise:<br />
Address: Place:<br />
Tel/fax:<br />
Email:<br />
1. Which products do you trade <strong>in</strong> (seed, gra<strong>in</strong>, oil, other)?<br />
2. If seed and/or gra<strong>in</strong>, which types (varieties) do you prefer?<br />
3. Are preferred varieties priced differently than others (if so, how)?<br />
4. Where are the ma<strong>in</strong> production areas (that you buy from)?<br />
4b. Do you buy from the market, from traders, from <strong>in</strong>dividual farmers or<br />
from farm<strong>in</strong>g associations? Do you have any long-term buy<strong>in</strong>g<br />
arrangements?<br />
5. How does the product reach you? Who is responsible <strong>for</strong> transport, and at<br />
what cost?<br />
6. How do you determ<strong>in</strong>e product quality?<br />
7. How do you determ<strong>in</strong>e the buy<strong>in</strong>g price?<br />
8. At what price do you buy dur<strong>in</strong>g each month (estimated and confidential)?<br />
48<br />
a) July<br />
b) August<br />
c) September<br />
d) October<br />
e) November<br />
f) December<br />
g) January<br />
h) February<br />
i) March<br />
j) April<br />
k) May<br />
l) June<br />
Range<br />
‘Average’ price (lowest price – highest price)
9. Who buys your products (where)? How many buyers do you trade with?<br />
10. How do you determ<strong>in</strong>e your sell<strong>in</strong>g price?<br />
11. Does the buyer prefer a certa<strong>in</strong> variety (of seed or gra<strong>in</strong>)?<br />
12. Are preferred varieties priced differently from others (if so, how)?<br />
Does the buyer require a certa<strong>in</strong> quality (if so, how is this determ<strong>in</strong>ed)?<br />
13. How do you f<strong>in</strong>d the buyer (or how does the buyer f<strong>in</strong>d you)?<br />
14. How does the product reach the buyer (who is responsible <strong>for</strong> transport,<br />
and at what cost)? Are there any costs of market<strong>in</strong>g besides transport?<br />
15. At what price do you sell dur<strong>in</strong>g each month (estimated and confidential)?<br />
a) July<br />
b) August<br />
c) September<br />
d) October<br />
e) November<br />
f) December<br />
g) January<br />
h) February<br />
i) March<br />
j) April<br />
k) May<br />
l) June<br />
Range<br />
‘Average’ price (lowest price – highest price)<br />
16. What volume of (each) product did you trade this year?<br />
17. What volume of (each) product did you trade last year?<br />
18. What volume do you estimate you will trade this year?<br />
19. Where is the f<strong>in</strong>al dest<strong>in</strong>ation of your product(s)?<br />
20. Have you been able to export your product(s) outside of Niger?<br />
21. Do you <strong>for</strong>esee more exports <strong>in</strong> future (if not, why not)?<br />
22. What are the greatest obstacles to your bus<strong>in</strong>ess? (What are the limits to<br />
the amount you buy and sell? What might make your sell<strong>in</strong>g price lower<br />
than you had anticipated)?<br />
23. What steps can you (or other parties) take to <strong>in</strong>crease your bus<strong>in</strong>ess?<br />
49
Results of the Survey<br />
Niamey<br />
Niamey is a national center <strong>for</strong> consumption and a transit po<strong>in</strong>t and trade<br />
center between the Nigerien ‘<strong>Groundnut</strong> Bas<strong>in</strong>’ of Dosso, Maradi and Z<strong>in</strong>der<br />
regions and the trade routes to northern Mali (Ayorou to Gao) and Burk<strong>in</strong>a<br />
Faso (Torodi to Fada N’Gourma).<br />
As <strong>in</strong> Senegal (but not Mali), <strong>in</strong>dustrial centers are closer to production<br />
areas than to the capital (Maradi <strong>in</strong> particular), so the bulk of volume traded<br />
does not necessarily pass through Niamey, as it does <strong>in</strong> the case of Bamako.<br />
The bulk of regional trade <strong>in</strong>volves import and export between<br />
production areas, markets and <strong>in</strong>dustrial centers of demand <strong>in</strong> Nigeria –<br />
Sokoto, Kats<strong>in</strong>a, Kano and Maiduguri. <strong>Groundnut</strong> is traded with Nigeria, and<br />
with Ben<strong>in</strong>, Burk<strong>in</strong>a Faso, Ghana, Côte d’Ivoire and possibly Chad and Libya,<br />
<strong>in</strong> all <strong>for</strong>ms – <strong>in</strong>-shell, shelled, as oil and as meal.<br />
One wholesaler <strong>in</strong>terviewed <strong>in</strong> Niamey trades between 100 and 133 MT<br />
per year to buyers from Niger, Burk<strong>in</strong>a Faso and Ben<strong>in</strong>. This trader pays fCFA<br />
25,000 <strong>in</strong> storage rent per month, which would imply overhead storage costs<br />
of fCFA 2.25 to fCFA 3.00 per kg. Generally, transport is provided by both<br />
the seller and the buyer. Transport costs are at least fCFA 6.67 per kg <strong>for</strong><br />
groundnut <strong>in</strong>-shell.<br />
<strong>Groundnut</strong> prices <strong>in</strong> Niamey (<strong>in</strong>-shell, by 45 kg sacks) do not vary by a<br />
wide marg<strong>in</strong>, rang<strong>in</strong>g from fCFA 155 per kg dur<strong>in</strong>g the harvest to fCFA 267<br />
per kg <strong>in</strong> July and August – a factor of only 1.7.<br />
Dosso<br />
Dosso region extends south of Niamey to the Ben<strong>in</strong> border at Gaya/<br />
Malanville. <strong>Groundnut</strong> production here is primarily a women’s activity, as is<br />
the household process<strong>in</strong>g of oil and kulikuli <strong>for</strong> household consumption and<br />
<strong>for</strong> sale. Income from sales of groundnuts, groundnut oil and kulikuli is<br />
commonly used to support household requirements <strong>in</strong>clud<strong>in</strong>g children’s<br />
healthy and education.<br />
The seasonality of production and market<strong>in</strong>g is consistent with Senegal<br />
and Mali, with harvest start<strong>in</strong>g <strong>in</strong> October, and the bulk of trade occurr<strong>in</strong>g<br />
from October through January when prices are lowest.<br />
A woman farmer <strong>in</strong> Boboye sells between 450 and 675 kg of shelled<br />
groundnut per year locally, while a cooperative of 20 farmers sells between<br />
50
54 and 90 MT of <strong>in</strong>-shell groundnut each year. A woman farmer who produces<br />
both oil and kulikuli sells 200 to 300 liters (180-270 kg) of groundnut oil<br />
locally each year, though she does not keep track of how much kulikuli she<br />
sells.<br />
<strong>Groundnut</strong> prices <strong>in</strong> Dosso (<strong>in</strong>-shell, <strong>in</strong> 45 kg sacks) ride a wide range<br />
throughout the year, from only fCFA 67 per kg dur<strong>in</strong>g the harvest (October<br />
and November) to 267 fCFA per kg from May to September – a factor of 4.<br />
<strong>Groundnut</strong> oil prices range between fCFA 500 per liter (September and<br />
October) and fCFA 1,000 per liter (May) – a factor of two.<br />
Maradi<br />
Maradi is the center of the ‘<strong>Groundnut</strong> Bas<strong>in</strong>’ <strong>in</strong> geographic as well as<br />
commercial and <strong>in</strong>dustrial terms. The OLGA Oil company, the preem<strong>in</strong>ent<br />
(private) oil process<strong>in</strong>g company is based <strong>in</strong> Maradi.<br />
OLGA buys groundnut only two or three times a year, <strong>in</strong> m<strong>in</strong>imum lots<br />
of 90-175 MT, from production areas <strong>in</strong> Maradi, Tahoue, Z<strong>in</strong>der, Konni and as<br />
far away as Nigeria, Dosso and Gaya. From 2002 to 2003, OLGA <strong>in</strong>creased its<br />
production and sales from 495 MT to 1,080 MT of groundnut oil, sold to<br />
buyers <strong>in</strong> Niamey, Nigeria and Burk<strong>in</strong>a Faso.<br />
A male farmer <strong>in</strong> Dan Issa hires labor and sells between 1.8 and 2.7 MT<br />
of <strong>in</strong>-shell groundnut per year locally, and to buyers from Maradi and Nigeria.<br />
Storage on-farm is kept to an absolute m<strong>in</strong>imum.<br />
In-shell groundnut prices <strong>in</strong> Maradi are comparable to those of Niamey, a<br />
direct result of high (and currently unmet) <strong>in</strong>dustrial demand <strong>in</strong> Maradi and<br />
across the border <strong>in</strong> Kats<strong>in</strong>a, Kano and Zaria. While trade <strong>in</strong> groundnut<br />
products flows <strong>in</strong> both directions, Niger is currently a net importer of<br />
groundnut (shelled and unshelled), groundnut oil and meal.<br />
Prices <strong>for</strong> <strong>in</strong>-shell groundnut (by 45 kg sacks) range from fCFA 133<br />
dur<strong>in</strong>g the harvest (September through November) to fCFA 267 per kg dur<strong>in</strong>g<br />
July and August – a factor of 2.0.<br />
Wholesalers <strong>in</strong> Maradi make a premium of between fCFA 11 per kg and<br />
fCFA 33 per kg of <strong>in</strong>-shell groundnut. Interest<strong>in</strong>gly, the profit marg<strong>in</strong> is<br />
highest from September to November, just as the harvest comes <strong>in</strong> and the<br />
ma<strong>in</strong> trad<strong>in</strong>g season, when prices are lowest. These returns (profits) thus<br />
account <strong>for</strong> upto 20% of their sell<strong>in</strong>g price dur<strong>in</strong>g the peak trad<strong>in</strong>g season.<br />
Wholesalers <strong>in</strong>terviewed <strong>in</strong> Maradi traded between 6.7 and 1500 MT, sell<strong>in</strong>g<br />
to OLGA Oil and to buyers <strong>in</strong> Nigeria, Côte d’Ivoire and Ghana.<br />
51
For groundnut imported from Nigeria, transport costs (of fCFA 500 per<br />
sack) are fCFA 11 per kg <strong>for</strong> <strong>in</strong>-shell groundnut, or fCFA 5.3 per kg <strong>for</strong> shelled<br />
groundnut, s<strong>in</strong>ce costs are calculated by volume and not by weight. Customs<br />
costs are fCFA 1,000 per sack or fCFA 10.5 per kg of shelled groundnut.<br />
Prices <strong>for</strong> shelled groundnut range between fCFA 263 per kg (October<br />
through December) to fCFA 347 (June through August) – a factor of 1.3.<br />
However, this high price actually seems low accord<strong>in</strong>g to the standard<br />
conversion factor of 0.507 from <strong>in</strong>-shell to shelled groundnut (Danguioua<br />
2000), while the lower price is spot-on.<br />
Prices <strong>for</strong> artisan-produced groundnut oil range between a low of fCFA<br />
575 per liter (October through January) to fCFA 1,000 per liter from July to<br />
September – a factor of 1.7 – while the price of <strong>in</strong>dustrially-produced OLGA<br />
oil rema<strong>in</strong>s constant at fCFA 955 per liter.<br />
Prices <strong>for</strong> groundnut meal <strong>in</strong> the <strong>for</strong>m of kulikuli (25 kg sac) range from<br />
fCFA 55 per kg dur<strong>in</strong>g the harvest to fCFA 100 per kg to the producer or<br />
collector – a range of 1.8.<br />
One cooperative <strong>in</strong>terviewed <strong>in</strong> Dan Issa produced 1,966 liters of<br />
groundnut oil last year, and expects a slightly larger turnover this year, sell<strong>in</strong>g<br />
to consumers <strong>in</strong> Maradi, Niamey, Nigeria, Ghana and (<strong>for</strong>merly) Ivory Coast –<br />
though the latter is no longer an active market due to the war. The cooperative<br />
also sold some 5,000 kg of processed meal (as kulikuli) to buyers on the local<br />
market, <strong>in</strong> Maradi and to Nigeria.<br />
5.5 Nigeria<br />
Formerly the largest exporter of groundnut <strong>in</strong> the world at 500,000 tons a year<br />
(Purseglove 1968), the decl<strong>in</strong>e of groundnut sector <strong>in</strong> Nigeria has become<br />
much lamented, though accord<strong>in</strong>g to recent FAOSTAT figures Nigerian<br />
groundnut still accounts <strong>for</strong> 41% of the total <strong>West</strong> <strong>Africa</strong>n groundnut<br />
production.<br />
As <strong>in</strong> Senegal, most production is dest<strong>in</strong>ed <strong>for</strong> the oil mills, to serve a<br />
huge domestic demand <strong>for</strong> groundnut oil (Kettlewell 2003). Major produc<strong>in</strong>g<br />
states are Kano, Kats<strong>in</strong>a, Kaduna, Sokoto, Jigawa, Kebbi <strong>in</strong> the northwest;<br />
Bauchi, Yobe, Borno <strong>in</strong> the northeast; and the Jos Plateau, Benue and Niger<br />
states <strong>in</strong> the central part of the country.<br />
52
Production and market<strong>in</strong>g<br />
<strong>Groundnut</strong> cultivation <strong>in</strong> Nigeria began <strong>in</strong> earnest around 1912, when<br />
producers <strong>in</strong> northern Nigeria were encouraged to plant groundnut <strong>in</strong><br />
response to high world prices. The city of Kano became the heart of the<br />
Nigerian ‘<strong>Groundnut</strong> Bas<strong>in</strong>,’ be<strong>in</strong>g situated as the railhead to the port of<br />
Lagos. At the peak of the groundnut boom <strong>in</strong> the 1960s, productivity outran<br />
the roll<strong>in</strong>g stock on the Nigerian railway, and harvested groundnut was stored<br />
<strong>in</strong> huge pyramids of sacks, which grew to dom<strong>in</strong>ate the Kano city skyl<strong>in</strong>e,<br />
await<strong>in</strong>g rail transport to Lagos and export to Europe. The proud groundnut<br />
pyramids of Kano have disappeared, though they rema<strong>in</strong> a source of nostalgia,<br />
surfac<strong>in</strong>g occasionally <strong>in</strong> political appeals to restore the productive glory of<br />
northern Nigerian agriculture.<br />
The famed <strong>for</strong>mer groundnut<br />
pyramids of Kano.<br />
Internet Source<br />
The Nigerian groundnut sector was once well structured and organized,<br />
more or less consistent with the parastatal structures of Senegal, with fixed<br />
prices and a state market<strong>in</strong>g board to facilitate export. In 1964, the <strong>in</strong>tergovernmental<br />
<strong>Africa</strong>n <strong>Groundnut</strong> Council (AGC) was founded at Lagos,<br />
compris<strong>in</strong>g Nigeria, Senegal, The Gambia, Mali, Niger and Sudan to advise<br />
produc<strong>in</strong>g countries on market<strong>in</strong>g policies and adm<strong>in</strong>ister a compensation<br />
fund on behalf of member states. Nom<strong>in</strong>ally still <strong>in</strong> existence, the mandate of<br />
the AGC describes a regional body which “ensures remunerative prices <strong>for</strong><br />
groundnut and its by-products <strong>in</strong> the world market; promotes groundnut<br />
consumption, organizes exchange of technical and scientific <strong>in</strong><strong>for</strong>mation on<br />
research relat<strong>in</strong>g to the production, market<strong>in</strong>g and possible uses of<br />
groundnuts, and promotes solidarity among member states”. Nigerian<br />
groundnut production reached a peak of 1.6 million MT <strong>in</strong> 1973, just be<strong>for</strong>e<br />
53
the oil boom trans<strong>for</strong>med Nigeria <strong>in</strong>to a different country, nearly overnight. At<br />
a critical time <strong>in</strong> the development of the groundnut sector, the agriculture<br />
sector came to be neglected <strong>in</strong> the rush <strong>for</strong> oil revenue and city jobs <strong>for</strong> youth<br />
who might otherwise have gone <strong>in</strong>to farm<strong>in</strong>g.<br />
Nature did not help. Drought conditions <strong>in</strong> 1974/75 have been blamed<br />
<strong>for</strong> an <strong>in</strong>festation of aphids, which spread the deadly rosette virus, an outbreak<br />
that destroyed nearly 750,000 hectares of the1975 harvest amount<strong>in</strong>g to a loss<br />
of $250 million. There were further epidemics <strong>in</strong> 1983, 1885 and 1988 (Ntare<br />
2002). With<strong>in</strong> little more than a decade from the 1973 peak, groundnut<br />
production had dropped by over 50%, to a mere 0.7 million MT.<br />
Liberalization of the groundnut sector came about <strong>in</strong> 1986, with the<br />
rather sudden abolition of the market<strong>in</strong>g boards by the Government of<br />
Nigeria. Jason Lovelace (2002) sharply criticizes the transition, which he<br />
refers to as <strong>in</strong>dicative of<br />
54<br />
…‘worst practice’ <strong>in</strong> terms of manag<strong>in</strong>g [such] a transition…. These<br />
changes were made rapidly and with little plann<strong>in</strong>g. The roles to be<br />
played by the private sector were not clearly def<strong>in</strong>ed, and steps<br />
were not undertaken to ensure that major functions be<strong>in</strong>g carried<br />
out by the market<strong>in</strong>g board were adequately transferred to the<br />
private sector. Also, adm<strong>in</strong>istratively determ<strong>in</strong>ed prices were<br />
liberalized ‘overnight’, but <strong>in</strong>dicative prices were not provided.<br />
(Lovelace 2002, with reference to Shepherd and Farolfi 1999).<br />
S<strong>in</strong>ce liberalization, the groundnut market<strong>in</strong>g structure was dismantled,<br />
and the private sector has taken over. Farmers are no longer assured a ready<br />
market, and they must struggle to obta<strong>in</strong> market <strong>in</strong><strong>for</strong>mation across a<br />
promis<strong>in</strong>g yet fluid (and sometimes volatile) market.<br />
After more than a decade of “dormancy,” the AGC was apparently<br />
revived last year and its headquarters shifted from Lagos to Kano. In a speech<br />
read <strong>for</strong> him by the M<strong>in</strong>ister of Commerce, the Vice President of Nigeria,<br />
Alhaji Mustapha Bello, lamented:<br />
“… the un<strong>for</strong>tunate period of dormancy [of the AGC]. This largely<br />
had to do with lack of political will on the part of members. In<br />
realization of this unwholesome trend and the renewed<br />
determ<strong>in</strong>ation to reverse same, the President of Nigeria president<br />
graciously granted approval to the current chairman of the AGC<br />
and the Commerce M<strong>in</strong>ister to convene this session…. I appeal to<br />
member states to show more commitment; I also enjo<strong>in</strong> the AGC
to reciprocate the ef<strong>for</strong>ts of members states by develop<strong>in</strong>g<br />
sufficient high quality disease and drought resistant seeds <strong>for</strong><br />
distribution to member states”. (quoted <strong>in</strong> Musa 2002).<br />
These strong statements are reflective of a renewed commitment on the<br />
part of the Government of Nigeria to revive the Nigerian groundnut sector.<br />
ICRISAT reports that the state of Kano has recently imported “large<br />
quantities” of the improved variety 55-543 to improve access to seed <strong>for</strong><br />
producers (Ntare 2002). These <strong>in</strong>dications are <strong>in</strong>deed promis<strong>in</strong>g <strong>for</strong> the<br />
groundnut producers of Nigeria, and the groundnut sector <strong>in</strong> general.<br />
<strong>Groundnut</strong> prices and markets<br />
Government statistics show no export of groundnut from 1998-2002, and no<br />
export of groundnut oil s<strong>in</strong>ce that year (NESG 2003). By the mid-1980s<br />
significant quantities were be<strong>in</strong>g imported from Gambia to keep the oil mills<br />
runn<strong>in</strong>g. However, regional trade is known to be very extensive.<br />
Un<strong>for</strong>tunately, accurate trade figures are not available, and thus this critical<br />
regional market is very difficult to document and quantify.<br />
Despite the official figures, which seem to <strong>in</strong>dicate that Nigerian official<br />
exports have dropped to noth<strong>in</strong>g, sub-regional trade is thriv<strong>in</strong>g, particularly<br />
between Nigeria and Niger, with trade flows extend<strong>in</strong>g <strong>in</strong> both directions.<br />
Some groundnuts may cross the border several times be<strong>for</strong>e they are<br />
processed, as supply and demand fluctuate aga<strong>in</strong>st a highly fluid official<br />
exchange rate between the Naira (NGN) and CFA Franc (fCFA), to be<br />
discussed <strong>in</strong> further detail below.<br />
<strong>Market</strong> prices vary significantly between markets, as <strong>in</strong>dicated by price<br />
data obta<strong>in</strong>ed by the IFDC-DAIMINA Field Survey, and by SIMA of the<br />
Niger M<strong>in</strong>istry of Agriculture (Table 6).<br />
Table 6. <strong>Groundnut</strong> product prices, August 2003.<br />
State<br />
Product Kano Bauchi Oyo<br />
In Naira (NGN)<br />
<strong>Groundnut</strong> <strong>in</strong>-shell per kg 100 95 130<br />
Shelled groundnut per kg 80 100 80<br />
<strong>Groundnut</strong> oil per l (0.9 kg) 195 160 150<br />
Exchange Rate: US$1 = NGN 128<br />
Source: IFDC-DAIMINA Field Survey.<br />
55
<strong>Market</strong> prices <strong>for</strong> Zaria from January 2002 through December 2003<br />
were obta<strong>in</strong>ed from the IAR-Samaru (Table 7).<br />
Table 7. <strong>Groundnut</strong> prices <strong>for</strong> Nigeria: Zaria, Kaduna State 2003–2004 [prices by<br />
month <strong>in</strong> Nigeria Naira (NGN)].<br />
Month 2002 2003 Monthly average<br />
January 50.6 - 51<br />
February 65.26 39.25 53<br />
March 73.7 74.8 74<br />
April 82.5 77 80<br />
May 74.8 81.58 78<br />
June 82.5 105.23 94<br />
July 103.18 101 102<br />
August 96.8 104.5 101<br />
September 65.27 68.2 67<br />
October 62.33 73.48 68<br />
November 65.63 91.3 78<br />
December 65.45 99 82<br />
Average 74 83<br />
Source: IAR.<br />
However, the picture becomes more complicated as we consider the<br />
exchange rate between Naira and fCFA dur<strong>in</strong>g the same period (see Table 7).<br />
<strong>Groundnut</strong> price figures <strong>for</strong> Zaria market seem unrealistically high,<br />
when converted to fCFA at official rates of exchange (which are highly fluid)<br />
(see Table 8). However, it is very unlikely that official rates are used to make<br />
<strong>in</strong><strong>for</strong>mal deals across the border, although the implications of a fluid official<br />
exchange rate are not clear, as accurate data on such transactions is not<br />
available (Danguioua 2000).<br />
Some deductions can be made, however, based on a regional exchange<br />
rate analysis conducted by LARES, a collaborative sub-regional program<br />
between Ben<strong>in</strong>, Niger, Nigeria, Cameroon and Chad. The LARES study<br />
exam<strong>in</strong>ed actual exchange rates on a number of sub-regional markets, based<br />
on the data and analysis of the DAEEFP (M<strong>in</strong>ister of F<strong>in</strong>ances and Economy)<br />
Niger, the DSCN of Cameroon, the Nigerian universities of Zaria and<br />
Maïduguri, and OBADA (Chad).<br />
Although the sub-regional average was relatively close to the official<br />
(national) rates – show<strong>in</strong>g a 4.5% fall dur<strong>in</strong>g the first quarter 2003, from 4.9<br />
fCFA <strong>in</strong> January to 4.6 fCFA <strong>in</strong> March – significant differences were noted<br />
56
Table 8. Regional trade implications: Conversions from Naira to Francs CFA.<br />
Official rate of exchange NGN fCFA<br />
(1 NGN = fCFA)<br />
January 6.64478 50.6 336<br />
February 6.51265 65.26 425<br />
March 6.58105 73.7 485<br />
April 6.54534 82.5 540<br />
May 6.46675 74.8 484<br />
June 6.08639 82.5 502<br />
July 5.61795 103.18 580<br />
August 5.31989 96.8 515<br />
September 5.30174 65.27 346<br />
October 5.36387 62.33 334<br />
November 5.27338 65.63 346<br />
December 5.07839 65.45 332<br />
January 4.95308 - -<br />
February 4.79496 39.25 188<br />
March 4.84814 74.8 363<br />
April 4.76005 77 367<br />
May 4.51303 81.58 368<br />
June 4.26804 105.23 449<br />
July 4.61345 101 466<br />
August 4.67757 104.5 489<br />
September 4.50353 68.2 307<br />
October 4.32417 73.48 318<br />
November 4.12404 91.3 377<br />
December 3.88865 99 385<br />
*Official exchange rates (as at mid-month) from ‘www.oanda.com’.<br />
between the different markets surveyed. A -1.5% fall was evident <strong>in</strong> Igolo,<br />
while the rate fell by 8.8 <strong>in</strong> Konni and 9.7% at Gaya – more than twice as<br />
severe a drop as the official figures would <strong>in</strong>dicate.<br />
The complexity of the situation on the ground and the challenge of<br />
accurately document<strong>in</strong>g these regional trade <strong>in</strong>dicators <strong>for</strong> analysis is<br />
illustrated by the fact that dur<strong>in</strong>g the same period, the Naira actually<br />
appreciated by 0.7% <strong>in</strong> Ndjamena, with an average level of fCFA 5 when<br />
sell<strong>in</strong>g and fCFA 5.7 when buy<strong>in</strong>g.<br />
As the Government of Niger records trade <strong>in</strong> groundnut products as far<br />
east as Diffa (just across Lake Chad from Ndjamena, there are certa<strong>in</strong>ly<br />
57
implications on the groundnut sector from this large exchange-rate gradient<br />
along the common frontier that cannot readily be assessed with any<br />
confidence of reliability.<br />
Thus, the market Nigerian market prices reported <strong>in</strong> fCFA by SIMA <strong>in</strong><br />
Niger might possibly be considered more accurate and useful <strong>in</strong> terms of<br />
understand<strong>in</strong>g trade flows between the two countries, though even at official<br />
rates, the Zaria figures <strong>in</strong> CFA are comparable with those given <strong>for</strong> Sokoto.<br />
6,000<br />
5,800<br />
5,600<br />
5,400<br />
5,200<br />
5,000<br />
4,800<br />
4,600<br />
4,400<br />
4,200<br />
4,000<br />
Figure 4. Evolution of the fCFA/Naira exchange rates <strong>in</strong> the sub-region,<br />
August 2001 through March 2003.<br />
Source: LARES, L’Echo des Frontieres: Regional bullet<strong>in</strong> of cross - border trade monitor<strong>in</strong>g;<br />
www.refer.org/ben<strong>in</strong>/eco/lares.5.6<br />
58<br />
Aug-01<br />
Sep-01<br />
Oct-01<br />
Nov-01<br />
Dec-01<br />
Jan-02<br />
Feb-02<br />
Mar-02<br />
Apr-02<br />
May-02<br />
Jun-02<br />
Jul-02<br />
Aug-02<br />
Sep-02<br />
Oct-02<br />
Nov-02<br />
Dec-02<br />
Jan-03<br />
Feb-03<br />
Mar-03
5.6 Sub-regional market price data: Mali, Niger and<br />
Nigeria (2002-2003)<br />
Table 9. Mali groundnut price statistics: Producer prices <strong>for</strong> shelled groundnut on<br />
regional capital markets, October 1995 through September 1997.<br />
<strong>Market</strong><br />
Year Months Kayes Sikasso Ségou Mopti Gao Bamako<br />
1995 10 275 252 320 272 325 -<br />
1995 11 275 205 347 293 325 263<br />
1995 12 275 236 377 322 300 255<br />
1996 1 275 242 390 419 300 269<br />
1996 2 275 225 322 229 313 284<br />
1996 3 275 215 308 302 300 297<br />
1996 4 275 228 313 292 325 279<br />
1996 5 275 245 408 340 354 324<br />
1996 6 275 261 462 343 350 350<br />
1996 7 289 279 462 363 378 342<br />
1996 8 437 311 467 404 432 350<br />
1996 9 475 336 308 413 469 350<br />
1996 10 450 272 349 412 483 340<br />
1996 11 287 267 337 392 438 278<br />
1996 12 275 284 413 364 397 300<br />
1997 1 300 292 308 370 400 300<br />
1997 2 287 309 355 377 400 300<br />
1997 3 379 353 425 394 450 400<br />
1997 4 400 325 325 458 469 400<br />
1997 5 375 408 420 425 488 450<br />
1997 6 400 450 407 436 467 450<br />
1997 7 550 479 415 442 500 457<br />
1997 8 500 488 341 466 500 410<br />
1997 9 - - - - - 428<br />
Average <strong>for</strong> 1995/96 321 255 376 344 361 309<br />
Average <strong>for</strong> 1996/97 375 366 375 412 451 379<br />
Sources: DNSI and monthly market reports collected by IER.<br />
59
Table 10. National market prices (cost to consumer) <strong>in</strong> 2003 <strong>in</strong> CFA/Kg.<br />
60<br />
Niamey Agadez Diffa Dosso<br />
In-shell Shelled In-shell Shelled In-shell Shelled In-shell Shelled<br />
January 295 532 404 468 - 483 321 -<br />
February 298 548 269 454 - 446 343 -<br />
March 282 675 215 411 - 438 346 -<br />
April 287 547 318 389 - 476 - -<br />
May 287 537 259 365 - 443 - -<br />
June - - - - - - - -<br />
July - - - - - - - -<br />
August - - - - - - - -<br />
September - - - - - - - -<br />
October - - - - - - - -<br />
November - - - - - - - -<br />
December - - - - - - - -<br />
Average 290 568 293 417 - 457 337 -<br />
Tilabery Tahoua Maradi Dosso<br />
In-shell Shelled In-shell Shelled In-shell Shelled In-shell Shelled<br />
January 311 327 376 - 250 281 204 336<br />
February 294 322 376 - 283 291 214 296<br />
March 294 344 351 - 223 298 219 303<br />
April 294 331 401 - 250 318 229 308<br />
May 275 343 181 - 236 321 227 301<br />
June - - - - - - - -<br />
July - - - - - - - -<br />
August - - - - - - - -<br />
September - - - - - - - -<br />
October - - - - - - - -<br />
November - - - - - - - -<br />
December - - - - - - - -<br />
Average 294 334 337 - 248 302 219 309
Table 11. Regional groundnut trade <strong>in</strong> Niger (documented) <strong>for</strong> 2001-2003 (quantities <strong>in</strong> MT).<br />
2001-2002 2002-2003<br />
Regional dest<strong>in</strong>ation Border post Imports Exports Imports Exports<br />
Adare 0.25 0 23.82 3<br />
Ben<strong>in</strong><br />
Malanville<br />
Burk<strong>in</strong>a Faso<br />
Gaya 0 0 6 0<br />
Fada/Ouaga<br />
Mali<br />
Torodi 0 0 0 0<br />
Gao<br />
Nigeria<br />
Ayorou 0 0 4.2 0<br />
Kano Magaria 9 0 32.5 0<br />
Kano Sassombroum 0 0 4.2 0<br />
Kats<strong>in</strong>a Dan Issa 0 191 129.5 0<br />
Kats<strong>in</strong>a Matamaye 0 0 36.15 4<br />
Sokoto Dioundjou 2.3 0 0 0<br />
Sokoto Konni 977.48 0 204.8 0<br />
Sokoto Bangui 1.7 0 0.5 10.8<br />
Maiduguri (and Chad) Diffa 0 0 34 0<br />
Total 990.48 191 441.65 14.8<br />
Table 12. Regional market prices <strong>in</strong> 2003 <strong>for</strong> Ben<strong>in</strong>, Burk<strong>in</strong>a and Nigeria (prices <strong>in</strong> CFA/Kg).<br />
Nigeria<br />
Ben<strong>in</strong> Burk<strong>in</strong>a<br />
Illela Jibia Damssack<br />
Malanville Kantchari (Sokoto) (Kats<strong>in</strong>a) Mai adua (Maidugiri/Chad) Zaria**<br />
January 189 130 405 271 285 185 -<br />
February 220 137 444 192 277 198 188<br />
March 233 148 423 233 281 187 363<br />
April 245 150 416 308 320 182 367<br />
May 238 160 400 299 316 400 368<br />
June 248 170 397 316 312 380 449<br />
July 245 - 400 324 304 392 466<br />
August - - - - - - 489<br />
September - - - - - - 307<br />
October - - - - - - 318<br />
November - - - - - - 377<br />
December - - - - - - 385<br />
Average 231 149 359 278 299 275 370<br />
**IAR/Samaru<br />
Sources: Système d’In<strong>for</strong>mation sur les Marchés Agricoles (SIMA) M<strong>in</strong>istry of Agriculture; from NGN by official exchange<br />
rates (www.oanda.com).<br />
61
5.7 Additional observations<br />
Dist<strong>in</strong>guished by its history of strong state <strong>in</strong>tervention <strong>in</strong> the groundnut<br />
sector, followed by the current (and <strong>in</strong>cremental) process of liberalization,<br />
Senegal still stands dist<strong>in</strong>ct from Mali, Niger and Nigeria, though this may not<br />
be the case <strong>for</strong> much longer.<br />
Lament<strong>in</strong>g the uncerta<strong>in</strong>ties of the open market, respondents <strong>in</strong> Mali<br />
actually suggested that a fixed, pan-territorial price <strong>for</strong> groundnut would<br />
benefit producers – precisely the system that Senegal has been mov<strong>in</strong>g away<br />
from over the past decade – but it seems this wish goes aga<strong>in</strong>st the tides of<br />
history.<br />
Nonetheless, given Senegal’s progress, and the fact that <strong>in</strong>creased state<br />
<strong>in</strong>tervention <strong>in</strong> the groundnut sector is historically unlikely, the four countries<br />
studied will probably have more <strong>in</strong> common <strong>in</strong> the <strong>for</strong>eseeable future. Given<br />
the importance of regional trade, there is every reason why ef<strong>for</strong>ts should be<br />
made at the policy level to favor facilitation of this trade and perhaps aid a<br />
more reliable and (thus susta<strong>in</strong>able) market level than the <strong>in</strong>ternational.<br />
Constra<strong>in</strong>ts to production identified by respondents <strong>in</strong> Mali <strong>in</strong>clude low<br />
availability of quality (improved) seed <strong>in</strong> the produc<strong>in</strong>g areas. Lack of access<br />
to credit at all levels has also tended to discourage groundnut production.<br />
Accord<strong>in</strong>g to IER, producers identify the annual price cycle as a<br />
constra<strong>in</strong>t, and would prefer to have a fixed annual price, as <strong>in</strong> Senegal. Other<br />
constra<strong>in</strong>ts identified <strong>in</strong>cluded the poor state of the roads from the production<br />
areas to the centers of consumption and export, and market distortions caused<br />
by the scarcity of buyers dur<strong>in</strong>g certa<strong>in</strong> periods of the year. Among the<br />
wholesalers surveyed, the ma<strong>in</strong> constra<strong>in</strong>ts identified were a lack of access to<br />
capital, and a strong <strong>in</strong>dictment of the road <strong>in</strong>frastructure, particularly dur<strong>in</strong>g<br />
the ra<strong>in</strong>s.<br />
The groundnut sector profile <strong>for</strong> Niger is largely consistent with the data<br />
from Mali <strong>in</strong> terms of market structure, price differential by product and<br />
seasonal price fluctuations, though the fluctuations noted seemed generally<br />
slightly less than <strong>in</strong> Mali.<br />
Farmers and traders alike expressed little preference or awareness of<br />
improved varieties. Notable exceptions were OLGA Oil (with a preference<br />
<strong>for</strong> high oil content varieties from ICRISAT), a farmer of Maradi who<br />
preferred a smaller local variety (known <strong>in</strong> Hausa as Guia Mai Go Ga Wa),<br />
and a trader of Maradi who preferred another smaller local variety favored by<br />
his buyers known <strong>in</strong> Hausa as Kam Kodan Kwaya.<br />
62
While some respondent farmers expressed an unwill<strong>in</strong>gness to store their<br />
groundnut, preferr<strong>in</strong>g to move it as fast as possible despite the lowest prices<br />
predom<strong>in</strong>ant dur<strong>in</strong>g the harvest season, other farmers (and traders)<br />
mentioned access to good (dry) storage facilities as a constra<strong>in</strong>t.<br />
Both farmers and traders identified their lack of book-keep<strong>in</strong>g and basic<br />
bus<strong>in</strong>ess skills as a major constra<strong>in</strong>t to their market<strong>in</strong>g activities, as well as lack<br />
of access to market <strong>in</strong><strong>for</strong>mation. Both farmers and traders identified limited<br />
access to credit as a further constra<strong>in</strong>t.<br />
Due to the fluid and highly variable exchange rate of the Naira to CFA<br />
Franc, it is difficult to draw conclusions regard<strong>in</strong>g the actual flows of trade<br />
between Niger and Nigeria. Only through prompt and accurate monitor<strong>in</strong>g<br />
and exchange of market price and <strong>in</strong><strong>for</strong>mal exchange rate <strong>in</strong><strong>for</strong>mation can the<br />
scope and potential of the regional market be assessed.<br />
63
64<br />
6.0 Background and methodology<br />
The study began with collection of all available non-proprietary <strong>in</strong><strong>for</strong>mation<br />
on groundnut markets <strong>in</strong> each of the four focus countries, as well as the<br />
<strong>in</strong>ternational markets. Production and trade data was collected from<br />
FAOSTAT. <strong>Groundnut</strong> market data from ICRISAT was collected at the<br />
Bamako regional office from Dr Bonny Ntare, and from the ICRISAT country<br />
office <strong>for</strong> Niger from Dr Jupiter Ndjeunga.<br />
Further contacts and ideas were gathered at the ICRISAT regional office<br />
at Nairobi from Dr Said Silim and Dr Richard Jones, who had earlier (at<br />
Bamako) provided a list of relevant issues <strong>for</strong> consideration dur<strong>in</strong>g the course<br />
of the study. Trade contacts and other <strong>in</strong><strong>for</strong>mation were helpfully provided by<br />
Dr Juan Estrada of ICRISAT Malawi. Dr Ala<strong>in</strong> Mayeux of CIRAD, Senegal,<br />
also provided background <strong>in</strong><strong>for</strong>mation on the CIRAD groundnut market study<br />
<strong>for</strong> the country.<br />
Prelim<strong>in</strong>ary field visits were made <strong>in</strong> Niger, and a semi-structured<br />
<strong>in</strong>terview <strong>for</strong>mat and questionnaires were developed <strong>for</strong> a Niger country<br />
study, implemented dur<strong>in</strong>g July and August <strong>in</strong> Niamey, Dosso, Maradi and<br />
Z<strong>in</strong>der. Results from this study are now be<strong>in</strong>g compiled, as a basis <strong>for</strong> further<br />
work <strong>in</strong> Mali, Senegal and Nigeria.<br />
A diagnostic questionnaire has been sent to the National Agricultural<br />
Research System (NARS) partners and other national stakeholders of each of<br />
the project focus countries, <strong>in</strong> order to provide a basel<strong>in</strong>e of commercial and<br />
market data <strong>in</strong> support of the country market case studies <strong>for</strong> Senegal, Mali<br />
and Nigeria. In the case of Niger, the objective was to provide triangulation of<br />
market data collected dur<strong>in</strong>g the country market case study. The only<br />
response to the questionnaire received from the NARS partners and other<br />
national stakeholders was that of IAR-Samaru, Nigeria.<br />
A list of trade contacts <strong>in</strong> Europe was compiled, and prioritized accord<strong>in</strong>g<br />
to recent trade statistics. Contact was made with five of the key European<br />
commercial firms purchas<strong>in</strong>g and trad<strong>in</strong>g <strong>in</strong> imported groundnut. Interviews<br />
were conducted with three of these companies <strong>in</strong> the Netherlands, and<br />
further <strong>in</strong>terviews have been scheduled <strong>for</strong> September <strong>in</strong> the United<br />
K<strong>in</strong>gdom.
<strong>West</strong> <strong>Africa</strong><br />
Niger<br />
A Niger country market study was implemented dur<strong>in</strong>g July and August <strong>in</strong><br />
Niamey, Dosso, Maradi and Z<strong>in</strong>der, <strong>in</strong>clud<strong>in</strong>g structured and semi-structured<br />
<strong>in</strong>terviews with farmers, traders and other private sector stakeholders, NGOs<br />
and government bodies. Results from the study are currently be<strong>in</strong>g compiled.<br />
A questionnaire has been sent to NARS partner, INRAN, <strong>in</strong> order to<br />
triangulate data from the country market case study.<br />
Senegal<br />
A diagnostic questionnaire sent to NARS partner, ISRA/CNRA, to UNIS, and<br />
to CIRAD, <strong>in</strong> order to provide a basel<strong>in</strong>e of commercial and market data <strong>in</strong><br />
support of the country market case study <strong>for</strong> Senegal. A very useful and<br />
applicable study of the Senegal groundnut sector, with extensive price<br />
<strong>in</strong><strong>for</strong>mation and analysis, was recently published as a PhD thesis by Dr James<br />
Gray of the University of Vermont, USA (Gray 2002). Communication was<br />
made with the author <strong>in</strong> order to br<strong>in</strong>g the results of the study up to date.<br />
Interviews were conducted with Dr Oumar Chiekh Ba, director of the ISRA<br />
Bureau (BAME), and Dr Ala<strong>in</strong> Mayeux of CIRAD, who has already conducted<br />
extensive market research on the European market <strong>for</strong> confectionary<br />
groundnut (ARB) of Senegalese orig<strong>in</strong>. A follow-up visit to the <strong>Groundnut</strong><br />
Bas<strong>in</strong> (dur<strong>in</strong>g the groundnut harvest) and to Dakar was made <strong>in</strong> November -<br />
December 2003.<br />
Mali<br />
A diagnostic questionnaire sent to NARS partner, IER/CRRA, <strong>in</strong> order to<br />
provide a basel<strong>in</strong>e of commercial and market data <strong>in</strong> support of the country<br />
market case study <strong>for</strong> Mali. Reference materials on the Mali groundnut sector<br />
<strong>in</strong>cluded a 1998 country study by the M<strong>in</strong>istry of Agriculture, and a follow-up<br />
country study of the Mali groundnut sector by O Kodio of IER. This<br />
collaborative support of the market study by IER was most helpful to the<br />
purposes of the study. A follow-up visit to Mali was made <strong>in</strong> November 2003.<br />
65
Nigeria<br />
The progress of the market study <strong>in</strong> Nigeria was dealt a blow by the untimely<br />
demise of Dr Joshua of the Premier Seed Company, who was perhaps best<br />
situated to <strong>in</strong><strong>for</strong>m the study regard<strong>in</strong>g groundnut production and market<strong>in</strong>g <strong>in</strong><br />
Nigeria. A country profile <strong>for</strong> the Nigerian groundnut market was eventually<br />
developed with the collaborative support of the IAR-Samaru, <strong>for</strong> Zaria<br />
market. <strong>Market</strong> <strong>in</strong><strong>for</strong>mation <strong>in</strong>clud<strong>in</strong>g regional trade figures and groundnut<br />
price cycles <strong>for</strong> several other Nigerian markets was obta<strong>in</strong>ed <strong>in</strong> the course of<br />
the Niger market survey.<br />
Europe<br />
The Netherlands and the United K<strong>in</strong>gdom were identified as the most<br />
significant countries <strong>in</strong> the European groundnut trade, as they are by far the<br />
largest importers – account<strong>in</strong>g <strong>for</strong> 35% and 15% respectively of shelled<br />
groundnut imports to the 27 European countries <strong>in</strong> 2001. They imported<br />
225,265 and 101,895 MT, respectively, of a total 638,699 MT imported.<br />
The Netherlands is also by far the largest exporter <strong>in</strong> Europe, account<strong>in</strong>g<br />
<strong>for</strong> over 76% of European exports of shelled groundnut dur<strong>in</strong>g 2001 (43,303<br />
of 56,951 MT exported). As is the case with many commodities, the port of<br />
Rotterdam is the epicenter of the groundnut trade <strong>in</strong> Europe.<br />
Interviews were conducted with trade representatives of two of the<br />
larger European firms import<strong>in</strong>g groundnut, Mr Menno van der Pijll of<br />
Aldebaran Commodities BV, and Mr Anton Hendriks of Bohemia Nut<br />
Company BV, both based <strong>in</strong> Rotterdam. Each of these companies has an<br />
annual turnover of 25-30,000 MT of groundnut per year.<br />
An <strong>in</strong>terview was also conducted with Mr Paulo Bello, Purchase Director<br />
of The Nut Company (Arnhem, Netherlands), identified as the largest<br />
European end-user of groundnut, with an annual turnover of over 100,000<br />
MT. Accord<strong>in</strong>g to an <strong>in</strong><strong>for</strong>mant, the Nut Company has been buy<strong>in</strong>g up<br />
European groundnut bus<strong>in</strong>esses <strong>for</strong> the past decade, <strong>in</strong> a European groundnut<br />
market trend described <strong>in</strong> detail <strong>in</strong> Section 4.2.<br />
These <strong>in</strong>itial <strong>in</strong>terviews were highly <strong>in</strong><strong>for</strong>mative, shedd<strong>in</strong>g light on the<br />
current trade climate, and af<strong>for</strong>d<strong>in</strong>g several different perspectives as to how<br />
<strong>West</strong> <strong>Africa</strong>n producers might best situate themselves to negotiate an<br />
enhanced profile <strong>in</strong> the <strong>in</strong>ternational groundnut trade.
Communication was undertaken, and trade <strong>in</strong>terviews sought with<br />
the major UK import<strong>in</strong>g companies <strong>in</strong>clud<strong>in</strong>g Barrow Lane and Ballard.<br />
Mr Richard Kettlewell, a consultant to the Fair Trade company Tw<strong>in</strong> Trad<strong>in</strong>g,<br />
and a groundnut broker with long years of experience <strong>in</strong> <strong>West</strong> <strong>Africa</strong>, k<strong>in</strong>dly<br />
consented to a long and very detailed <strong>in</strong>terview <strong>in</strong> September 2003, which<br />
rounded out the contours of the European and world markets. Mr Kettlewell<br />
further provided some thoughtful and well-<strong>in</strong><strong>for</strong>med suggestions as to<br />
potential market strategies <strong>for</strong> the <strong>West</strong> <strong>Africa</strong>n groundnut producers.<br />
67
Appendices
Appendix 1: Statistical analysis of world trade <strong>in</strong> groundnut<br />
Table 13. Exports by the top eight countries <strong>for</strong> <strong>in</strong>-shell groundnut, 1992–2001 (quantities <strong>in</strong> MT).<br />
Year<br />
Average<br />
1992 1993 1994 1995 1996 1997 1998 1999 2000 2001 per year<br />
World 127,675 153,262 163,101 141,432 128,962 154,455 150,681 170,390 192,726 231,447 161,413<br />
Ch<strong>in</strong>a 33,340 38,598 67,744 37,021 50,485 46,371 66,284 54,625 69,091 85,598 54,916<br />
US 63,751 56,394 33,468 44,565 29,885 41,865 28,194 22,743 24,295 14,065 35,923<br />
Gambia - - - 45 - - - 17,578 25,818 25,818 17,315<br />
India 257 6,439 2,226 3,071 4,227 8,830 6,386 14,504 20,333 44,657 11,093<br />
Israel 7,853 11,111 10,933 9,861 9,681 8,493 9,951 8,314 7,448 8,000 9,165<br />
South <strong>Africa</strong> 97 200 5,111 7,774 7,374 7,666 6,757 8,592 10,666 17,189 7,143<br />
Netherlands 5,514 17,053 11,856 7,211 4,150 3,061 1,430 1,506 1,255 458 5,349<br />
Brazil 3,618 3,331 3,553 2,569 1,180 241 882 2,619 645 1,546 2,018<br />
Source: FAOSTAT.<br />
71
Table 14. Exports by the top twelve countries <strong>for</strong> shelled groundnut, 1992–2001 (quantities <strong>in</strong> MT).<br />
72<br />
Year<br />
Average<br />
1992 1993 1994 1995 1996 1997 1998 1999 2000 2001 per year<br />
World 957,023 1,041,670 1,164,072 1,282,840 1,198,298 1,122,828 1,019,945 1,029,636 1,167,786 1,078,148 1,106,225<br />
Ch<strong>in</strong>a 270,266 277,308 413,191 351,983 300,583 125,103 148,577 286,419 330,881 407,856 291,217<br />
USA 291,466 191,760 140,226 246,815 180,817 197,806 155,497 160,928 211,604 125,670 190,259<br />
Argent<strong>in</strong>a 134,479 119,314 104,432 165,097 197,967 179,224 300,148 208,910 212,402 159,717 178,169<br />
India 4,086 86,843 48,897 115,837 144,399 236,300 51,877 143,605 116,732 68,156 101,673<br />
Vietnam 62,824 105,000 119,200 115,000 127,000 86,428 87,000 55,500 76,200 78,163 91,232<br />
Netherlands 57,486 100,879 146,742 108,820 81,499 90,739 70,813 54,660 52,870 43,303 80,781<br />
South <strong>Africa</strong> 15,719 20,900 44,493 19,073 27,774 43,657 21,227 13,536 17,873 23,603 24,786<br />
Nicaragua 2,789 5,403 13,532 19,974 19,034 22,088 15,198 12,801 44,797 41,410 19,703<br />
Gambia 9,263 20,000 17,600 28,414 23,000 28,414 28,400 0 0 24,000 17,909<br />
S<strong>in</strong>gapore 24,301 22,637 26,857 19,939 19,068 13,759 13,685 10,672 4,496 2,935 15,835<br />
Ch<strong>in</strong>a, Hong<br />
Kong SAR 24,232 23,808 12,075 7,973 1,884 2,492 4,692 9,790 696 154 8,780<br />
France 12,496 9,960 12,702 18,755 8,422 4,448 2,205 1,881 1,543 2,845 7,526<br />
Senegal 11,912 2,808 6,549 6,617 20,000 5,723 5,290 7,415 2,794 2,786 7,189<br />
Source: FAOSTAT.
Table 15. A 10-year profile of European imports of groundnut <strong>in</strong>-shell, 1992-2001 (quantities <strong>in</strong> MT).<br />
Year<br />
1992 1993 1994 1995 1996 1997 1998 1999 2000 2001<br />
Europe 97,374 99,225 118,262 142,558 98,013 107,256 107,919 94,174 103,905 107,565<br />
Albania - - - - 146 51 201 66 10 1<br />
Austria 2,322 2,453 2,437 936 1,901 930 2,390 2,249 1,695 1,290<br />
Belarus - - - - - - 62 48 292 253<br />
Belgium-<br />
Luxembourg 764 1,550 1,112 38,949 894 1,775 3,261 3,861 - -<br />
Belgium - - - - - - - - 2,906 3,482<br />
Bulgaria 7 248 31 290 35 372 536 - - -<br />
Croatia 4 48 352 452 276 256 307 269 352 460<br />
Czech Republic 1,476 1,186 2,264 1,799 1,550 981 833 1,319 1,232<br />
Denmark 58 14 110 99 259 519 159 197 510 448<br />
Estonia - 18 112 40 164 77 265 281 295 135<br />
F<strong>in</strong>land 530 5 64 1 53 34 91 397 70 37<br />
France 6,154 5,674 5,493 4,782 3,303 5,019 4,302 4,888 4,941 7,738<br />
Germany 21,707 20,425 20,447 13,433 14,321 19,265 18,560 16,605 14,946 10,614<br />
Greece 585 835 1,586 1,327 1,377 1,806 1,360 1,125 1,021 1,242<br />
Hungary 2,133 2,752 3,399 4,373 2,711 2,432 2,259 2,018 2,182 1,936<br />
Iceland 5 3 2 1 3 - 1 1 0 -<br />
Ireland 244 209 86 157 31 123 87 124 78 183<br />
Italy 15,526 15,662 19,999 22,336 18,331 19,608 20,814 16,959 20,027 21,094<br />
Latvia - 2 6 171 24 205 118 251 238 114<br />
Lithuania - - 141 78 120 107 30 58 9 69<br />
Luxembourg - - - - - - - 369 2,779 2,215<br />
Cont<strong>in</strong>ued<br />
73
Cont<strong>in</strong>ued from previous page<br />
74<br />
Year<br />
1992 1993 1994 1995 1996 1997 1998 1999 2000 2001<br />
Macedonia,<br />
The Fmr Yug Rp - 40 35 467 42 - - 339 720 2,000<br />
Malta 364 238 267 486 262 230 287 - 201 324<br />
Moldova,<br />
Republic of - - 55 1 - 90 78 - 0 42<br />
Netherlands 13,849 12,361 17,392 13,278 12,066 8,696 10,940 12,346 8,597 6,979<br />
Norway 70 64 248 236 163 265 221 146 128 278<br />
Poland 5,115 5,876 4,806 5,893 6,468 7,013 5,092 3,860 3,993 4,466<br />
Portugal 6,492 4,827 6,137 3,318 4,476 4,541 5,444 2,621 4,066 4,586<br />
Romania 174 429 712 4,436 877 582 1,804 459 839 1,733<br />
Russian<br />
Federation 368 523 - - 2,405 4,275 1,653 1,757 792 2,340<br />
Serbia and<br />
Montenegro 164 - - - 107 98 105 105 49 34<br />
Slovakia - 792 607 751 1,321 1,239 1,548 1,508 2,361 2,361<br />
Slovenia 191 418 140 103 132 95 110 5 1,892 125<br />
Spa<strong>in</strong> 13,558 14,089 20,604 15,752 15,856 16,975 15,605 11,935 14,338 13,102<br />
Sweden 43 41 48 69 87 73 160 131 86 78<br />
Switzerland 4,029 3,467 4,339 3,767 2,702 3,696 2,818 3,487 2,372 2,213<br />
Ukra<strong>in</strong>e - - 100 46 86 98 103 98 546 1,759<br />
United K<strong>in</strong>gdom 2,918 4,686 6,209 4,266 5,215 5,161 6,167 4,778 9,255 12,602<br />
Source: FAOSTAT.
Table 16. A 10-year profile of European imports of shelled groundnut, 1992–2001 (quantities <strong>in</strong> MT).<br />
Year<br />
1992 1993 1994 1995 1996 1997 1998 1999 2000 2001<br />
Europe 503,662 472,919 601,371 570,196 583,575 614,204 623,635 534,868 576,745 638,699<br />
Albania - - - - 145 169 199 264 202 1<br />
Austria 3,537 3,222 3,309 1,251 1,034 910 858 774 1,015 803<br />
Belarus - - - - - - 938 1,125 2,000 1,542<br />
Belgium - - - - - - - - 4,848 6,148<br />
Belgium-Luxembourg 3,551 3,402 4,082 8,957 5,017 5,052 6,105 4,782 - -<br />
Bosnia and Herzegov<strong>in</strong>a 65 90 35 40 230 100 155 320 80 150<br />
Bulgaria 22 1,118 225 1,366 494 1,653 4,760 3,000 1,800 1,800<br />
Croatia 711 595 638 711 750 293 462 1,123 1,140 914<br />
Czechoslovakia 4,763 - - - - - - - - -<br />
Czech Republic - 3,656 3,070 2,739 14,906 16,763 14,397 9,500 10,952 10,528<br />
Denmark 1,734 2,937 2,746 2,939 3,042 3,304 3,314 1,514 1,908 3,875<br />
Estonia - 33 42 47 220 233 200 304 1,172 579<br />
F<strong>in</strong>land 1,350 1,635 2,495 1,784 2,035 1,814 2,315 2,066 2,415 2,004<br />
France 67,889 27,989 52,910 66,097 50,000 32,714 53,013 25,466 25,702 22,691<br />
Germany 81,766 85,826 77,851 64,281 67,581 83,205 78,827 80,373 92,616 57,803<br />
Greece 8,643 8,635 10,803 13,885 14,633 13,837 13,935 12,565 12,936 12,602<br />
Hungary 2,582 1,544 1,896 2,336 2,729 3,718 4,607 4,912 5,645 5,509<br />
Iceland 8 7 13 7 7 5 6 5 5 5<br />
Ireland 356 680 641 365 405 416 390 478 177 592<br />
Italy 7,026 7,655 9,122 11,581 9,660 14,144 13,517 14,438 16,087 16,183<br />
Latvia - 80 405 386 592 882 1,483 1,312 1,374 1,257<br />
Lithuania - - 682 1,272 2,091 2,759 2,946 2,010 777 2,538<br />
Cont<strong>in</strong>ued<br />
75
Cont<strong>in</strong>ued from previous page<br />
76<br />
Year<br />
1992 1993 1994 1995 1996 1997 1998 1999 2000 2001<br />
Luxembourg - - 1,735 - - - - - 3 1<br />
Macedonia,the Fmr Yug Rp 896 1,541 286 1,658 1,627 1,272 1,272 4,173 3,936 3,485<br />
Malta 285 293 45 255 285 344 324 152 272 246<br />
Moldova, Republic of - - - 260 269 279 248 258 325 543<br />
Netherlands 165,094 180,771 251,263 212,600 194,718 203,333 182,935 140,549 161,296 225,265<br />
Norway 4,335 3,912 3,620 3,747 3,410 3,608 3,523 5,677 3,533 3,824<br />
Poland 3,901 4,538 12,858 13,034 14,210 18,031 19,384 17,684 18,330 19,797<br />
Portugal 2,073 1,827 1,932 1,593 1,868 1,713 1,553 1,302 1,569 1,535<br />
Romania 828 604 939 1,800 4,258 2,583 3,769 2,992 5,313 4,268<br />
Russian Federation 238 1,365 34,074 28,222 33,692 44,636 37,608 46,610 56,479 78,872<br />
Serbia and Montenegro 1,461 315 1,826 2,350 2,967 790 1,803 1,200<br />
Slovakia 972 1,859 2,115 2,564 2,148 2,514 2,595 2,726 2,726<br />
Slovenia 33 14 46 61 126 157 141 270 2,458 80<br />
Spa<strong>in</strong> 14,069 15,449 15,869 19,003 31,301 20,641 21,454 19,212 21,924 25,901<br />
Sweden 3,026 2,456 2,893 2,767 2,481 1,956 2,586 2,241 1,949 2,466<br />
Switzerland 7,915 357 470 526 750 652 1,105 747 1,427 935<br />
Ukra<strong>in</strong>e - 900 1,610 3,700 6,400 10,000 15,550 10,200 14,968 18,136<br />
United K<strong>in</strong>gdom 115,505 108,816 100,907 98,496 108,218 118,530 124,275 113,085 95,582 101,895<br />
Source: FAOSTAT.
Table 17. A 10-year profile of European exports of shelled groundnut, 1992-2001 (quantities <strong>in</strong> MT).<br />
Year<br />
1992 1993 1994 1995 1996 1997 1998 1999 2000 2001<br />
Europe 80,332 118,720 175,395 144,960 102,193 105,340 86,569 68,687 62,662 56,951<br />
Austria 519 365 139 65 58 55 45 22 53 107<br />
Belarus - - - - - - 7 95 19 22<br />
Belgium - - - - - - - - 488 2,350<br />
Belgium-Luxembourg 73 129 462 4,041 1,927 369 1,191 653 - -<br />
Bulgaria - 226 388 154 1,728 134 83 80 40 40<br />
Croatia 61 1 7 27 10 21 14 10 5 6<br />
Czech Republic - 61 141 59 46 470 325 384 752 461<br />
Denmark 32 86 80 62 119 71 51 94 46 39<br />
Estonia - - - - - 74 96 - 191 42<br />
F<strong>in</strong>land 54 15 22 16 8 26 87 57 74 58<br />
France 12,496 9,960 12,702 18,755 8,422 4,448 2,205 1,881 1,543 2,845<br />
Germany 5,078 3,777 8,515 8,877 4,253 4,073 4,701 4,707 2,493 2,154<br />
Greece 48 146 110 1,281 1,437 1,238 2,343 3,206 1,500 1,675<br />
Hungary 785 321 1 23 - - - 81 - -<br />
Ireland 9 - 5 2 - 1 9 - - -<br />
Italy 581 177 764 105 77 104 381 481 6 822<br />
Latvia - - 3 - - 30 62 134 441 47<br />
Lithuania - - 163 307 31 164 98 106 179 250<br />
Macedonia,<br />
the Fmr Yug Rp 7 - - 13 12 - - 18 104 4<br />
Netherlands 57,486 100,879 146,742 108,820 81,499 90,739 70,813 54,660 35 43,303<br />
Norway 79 11 11 17 40 130 43 47 52,870 69<br />
Poland 235 48 131 291 33 175 173 175 157 340<br />
Cont<strong>in</strong>ued<br />
77
Cont<strong>in</strong>ued from previous page<br />
78<br />
Year<br />
1992 1993 1994 1995 1996 1997 1998 1999 2000 2001<br />
Portugal - - - 1 - 1 19 1 211 34<br />
Romania - 4 - - 28 - 3 - 22 22<br />
Russian Federation - - 751 397 513 140 128 12 211 39<br />
Serbia and Montenegro - - - - 50 23 5 20 - -<br />
Slovakia - 45 46 28 24 2 49 254 23 -<br />
Slovenia - 12 - 1 24 59 59 - 48 -<br />
Spa<strong>in</strong> 24 71 28 129 37 93 950 150 291 1,882<br />
Sweden 186 11 43 33 10 34 78 96 202 18<br />
Switzerland - - - - 21 6 99 - 70 6<br />
United K<strong>in</strong>gdom 2,579 2,375 4,141 1,456 1,786 2,660 2,452 1,263 587 316<br />
Source: FAOSTAT.
Table 18. <strong>Africa</strong>n exports of <strong>in</strong>-shell groundnuts, 1992-2001 (quantities <strong>in</strong> MT).<br />
Year<br />
1992 1993 1994 1995 1996 1997 1998 1999 2000 2001<br />
<strong>Africa</strong> 3,965 7,673 12,054 13,357 10,533 24,772 19,666 33,217 46,957 52,579<br />
Botswana - 22 20 - - - - - - 1<br />
Burk<strong>in</strong>a Faso - - - 2 8 41 470 241 1,046 400<br />
Cameroon - 19 16 70 45 1 4 4 1 4<br />
Côte d’Ivoire - - - 10 3 1 11 54 309 309<br />
Egypt 1,431 5,315 3,106 3,440 2,469 3,994 5,616 1,499 2,308 2,725<br />
Gambia - - - 45 - - - 17,578 25,818 25,818<br />
Ghana - - - - 104 46 6 6 968 149<br />
Kenya 5 317 1 5 45 8 8<br />
Libyan Arab Jamahiriya - - - - - - 1,143 1,122 1,286 1,286<br />
Madagascar 25 64 22 156 90 137 103 92 162 94<br />
Malawi - - - 1,000 - - - - - -<br />
Mauritania 3 - - - - - - - - -<br />
Mauritius 1 - - - - - - - - 14<br />
Morocco - 115 - - - - - - - -<br />
Namibia - - - - - - - - 1 -<br />
Niger - - 12 234 366 537 215 1,010 546 357<br />
Nigeria - - - 20 10 10 31 31 44 44<br />
Senegal 1 3 - - - 56 - 6 - 159<br />
South <strong>Africa</strong> 97 200 5,111 7,774 7,374 7,666 6,757 8,592 10,666 17,189<br />
Sudan 500 430 460 - - 11,936 4,129 1,201 2,452 2,452<br />
Swaziland - - - - - 250 45 85 153 108<br />
Tanzania, United Rep of 1,000 - - - - 66 1,025 527 1,108 1,454<br />
Togo - - 12 - - - - 5 - -<br />
Tunisia - 343 2,907 342 - - - - - -<br />
Uganda 84 625 191 139 30 1 36 167 5 -<br />
Zambia 756 50 - - - 30 20 989 77 9<br />
Zimbabwe 62 170 196 121 34 - 10 9 - -<br />
79<br />
Source: FAOSTAT.
Table 19. <strong>Africa</strong>n exports of shelled groundnuts, 1992-2001 (quantities <strong>in</strong> MT).<br />
Year<br />
1992 1993 1994 1995 1996 1997 1998 1999 2000 2001<br />
80<br />
<strong>Africa</strong> 56,549 83,729 101,432 84,455 89,667 129,825 138,603 56,772 73,281 102,015<br />
Botswana 2 - - 15 5 67 21 21 2 1<br />
Burk<strong>in</strong>a Faso 500 400 400 327 400 400 187 978 813 813<br />
Burundi - - - - - - - - 5 5<br />
Cameroon 200 201 31 128 128 431 157 254 1,398 418<br />
Central <strong>Africa</strong>n Republic - - 781 879 191 500 500 500 500 500<br />
Côte d’Ivoire - - - 773 473 3 5 703 837 837<br />
Egypt 2,303 7,044 4,229 6,278 3,088 7,149 9,196 2,917 1,076 1,301<br />
Ethiopia - - - 70 - 80 69 4 30 35<br />
Gambia 9,263 20,000 17,600 28,414 23,000 28,414 28,400 - - 24,000<br />
Ghana - - - - 96 - - 37 230 28<br />
Gu<strong>in</strong>ea-Bissau 436 - 400 60 420 420 430 430 430 430<br />
Kenya 116 232 246 101 68 26 250 444 157 157<br />
Libyan Arab Jamahiriya 1,200 7,600 4,400 5,220 4,500 8,200 8,200 8,200 21,300 21,300<br />
Madagascar 50 78 147 128 86 503 386 32 377 98<br />
Malawi - - 1,000 111 970 2,628 4,335 1,300 210 825<br />
Mali 5,000 6,300 7,800 7,000 3,200 4,600 3,200 3,800 3,000 3,000<br />
Mauritius 2 - - - - - 13 11 10 24<br />
Morocco 35 160 - - - 18 - - - -<br />
Mozambique 300 300 300 700 300 300 310 300 300 300<br />
Namibia - - - - - - - - - 37<br />
Niger - - - 96 1,248 2,131 4,131 785 1,023 251<br />
Nigeria 100 140 250 201 367 1,074 5,142 96 - -<br />
Senegal 11,912 2,808 6,549 6,617 20,000 5,723 5,290 7,415 2,794 2,786<br />
South <strong>Africa</strong> 15,719 20,900 44,493 19,073 27,774 43,657 21,227 13,536 17,873 23,603<br />
Cont<strong>in</strong>ued
Cont<strong>in</strong>ued from previous page<br />
Year<br />
1992 1993 1994 1995 1996 1997 1998 1999 2000 2001<br />
Sudan 2,650 14,432 6,213 4,642 2,176 14,782 21,224 5,000 10,028 17,250<br />
Swaziland - - - - - 3,056 10,667 7,443 6,854 2,490<br />
Tanzania, United Rep of 6,000 - - 170 510 695 231 848 367 973<br />
Togo - - 6 62 45 44 44 23 196 221<br />
Tunisia - 115 - 118 - - - - 2 -<br />
Uganda - - 224 252 5 11 47 150 10 -<br />
Zambia 28 50 45 57 8 337 460 113 185 332<br />
Zimbabwe 733 2,969 6,318 2,963 609 4,576 14,481 1,433 3,273 -<br />
Source: FAOSTAT.<br />
81
Appendix 2: Sample pricelist, Aldebaran Commodities, Rotterdam<br />
82<br />
Table 20. Sample pricelist.<br />
Quantity (kgs) Price <strong>in</strong> US$ Condition<br />
Goods available on a FOT Rotterdam basis<br />
ARGENTINA<br />
1 Argent<strong>in</strong>e Runner count 40/50, crop 2002 36.000 800,00 Fot Rotterdam<br />
2 Argent<strong>in</strong>e Runner count 40/50, crop 2002, blanched 25.000 960,00 Fot Rotterdam<br />
3 Argent<strong>in</strong>e Runner count 38/42, crop 2002, blanched 18.000 960,00 Fot Rotterdam<br />
BRASILIAN<br />
4 Brasilian Runner count 40/50, crop 2002 36.000 780,00 Fot Rotterdam<br />
5 Brasilian Runner count 40/50, crop 2002, blanched 18.000 940,00 Fot Rotterdam<br />
6 Brasilian Runner count 38/42, crop 2002 36.000 800,00 Fot Rotterdam<br />
7 Brasilian Runner count 38/42, crop 2002, blanched 36.000 960,00 Fot Rotterdam<br />
CHINA<br />
8 Ch<strong>in</strong>ese Virg<strong>in</strong>ia Shandong count 24/28, crop 2002 18.000 800,00 Fot Rotterdam<br />
9 Ch<strong>in</strong>ese Virg<strong>in</strong>ia Shandong count 28/32, crop 2002 18.000 780,00 Fot Rotterdam<br />
10 Ch<strong>in</strong>ese Virg<strong>in</strong>ia Shandong count 38/42, crop 2002 25.000 670,00 Fot Rotterdam<br />
11 Ch<strong>in</strong>ese Hsuji type count 40/50, crop 2001 36.000 765,00 Fot Rotterdam<br />
USA<br />
12 Usa Medium Runner count 40/50, crop 2001 40.000 900,00 Fot Rotterdam<br />
13 Usa Jumbo Runner count 38/42, crop 2001 40.000 950,00 Fot Rotterdam<br />
14 Usa Medium Runner count 40/50, crop 2001, blanched 20.000 1.070,00 Fot Rotterdam<br />
15 Usa Jumbo Runner count 38/42, crop 2001, blanched 40.000 1.125,00 Fot Rotterdam<br />
Cont<strong>in</strong>ued
Appendix 2. Cont<strong>in</strong>ued<br />
Quantity (kgs) Price <strong>in</strong> US$ Condition<br />
SOUTH AFRICA<br />
2001 and 2002 crop sold out<br />
SUDAN<br />
16 Sudanese Ash<strong>for</strong>d count 50/60 p.oz., crop 2000/2001 Sold out Fot Rotterdam<br />
17 Sudanese Ash<strong>for</strong>d count 70/80 p.oz., crop 2000/2001 Sold out Fot Rotterdam<br />
Goods available on a C+F/CIF Rotterdam basis<br />
18 Argent<strong>in</strong>e Runner count 40/50, crop 2002 770,00 December 2002/January 2003<br />
19 Argent<strong>in</strong>e Runner count 40/50, crop 2002, blanched 930,00 December 2002/January 2003<br />
20 Argent<strong>in</strong>e Runner count 38/42, crop 2002 780,00 December 2002/January 2003<br />
21 Argent<strong>in</strong>e Runner count 38/42, crop 2002,Blanched 940,00 December 2002/January 2003<br />
22 Brasilian Runner count 40/50, crop 2002 770,00 December 2002/January 2003<br />
23 Brasilian Runner count 38/42, crop 2002 780,00 December 2002/January 2003<br />
24 Usa Medium Runner count 40/50, crop 2001 900,00 December 2002/January 2003<br />
25 Usa Jumbo Runner count 38/42, crop 2001 Sold out<br />
83
Appendix 3: Current trade and domestic policies on<br />
groundnut trade (2003)<br />
Table 21. Country-wise trade policies.<br />
Country Commodity Description Unit Current<br />
Argent<strong>in</strong>a Peanuts Export tax % of border price 4%<br />
Argent<strong>in</strong>a Peanut meal Export rebate % 3%<br />
Argent<strong>in</strong>a Peanut oil Export rebate % 2%<br />
EU Peanut oil Import tariff % 6%<br />
EU Peanut oil Import subsidy <strong>for</strong> % 10%<br />
oil from Senegal<br />
Ch<strong>in</strong>a Peanut raw Import tariff % 10%<br />
Ch<strong>in</strong>a Peanut processed Import tariff % 30%<br />
Ch<strong>in</strong>a Peanuts Value added tax % 17%<br />
Ch<strong>in</strong>a Peanut meal Tariff % 5%<br />
Ch<strong>in</strong>a Peanut oil Tariff % 10%<br />
Ch<strong>in</strong>a Peanut oil & meal Value added tax % 17%<br />
India Peanuts Tariff % 45%<br />
India Peanut meal Tariff % 45%<br />
India Peanut oil Tariff ref<strong>in</strong>ed oil % 85%<br />
Canada Peanuts Tariff % 0%<br />
Mexico Peanuts Tariff % 0%<br />
Senegal Peanuts Tariff % 5%<br />
Senegal Peanuts Tariff on processed % 20%<br />
Senegal Peanut meal Tariff % 0%<br />
Senegal Peanut oil Tariff ref<strong>in</strong>ed oil % 20%<br />
Nigeria Peanuts Tariff % 0%<br />
Nigeria Peanut meal Tariff % 0%<br />
Nigeria Peanut oil tariff ref<strong>in</strong>ed oil Tariff % 0%<br />
South <strong>Africa</strong> Peanuts Tariff % 0%<br />
South <strong>Africa</strong> Peanuts Tariff processed peanut food % 6%<br />
South <strong>Africa</strong> Peanut meal Tariff % 0%<br />
South <strong>Africa</strong> Peanut oil Tariff ref<strong>in</strong>ed oil % 20%<br />
Malawi Peanuts Tariff % 5%<br />
Malawi Peanuts Tariff processed <strong>for</strong> consumption % 25%<br />
Malawi Peanut meal Tariff % 0%<br />
Malawi Peanut oil Tariff ref<strong>in</strong>ed oil % 20%<br />
Gambia Peanuts Tariff % 0%<br />
Gambia Peanut meal Tariff % 0%<br />
Gambia Peanut oil Tariff ref<strong>in</strong>ed oil % 0%<br />
84<br />
Cont<strong>in</strong>ued
Appendix 3. Cont<strong>in</strong>ued<br />
Country Commodity Description Unit Current<br />
United States Peanuts; Out-of-quota tariffs<br />
United States Peanuts shelled Out-of-quota tariffs 132%<br />
United States Peanuts <strong>in</strong>-shell Out-of-quota tariffs 164%<br />
United States Peanuts Duty-free imports from Mexico 1,000 MT 4.15<br />
United States Peanuts Mexico above-quota tariffs<br />
United States Peanuts shelled $/MT 592<br />
peanuts<br />
(Port price652$/MT)<br />
United States Peanuts <strong>in</strong>-shell $/MT 391<br />
peanuts<br />
(port price284$/MT)<br />
United States Peanuts<br />
GATT Schedule of US Peanut Imports (shelled basis)<br />
United States Peanuts Argent<strong>in</strong>a 1,000 MT 43.9<br />
United States Peanuts Mexico 1,000 MT 4.2<br />
United States Peanuts Others 1,000 MT 9<br />
United States Peanuts Total TRQ 1,000 MT 57.1<br />
United States Peanuts Domestic $/lb 0.2475<br />
target price<br />
United States Peanuts Domestic $/lb 0.234<br />
producer price<br />
at calibration<br />
United States Peanuts Domestic $/lb 0.018<br />
fixed payment<br />
(fully coupled)<br />
United States Peanuts<br />
Domestic loan rate scaled up 1.1 <strong>for</strong> annual average $/lb 0.1775<br />
United States Peanut meal Tariff % 0%<br />
United States Peanut oil Tariff % 0%<br />
Source: Begh<strong>in</strong>, John, Diop, Matthey and Sewadeh. 2003.<br />
85
Appendix 4: US groundnut imports under AGOA, 2002<br />
Table 22. US imports <strong>for</strong> consumption at Customs value <strong>for</strong> HTS8 12022040 (Peanuts<br />
(groundnuts), not roasted or cooked, shelled, subject to add. US note 2 to Ch.12).<br />
2000 2001 2002 2003<br />
Percent<br />
change<br />
US$ ’000 Percent January-July YTD2002-<br />
Source of total US$ ’000 YTD2003<br />
All sources 35,962.8 41,925.1 35,114.5 100.0% 35,114.5 5,301.8 –84.9%<br />
Argent<strong>in</strong>a 30,429.7 37,132.2 29,927.4 85.2% 29,927.4 4,665.0 –84.4%<br />
Nicaragua 3,012.9 2,269.2 4,003.8 11.4% 4,003.8 636.9 –84.1%<br />
South <strong>Africa</strong> 2,363.1 2,485.5 893.9 2.5% 893.9 0.0 –100.0%<br />
The Gambia 0.0 28.2 217.7 0.6% 217.7 0.0 –100.0%<br />
Brazil 0.0 0.0 51.5 0.1% 51.5 0.0 –100.0%<br />
Italy 0.0 0.0 20.1 0.1% 20.1 0.0 –100.0%<br />
Australia 157.1 0.0 0.0 0.0% 0.0 0.0<br />
Zambia 0.0 0.0 0.0 0.0% 0.0 0.0<br />
Saudi Arabia 0.0 0.0 0.0 0.0% 0.0 0.0<br />
Mexico 0.0 0.0 0.0 0.0% 0.0 0.0<br />
Netherlands 0.0 0.0 0.0 0.0% 0.0 0.0<br />
Malawi 0.0 0.0 0.0 0.0% 0.0 0.0<br />
El Salvador 0.0 0.0 0.0 0.0% 0.0 0.0<br />
Ethiopia 0.0 10.0 0.0 0.0% 0.0 0.0<br />
By sources, <strong>in</strong> descend<strong>in</strong>g value of 2002 imports.<br />
86
Appendix 5: Quality aspects of groundnuts <strong>in</strong> trade<br />
From: FAO webpage http://www.fao.org/<strong>in</strong>pho/compend/text/<br />
Ch21sec1_5.htm<br />
Requirements <strong>for</strong> export and quality assurance<br />
Export requirements<br />
The quality attributes def<strong>in</strong>ed <strong>for</strong> groundnut end products vary among the<br />
developed and develop<strong>in</strong>g countries. <strong>Groundnut</strong> is ma<strong>in</strong>ly used <strong>for</strong> mak<strong>in</strong>g<br />
peanut butter and consumed roasted or <strong>in</strong> confectioneries <strong>in</strong> developed<br />
countries. Meanwhile, <strong>in</strong> several develop<strong>in</strong>g countries it is ma<strong>in</strong>ly processed<br />
<strong>for</strong> its oil. Most develop<strong>in</strong>g countries have not given much attention to quality.<br />
They are obliged to meet quality parameters fixed by the importer countries<br />
<strong>for</strong> <strong>in</strong>ternational trade of groundnut kernels and cake. For example, the<br />
general guidel<strong>in</strong>es <strong>for</strong> the quality of groundnut pods and kernels <strong>for</strong>mulated by<br />
the Natural Resources Institute of the United K<strong>in</strong>gdom M<strong>in</strong>istry <strong>for</strong> Overseas<br />
Development are:<br />
• Pod color and type, size, pod texture, cleanl<strong>in</strong>ess, freedom from damage<br />
and absence of bl<strong>in</strong>d nuts <strong>for</strong> <strong>in</strong>-shells and,<br />
Grad<strong>in</strong>g <strong>for</strong> size or count, shape, ease of blanch<strong>in</strong>g, sk<strong>in</strong> color and<br />
conditions; resistance to splitt<strong>in</strong>g, moisture content, cleanl<strong>in</strong>ess, oil content<br />
and flavor <strong>for</strong> kernels.<br />
Quality guidel<strong>in</strong>es specify that the groundnut lots must be free from<br />
aflatox<strong>in</strong> contam<strong>in</strong>ation. This is the most important consideration <strong>for</strong> export<br />
quality today. Aflatox<strong>in</strong>s are the toxic metabolites produced by some stra<strong>in</strong>s of<br />
fungi of the Aspergillus flavus group. Users may demand certa<strong>in</strong> additional<br />
attributes, requirements and salient technical specifications. A large<br />
groundnut-process<strong>in</strong>g factory makes its purchase based upon:<br />
• Size/grade: medium runners graded between 83 mm and 71 mm must have<br />
a count of 155 to 170 kernels per 100 g.<br />
Aflatox<strong>in</strong>: five parts per billion maximum. However, the European Union<br />
has recently modified the aflatox<strong>in</strong> B limit to 2 μg/kg <strong>for</strong> the consumption<br />
1<br />
of groundnuts by human be<strong>in</strong>gs.<br />
Moisture: between 6 to 8 percent. Determ<strong>in</strong>ation is done by air oven by<br />
dry<strong>in</strong>g ground samples at 130°C <strong>for</strong> 2 h)<br />
87
88<br />
Oil quality: the acid value of cold pressed oil from kernels must not exceed<br />
1.5, while the peroxidase value should normally be zero and not exceed 1.0<br />
mille equivalents kg -1 .<br />
Edibility: groundnut must be free from pathogenic organism (eg,<br />
Salmonella, Escherichia coli) and also free from <strong>in</strong>sect <strong>in</strong>festation, live or<br />
dead and viable eggs.<br />
Other conditions: factors such as odor and flavor, splits, damaged kernels<br />
and unshelled groundnuts, <strong>for</strong>eign matter and discoloured/mouldy nuts are<br />
also considered.<br />
Inspection and diversion of aflatox<strong>in</strong> contam<strong>in</strong>ated lots<br />
To ensure that groundnut utilized <strong>for</strong> food or feed conta<strong>in</strong> less than 20 ppb<br />
aflatox<strong>in</strong>, various agencies <strong>in</strong> develop<strong>in</strong>g countries, eg, the Indian Oilseeds and<br />
Produce Exporters Association (IOPEA) <strong>in</strong> India and the <strong>Africa</strong>n <strong>Groundnut</strong><br />
Council (AGC) <strong>in</strong> <strong>Africa</strong>, are regulat<strong>in</strong>g the export quality of groundnuts and<br />
groundnut products.<br />
AGC agreement with the FAO<br />
At the 18 th Session of the FAO Intergovernmental Group on Oilseeds, Oil and<br />
Fats, 20-24 February 1984, <strong>in</strong> Rome, the AGC was part of the delegation,<br />
which discussed the proposed modifications to the EEC Directives regard<strong>in</strong>g<br />
tolerance limits of undesirable substances (especially aflatox<strong>in</strong> B 1 ) <strong>in</strong> cattle<br />
feed. After detailed discussion, the group f<strong>in</strong>ally declared that “all legislative<br />
regulatory measures <strong>in</strong> this field should necessarily be based on data which can<br />
be verified through reliable means, <strong>in</strong> order to prevent any unjust harm to the<br />
concerned parties and to the liberty of <strong>in</strong>ternational standardization of norms<br />
so the Jo<strong>in</strong>t Committee FAO/OMS of the “Codex Alimentarius” could fix<br />
aflatox<strong>in</strong> limits which are <strong>in</strong>ternationally recognized, uni<strong>for</strong>m and reasonable.<br />
Consider<strong>in</strong>g the significance of aflatox<strong>in</strong>s, several countries <strong>in</strong>clud<strong>in</strong>g the FAO<br />
(Codex Alimentarius Committee) have set the tolerance limits <strong>for</strong><br />
groundnuts and its extractions. India and the United States of America have<br />
set 20 μg/kg of seed meant <strong>for</strong> human consumption as tolerance limit. As of<br />
the year 2000, European Union has <strong>for</strong>mulated the follow<strong>in</strong>g limits of<br />
aflatox<strong>in</strong>s <strong>for</strong> various categories of groundnuts (see Table 23).
Table 23. Tolerance limits <strong>for</strong> aflatox<strong>in</strong>s as set by the European Union.<br />
Tolerance limit (μg/kg)<br />
Purpose B 1 B 1 + G 1 + B 2 + G 2<br />
<strong>Groundnut</strong> <strong>for</strong> direct consumption 2 4<br />
<strong>Groundnut</strong> <strong>for</strong> further process<strong>in</strong>g 5 10<br />
Milk and milk products 0.05 -<br />
The key attributes <strong>for</strong> the export of groundnuts are piece count referr<strong>in</strong>g<br />
to the number of seeds per ounce, aflatox<strong>in</strong>s and physical properties such as<br />
brokens and admixtures. The seed size expressed as piece counts is crucial to<br />
determ<strong>in</strong>e commodity value. Until now, there have been no limits <strong>for</strong> the<br />
pesticide residues <strong>in</strong> the seed and cake. The <strong>in</strong>creas<strong>in</strong>g <strong>in</strong>terest <strong>in</strong> healthy<br />
eat<strong>in</strong>g has <strong>in</strong>itiated the concept of organic farm<strong>in</strong>g <strong>in</strong> develop<strong>in</strong>g countries.<br />
<strong>Groundnut</strong>s grown without synthetic pesticides and fertilizers would fetch a<br />
premium.<br />
Aflatox<strong>in</strong> limits fixed by importer countries<br />
Many groundnut-import<strong>in</strong>g countries have placed limits on the levels of<br />
aflatox<strong>in</strong>s permissible <strong>in</strong> groundnuts and groundnut products (Table 24).<br />
Countries depend<strong>in</strong>g on export of aflatox<strong>in</strong>-susceptible commodities eg,<br />
Table 24. Maximum possible levels of aflatox<strong>in</strong> <strong>in</strong> imported groundnut <strong>for</strong> human<br />
consumption and livestock and poultry feeds.<br />
Maximum permissible level (ng g -1 ), 1995<br />
Country Aflatox<strong>in</strong> type Foodstuffs Livestock feed<br />
Belgium B 1 5 20<br />
France B 1 1 20<br />
Germany B 1 2 20<br />
Ireland B 1 5 20<br />
Italy B 1 5 20<br />
The Netherlands B 1 0 20<br />
Sweden B 1 , B 2 , G 1 , G 2 5 10<br />
UK B 1 , B 2 , G 1 , G 2 4 20<br />
USA B 1 , B 2 , G 1 , G 2 20 20<br />
Source: Freeman et al. 1999, ICRISAT.<br />
89
groundnuts are obliged to establish export limits that meet importers’<br />
requirements. This leads to economic loss, if the requirements are<br />
unnecessarily strict. Where a local food is also an export item, exportation of<br />
the most wholesome food may lead to local consumption of more<br />
contam<strong>in</strong>ated foods. In part, this augments the risk of toxic effects <strong>in</strong> the<br />
<strong>in</strong>digenous population.<br />
Consumer preferences<br />
<strong>Groundnut</strong> quality and consumers preference may be judged by the follow<strong>in</strong>g<br />
parameters:<br />
Flavor: The flavor of roasted groundnuts plays important role <strong>in</strong> its acceptance<br />
by consumers and other users. Flavor also plays an important role <strong>in</strong> the<br />
acceptability of groundnut products such as peanut butter. Samples of several<br />
high yield<strong>in</strong>g genotypes showed that their flavor quality needs improvement.<br />
A method of evaluat<strong>in</strong>g the cook<strong>in</strong>g quality of groundnuts by boil<strong>in</strong>g them <strong>in</strong><br />
shell has been standardized at ICRISAT (ICRISAT Report 1990). More than<br />
300 compounds have been detected <strong>in</strong> roasted groundnut. Sugars <strong>in</strong><br />
groundnut also play an important role as precursors <strong>in</strong> the production of the<br />
typical roasted groundnut flavor. Thus it is important to standardize the test<br />
used to evaluate the acceptability of roasted groundnut by conduct<strong>in</strong>g sensory<br />
evaluation and relat<strong>in</strong>g the f<strong>in</strong>d<strong>in</strong>gs to the presence or absence of various<br />
volatile compounds and the concentrations <strong>in</strong> which they are present. Studies<br />
<strong>in</strong>dicate that hexanal concentration is one of the eight compounds that gives<br />
an objectionable flavor to groundnut and correlated with a professional flavor<br />
profile panelists’ evaluation. Characterization of flavor compound by gas<br />
chromatography would enable breeders to identify those cultivars that have a<br />
good flavor profile <strong>for</strong> further development (Ahmed and Young 1982).<br />
Texture: Crunchy and crisp are textural attributes that are important and<br />
desirable sensory qualities of groundnuts. Crisp food is one that is firm (stiff)<br />
and snaps easily when de<strong>for</strong>med emitt<strong>in</strong>g a crunchy/crackly sound. Based on<br />
consumer study, crispness has been reported to be the most versatile s<strong>in</strong>gle<br />
texture parameter. A number of <strong>in</strong>struments have been developed <strong>for</strong><br />
measur<strong>in</strong>g mechanical properties of nuts, which can be related to texture of<br />
the kernels.<br />
Sensory quality: Mechanical <strong>for</strong>ce and work usually have strong <strong>in</strong>verse<br />
correlation with sensory crispness and crunch<strong>in</strong>ess scores. Sensory evaluation<br />
of texture <strong>in</strong> foods belongs to the doma<strong>in</strong> of psychology known as<br />
90
psychophysics. Psychophysics directly concerns the correlation of sensory<br />
experience with physical measures. Two measures of classification of sensory<br />
tests are: i) affective and ii) analytical. Affective tests are used to evaluate<br />
preference and/or acceptance of products. This method, however, cannot<br />
provide a proportional relationship between sensory scores and physical<br />
measures. Analytical tests are used <strong>for</strong> quantification of sensory<br />
characteristics. Evaluat<strong>in</strong>g the textural quality of groundnuts, a sensory<br />
panelist can either bite or chew those groundnut kernels. The physical<br />
property differences between row, blanched and oil roasted groundnuts was<br />
dist<strong>in</strong>guished best by a compression test (Vivar and Brennan 1980). When<br />
groundnuts are exposed to high relative humidity environment they absorb<br />
moisture and become soggy, and consumers do not prefer such products.<br />
Color: The color of raw groundnut kernels is attributed to both the testa and<br />
the oil. Tann<strong>in</strong>s and catechol-type compounds are responsible <strong>for</strong> impart<strong>in</strong>g<br />
the color to the testa. The color of cotyledons is due primarily to the oil color<br />
present <strong>in</strong> the cells of the cotyledons. The measure carotenoid pigments<br />
present <strong>in</strong> oil are β-carotene and lute<strong>in</strong>. Maximum concentration of these<br />
pigments occurs <strong>in</strong> the immature kernels ie, 60 μg of β-carotene and 138 μg of<br />
lute<strong>in</strong> per litre of oil and dim<strong>in</strong>ishes as the groundnut advances to maturity.<br />
Consumer preference is <strong>for</strong> light colored groundnut oil. The characteristic<br />
color of roasted groundnut is due primarily to the sugar-am<strong>in</strong>o acid reactions<br />
with subsequent production of melan<strong>in</strong>s. Caramelization of sugars may<br />
contribute to brown coloration of roasted groundnut. Consumers reject soft or<br />
mushy roasted groundnuts even though they exhibit attractive color and good<br />
flavor (Hodge 1953).<br />
Indian groundnut is very popular <strong>in</strong> the <strong>in</strong>ternational market <strong>for</strong> the table<br />
purpose, due to its characteristic natural flavor, nutty taste and crunchy<br />
texture and also has relatively longer shelf life. There<strong>for</strong>e, with the grow<strong>in</strong>g<br />
consumer taste the world over <strong>for</strong> organic food with natural flavor, Indian<br />
groundnut has better export opportunity. Consumption of groundnuts as nuts<br />
and <strong>in</strong> the manufacture of peanut butter is based on the use of roasted<br />
groundnut kernels. Roast<strong>in</strong>g time has a significant <strong>in</strong>fluence on the strength of<br />
the odor and flavor. Raw and roasted groundnuts should be free of <strong>for</strong>eign<br />
material, unadulterated with toxic or noxious substances such as pesticides<br />
and microorganisms. The Food and Drug Adm<strong>in</strong>istration (1969) issued<br />
guidel<strong>in</strong>es <strong>for</strong> food manufacturers who produce wholesome food items<br />
<strong>in</strong>clud<strong>in</strong>g groundnuts and groundnut products. The “Official Methods of<br />
AOAC” gives methods (36.020 to 36.024) <strong>for</strong> the determ<strong>in</strong>ation of<br />
adulterants <strong>in</strong> food.<br />
91
Appendix 6: Aflatox<strong>in</strong> <strong>in</strong> groundnuts<br />
Aflatox<strong>in</strong>s are toxic, carc<strong>in</strong>ogenic, teratogenic and immunosuppressive<br />
substances produced when toxigenic stra<strong>in</strong>s of the fungi Aspergillus flavus<br />
L<strong>in</strong>k. ex Fries and A. parasiticus Speare grow on groundnuts, maize, cotton,<br />
chili and many other agricultural commodities. Blood tests have shown that<br />
very high percentages of the populations of several countries <strong>in</strong> Asia and <strong>Africa</strong><br />
have been exposed to aflatox<strong>in</strong>s. Maize and groundnuts are important <strong>in</strong> the<br />
diet of peoples both <strong>in</strong> Asia and <strong>Africa</strong> and are likely to be the ma<strong>in</strong> sources of<br />
these tox<strong>in</strong>s. Aflatox<strong>in</strong>s B 1 and G 1 are the <strong>for</strong>ms most commonly produced <strong>in</strong><br />
groundnut. They are highly toxic among livestock and are be<strong>in</strong>g implicated <strong>in</strong><br />
human diseases. Aflatox<strong>in</strong> M 1 (AFM1) is a major metabolite of Aflatox<strong>in</strong> B 1<br />
found <strong>in</strong> the milk of animals that have consumed contam<strong>in</strong>ated feed with<br />
aflatox<strong>in</strong> B 1 (Polan et al. 1974) . The relatively high levels of primary hepatocellular<br />
carc<strong>in</strong>oma may reflect <strong>in</strong>teractions between hepatitis B and C (which<br />
are related to prote<strong>in</strong> deficiency <strong>in</strong> children) and aflatox<strong>in</strong>. It is not surpris<strong>in</strong>g<br />
that aflatox<strong>in</strong> contam<strong>in</strong>ation is the most important quality problem <strong>in</strong> many<br />
commodities worldwide.<br />
Infection of groundnut by Aspergillus occurs under both preharvest and<br />
postharvest conditions. Preharvest <strong>in</strong>fection by A. flavus and consequent<br />
aflatox<strong>in</strong> contam<strong>in</strong>ation is more important <strong>in</strong> the semi-arid tropics, especially<br />
when end-of-season drought occurs. (Waliyar et al. 1994). There is also<br />
evidence that damage to groundnut by soil pests such as termite <strong>in</strong>crease<br />
aflatox<strong>in</strong> contam<strong>in</strong>ation. Postharvest conditions are also important. Favorable<br />
conditions <strong>for</strong> <strong>in</strong>fection dur<strong>in</strong>g harvest<strong>in</strong>g and storage may lead to rapid<br />
development of the fungi and higher production of the tox<strong>in</strong> (Mehan et al.<br />
1991). Studies <strong>in</strong> <strong>Africa</strong> have shown that groundnut is often stored <strong>in</strong> the <strong>for</strong>m<br />
of pods where <strong>in</strong>sects can easily damage the pods and facilitate penetration of<br />
the fungi.<br />
Aflatox<strong>in</strong> limits<br />
Many import<strong>in</strong>g countries have placed limits on the levels of aflatox<strong>in</strong>s<br />
permissible <strong>in</strong> groundnut and groundnut products. A few countries <strong>in</strong>clud<strong>in</strong>g<br />
Cuba, Malaysia and Portugal have a zero tolerance limit. The European Union<br />
have set a limit of 2 μg/kg of B 1 and total aflatox<strong>in</strong>s 4 μg/kg, while most of the<br />
other countries have set practical limit of 10 to 30 μg/kg, <strong>in</strong>clud<strong>in</strong>g Australia<br />
(15 μg/kg), Canada (15 μg/kg), India (30 μg/kg) and USA (20 μg/kg).<br />
92
Accord<strong>in</strong>g to the US Food and Drug Adm<strong>in</strong>istration, the level of<br />
aflatox<strong>in</strong> M 1 <strong>in</strong> milk should not exceed 0.5 μg/kg but the level is set at 0.05 μg/<br />
kg <strong>in</strong> most of the European countries and Codex Alimentarius. In Austria and<br />
Switzerland, the maximum level is reduced to 0.01 μg/kg <strong>for</strong> <strong>in</strong>fant food.<br />
Thus the differences <strong>in</strong> tolerance levels among countries and many have no<br />
legal limit <strong>for</strong> aflatox<strong>in</strong> M 1 <strong>in</strong> milk and dairy products.<br />
References<br />
Waliyar F, Ba A, Hamma Hassan, Bonkoungou S and Bosc JP. 1994. Sources of<br />
resistance to Aspergillus flavus and aflatox<strong>in</strong> contam<strong>in</strong>ation <strong>in</strong> groundnut genotypes <strong>in</strong><br />
<strong>West</strong> <strong>Africa</strong>. JA No 1366. Plant disease 78, 7:704-708.<br />
Waliyar F, Reddy SV, Subramanyam K, Reddy TY, Ramadevi K, Craufurd PQ and<br />
Wheeler TR. 2003. Importance of mycotox<strong>in</strong>s <strong>in</strong> food and feed <strong>in</strong> India. Aspects of<br />
Applied Biology 68:147-154.<br />
93
Appendix 7: World Health Organization on<br />
Mycotox<strong>in</strong>s<br />
From: http://www.<strong>in</strong>chem.org/documents/ehc/ehc/ehc011.htm<br />
Environmental Health Criteria 11: Mycotox<strong>in</strong>s<br />
International Programme on Chemical Safety<br />
Published under the jo<strong>in</strong>t sponsorship of the United Nations Environment<br />
Programme and the World Health Organization<br />
Mycotox<strong>in</strong>s<br />
Sources and occurrence<br />
Aflatox<strong>in</strong>s are produced by certa<strong>in</strong> stra<strong>in</strong>s of Aspergillus flavus and Aspergillus<br />
parasiticus. These fungi are ubiquitous and the potential <strong>for</strong> contam<strong>in</strong>ation of<br />
foodstuffs and animal feeds is widespread. The occurrence and magnitude of<br />
aflatox<strong>in</strong> contam<strong>in</strong>ation varies with geographical and seasonal factors, and also<br />
with the conditions under which a crop is grown, harvested and stored. Crops<br />
<strong>in</strong> tropical and subtropical areas are more subject to contam<strong>in</strong>ation than those<br />
<strong>in</strong> temperate regions, s<strong>in</strong>ce optimal conditions <strong>for</strong> tox<strong>in</strong> <strong>for</strong>mation are<br />
prevalent <strong>in</strong> areas with high humidity and temperature. Tox<strong>in</strong>-produc<strong>in</strong>g fungi<br />
can <strong>in</strong>fect grow<strong>in</strong>g crops as a consequence of <strong>in</strong>sect or other damage, and may<br />
produce tox<strong>in</strong>s prior to harvest, or dur<strong>in</strong>g harvest<strong>in</strong>g and storage.<br />
The chemical structures of aflatox<strong>in</strong>s have been elucidated, and<br />
analytical techniques are available <strong>for</strong> their identification and determ<strong>in</strong>ation <strong>in</strong><br />
foodstuffs and body tissues at the μg/kg level and lower. Four aflatox<strong>in</strong>s (B1 ,<br />
G1 , B2 , G2 , often occurr<strong>in</strong>g simultaneously, have been detected <strong>in</strong> foods of<br />
plant orig<strong>in</strong> <strong>in</strong>clud<strong>in</strong>g maize, groundnuts (peanuts), and tree nuts as well as<br />
many other foodstuffs and feeds.<br />
In animals, <strong>in</strong>gested aflatox<strong>in</strong>s may be metabolically degraded. Aflatox<strong>in</strong><br />
B1 may be converted <strong>in</strong>to aflatox<strong>in</strong> M1 which may occur <strong>in</strong> milk. The<br />
concentration of aflatox<strong>in</strong> M1 <strong>in</strong> the milk of cows is about 300 times lower<br />
than the concentration of aflatox<strong>in</strong> B1 consumed <strong>in</strong> the feed. In certa<strong>in</strong><br />
experimental animals, only small amounts of adm<strong>in</strong>istered aflatox<strong>in</strong>s have<br />
been found <strong>in</strong> tissues, 24 h after <strong>in</strong>jection.<br />
In studies on pigs, aflatox<strong>in</strong> residues were detected <strong>in</strong> the liver, kidney,<br />
and muscle tissues after be<strong>in</strong>g given aflatox<strong>in</strong>s <strong>in</strong> the feed <strong>for</strong> several months.<br />
94
There do not appear to be any published works on aflatox<strong>in</strong> residues <strong>in</strong> the<br />
tissues of slaughtered animals.<br />
The use of resistant varieties of seed and of pesticides, and careful dry<strong>in</strong>g<br />
and stor<strong>in</strong>g procedures can reduce fungal <strong>in</strong>festation and thus dim<strong>in</strong>ish food<br />
contam<strong>in</strong>ation by aflatox<strong>in</strong>s. The tox<strong>in</strong> is not elim<strong>in</strong>ated from foodstuffs or<br />
animal feeds by ord<strong>in</strong>ary cook<strong>in</strong>g or process<strong>in</strong>g practices and, s<strong>in</strong>ce pre- and<br />
postharvest procedures do not ensure total protection from aflatox<strong>in</strong><br />
contam<strong>in</strong>ation, techniques <strong>for</strong> decontam<strong>in</strong>ation have been developed. The<br />
tox<strong>in</strong> is generally concentrated <strong>in</strong> a small proportion of seeds that are often<br />
different <strong>in</strong> color.<br />
Segregation of discolored seeds by sort<strong>in</strong>g can significantly reduce the<br />
aflatox<strong>in</strong> levels <strong>in</strong> some crops, such as groundnuts. Visual <strong>in</strong>spection <strong>for</strong> mold<br />
growth be<strong>for</strong>e process<strong>in</strong>g can serve as an <strong>in</strong>itial screen<strong>in</strong>g technique but tox<strong>in</strong>produc<strong>in</strong>g<br />
fungi can be present without detectable aflatox<strong>in</strong>s and vice versa.<br />
Because aflatox<strong>in</strong> distribution <strong>in</strong> a contam<strong>in</strong>ated, unprocessed commodity is<br />
uneven, adequate sampl<strong>in</strong>g is essential <strong>for</strong> effective monitor<strong>in</strong>g. As aflatox<strong>in</strong>s<br />
can be chemically degraded <strong>in</strong> vitro by several oxidiz<strong>in</strong>g agents and alkalis,<br />
hydrogen peroxide and ammonia are currently used <strong>for</strong> the chemical<br />
decontam<strong>in</strong>ation of animal feeds.<br />
Effects and associated exposures<br />
Outbreaks of aflatoxicosis <strong>in</strong> farm animals have been reported from many<br />
areas of the world. The liver is ma<strong>in</strong>ly affected <strong>in</strong> such outbreaks and also <strong>in</strong><br />
experimental studies on animals, <strong>in</strong>clud<strong>in</strong>g nonhuman primates. The acute<br />
liver lesions are characterized by necrosis of the hepatocytes and biliary<br />
proliferation, and chronic manifestations may <strong>in</strong>clude fibrosis. A feed level of<br />
aflatox<strong>in</strong> as low as 300 μg/kg can <strong>in</strong>duce chronic aflatoxicosis <strong>in</strong> pigs with<strong>in</strong><br />
3-4 months.<br />
Aflatox<strong>in</strong> B1 is a liver carc<strong>in</strong>ogen <strong>in</strong> at least eight species <strong>in</strong>clud<strong>in</strong>g<br />
nonhuman primates. Dose-response relationships have been established <strong>in</strong><br />
studies on rats and ra<strong>in</strong>bow trout, with a 10% tumor <strong>in</strong>cidence estimated to<br />
occur at feed levels of aflatox<strong>in</strong> B1 of 1 μg/kg, and 0.1 μg/kg, respectively. In<br />
some studies, carc<strong>in</strong>omas of the colon and kidney have been observed <strong>in</strong> rats<br />
treated with aflatox<strong>in</strong>s. Aflatox<strong>in</strong> B1 causes chromosomal aberrations and<br />
DNA breakage <strong>in</strong> plant and animal cells, and, after microsomal activation,<br />
gene mutations <strong>in</strong> several bacterial test systems. In high doses, it may be<br />
teratogenic.The acute toxicity and carc<strong>in</strong>ogenicity of aflatox<strong>in</strong>s are greater <strong>in</strong><br />
male than <strong>in</strong> female rats; hormonal <strong>in</strong>volvement may be responsible <strong>for</strong> this<br />
95
sex-l<strong>in</strong>ked difference. Nutritional status <strong>in</strong> animals, particularly with respect<br />
to lipotropes, prote<strong>in</strong>s, vitam<strong>in</strong> A, and lipids (<strong>in</strong>clud<strong>in</strong>g cyclopropenoid fatty<br />
acids), can modify the expression of acute toxicity or carc<strong>in</strong>ogenicity or both.<br />
There is little <strong>in</strong><strong>for</strong>mation on the association of acute hepatoxicity <strong>in</strong> man<br />
with exposure to aflatox<strong>in</strong>s but cases of acute liver damage have been<br />
encountered that could possibly be attributed to acute aflatoxicosis. A recent<br />
outbreak of acute hepatitis <strong>in</strong> adjacent districts of two neighbor<strong>in</strong>g states <strong>in</strong><br />
north-west India, which affected several hundred people, was apparently<br />
associated with the <strong>in</strong>gestion of heavily contam<strong>in</strong>ated maize, some samples of<br />
which conta<strong>in</strong>ed aflatox<strong>in</strong> levels <strong>in</strong> the mg/kg range, the highest reported level<br />
be<strong>in</strong>g 15 mg/kg.<br />
Liver cancer is more common <strong>in</strong> some regions of <strong>Africa</strong> and south eastern<br />
Asia than <strong>in</strong> other parts of the world and, when local epidemiological<br />
<strong>in</strong><strong>for</strong>mation is considered together with experimental animal data, it appears<br />
that <strong>in</strong>creased exposure to aflatox<strong>in</strong>s may <strong>in</strong>crease the risk of primary liver<br />
cancer. Pooled data from Kenya, Mozambique, Swaziland, and Thailand, show<br />
a positive correlation between daily dietary aflatox<strong>in</strong> <strong>in</strong>take (<strong>in</strong> the range of<br />
3.5 to 222.4 ng/kg body weight per day) and the crude <strong>in</strong>cidence rate of<br />
primary liver cancer (rang<strong>in</strong>g from 1.2 to 13.0 cases per 100 000 people per<br />
year). There is also some evidence of a vital <strong>in</strong>volvement <strong>in</strong> the etiology of the<br />
disease.<br />
In view of the evidence concern<strong>in</strong>g the effects, particularly the<br />
carc<strong>in</strong>ogenic effects, of aflatox<strong>in</strong>s <strong>in</strong> several animal species, and <strong>in</strong> view of the<br />
association between aflatox<strong>in</strong> exposure levels and human liver cancer<br />
<strong>in</strong>cidence observed <strong>in</strong> some parts of the world, exposure to aflatox<strong>in</strong>s should<br />
be kept as low as practically achievable. The tolerance levels <strong>for</strong> food products<br />
established <strong>in</strong> several countries should be understood as management tools<br />
<strong>in</strong>tended to facilitate the implementation of aflatox<strong>in</strong> control programs, and<br />
not as exposure limits that necessarily ensure health protection.<br />
96
Appendix 8: European buyers and brokers of<br />
groundnut<br />
The United K<strong>in</strong>gdom<br />
Abacus Trad<strong>in</strong>g Co. Ltd<br />
International trader <strong>in</strong> peanuts<br />
1278 High Road, Whetstone<br />
London N20 9HH<br />
Tel: +44 (0)20 8343 9900<br />
Fax: +44(0)20 8343 9227<br />
Email: abacus@nuts.netkonect.co.uk<br />
Afrika Produkte (UK) Ltd<br />
Broker of edible nuts, seeds and<br />
pulses<br />
12/14 Moor Lane, Crosby<br />
Liverpool L23 2UE<br />
Tel: +44 (0)151 9313221<br />
Fax: +44 (0)151 9315491<br />
Email: afrikapr@bt<strong>in</strong>ternet.com<br />
Barrow Lane & Ballard Ltd<br />
International distributors of peanuts,<br />
tree nuts and dates<br />
(bulk packed/processed)<br />
52/54 Southwark Street<br />
London SE1 1UN<br />
Tel: +44 (0) 20 7357 8775<br />
Fax: +44 (0) 20 7357 8905<br />
Email: blb@barrow-lane.co.uk<br />
Birdsong Peanuts<br />
Peanut sheller<br />
P O Box 1400, 612 Madison Avenue<br />
Suffolk, Virg<strong>in</strong>ia 23434 USA<br />
Tel: +1 (804) 5393456<br />
Fax: +1 (804) 5397360<br />
Email: <strong>in</strong>fo@birdsong-peanuts.com<br />
Bond Commodities Ltd<br />
Import range of edible nuts <strong>for</strong><br />
further manufacture<br />
New Loom House, 101 Back<br />
Church Lane<br />
London E1 1LU<br />
Tel: +44(0)20 7488 1949<br />
Fax: +44(0)20 7488 1953<br />
Email: <strong>in</strong>fo@bondcommodities.<br />
demon.co.uk<br />
Canon Garth Limited<br />
Traders of edible nuts<br />
Alexander House<br />
31-39 London Road<br />
Sevenoaks, Kent TN13 1JY<br />
Tel: +44 (0)1732 743434<br />
Fax: +44 (0)1732 743444<br />
Email: cgl@ctcs.demon.co.uk<br />
Carrex International Ltd<br />
Import/export of edible nuts and<br />
dried fruit<br />
Hasl<strong>in</strong>gton Hall, Hasl<strong>in</strong>gton<br />
Crewe, Cheshire CW1 5RX<br />
Tel: +44 (0)1270 588722<br />
Fax: +44 (0)1270 255050<br />
Email: <strong>in</strong>fo@carrex<strong>in</strong>t.co.uk<br />
Website: www.carrex<strong>in</strong>t.co.uk<br />
97
CJ Wildbird Foods Ltd<br />
Manufacturers of wildbird food<br />
The Rea, Upton Magna<br />
NR. Shrewsbury<br />
Shropshire SY4 4UB<br />
Tel: +44 (0)1743 709545<br />
Fax: +44 (0)1743 709504<br />
Email: <strong>in</strong>fo@birdfood.co.uk<br />
Website: www.birdfood.co.uk<br />
Community Foods Ltd<br />
Micross, Brent Terrace<br />
London NW2 1LT<br />
Tel: +44 (0)20 84509411<br />
Fax: +44 (0)20 82081803<br />
Demos Ciclitira Ltd<br />
International traders <strong>in</strong> peanuts<br />
and nuts<br />
Capitol House, 60-62 Leman Street<br />
London E1 8EU<br />
Tel: +44 (0)20 7626 1121<br />
Fax: +44 (0)20 7702 0560<br />
F Duerr & Sons Ltd<br />
Peanut butter manufacturer<br />
Prestage Street, Old Traf<strong>for</strong>d<br />
Manchester M16 9LH<br />
Tel: +44 (0)1612 262251<br />
Fax: +44 (0)1612 263058<br />
Email: <strong>in</strong>fo@duerrs.co.uk<br />
Website: www.duerrs.co.uk<br />
Greenangle Ltd<br />
Importation and distribution of nuts<br />
L<strong>in</strong>ton House, 164-180 Union<br />
Street<br />
London SE1 0LH<br />
Tel: +44 (0)20 7928 2428<br />
Fax: +44 (0)20 7928 9997<br />
Email: greenangle@mail.com<br />
98<br />
Imperial Snack Foods Ltd<br />
Eastern flavor flavored snack<br />
food products<br />
Unit 5, Culwell Trad<strong>in</strong>g Estate,<br />
Woden Rd. Wolverhampton<br />
<strong>West</strong> Midlands W10 0PG<br />
Tel: +44 (0)1902 351104<br />
Fax: +44 (0)1902 351375<br />
Email: impsnacks@aol.com<br />
Website:<br />
www.imperialsnackfoods.co.uk<br />
J & J B Traders Ltd<br />
Commodity trader<br />
Hamilton House, 1 Temple Avenue,<br />
Victoria Embankment<br />
London EC4Y 0HA<br />
Tel: +44 (0)20 73532123<br />
Fax: +44 (0)20 75838823<br />
Email: jjbtl@bt<strong>in</strong>ternet.com<br />
Richard Kettlewell<br />
Broker <strong>in</strong> groundnut and Consultant<br />
on groundnut trade<br />
Email: RGWK@aol.com<br />
Markbeech Products Ltd<br />
Importers, processors and<br />
distributors of groundnuts,<br />
treenuts, coconut and dried fruits<br />
Station Road, Rowley Regis<br />
<strong>West</strong> Midlands B65 0LJ<br />
Tel: +44 (0)1215 613366<br />
Fax: +44 (0)1215 592429<br />
Email: enquiries@markbeech.co.uk<br />
Website: www.markbeech.co.uk
Meridian Foods Ltd<br />
Producer of speciality oils, peanut<br />
and speciality nut butters<br />
Corwen, Denbeighshire LL21 9RJ<br />
Tel: +44 (0)1490 413151<br />
Fax: +44 (0)1490 412032<br />
Email: <strong>in</strong>fo@meridianfoods.co.uk<br />
Website: www.meridianfoods.co.uk<br />
Murcott (UK) Ltd<br />
The Arnold Bus<strong>in</strong>ess Park,<br />
Branbridges Rd<br />
East Peckham Kent TN12 5LG<br />
Tel: +44 (0)1622 872929<br />
Fax: +44 (0)1622 873221<br />
Nestle (UK) Ltd<br />
Food and confectionery<br />
manufacturers<br />
St George’s House<br />
Croydon Surrey CR9 1NR<br />
Tel: +44 (0)20 86675257<br />
Fax: +44 (0)20 86675413<br />
Website: www.nestle.co.uk<br />
Pacific Foods Ltd<br />
Trader<br />
2nd Floor, 10 M<strong>in</strong>ories, London<br />
EC3N 1BJ<br />
Tel: +44 (0)20 7702 1939<br />
Fax: +44 (0)20 7702 9597<br />
Email: <strong>in</strong>fo@pacificfoods.co.uk<br />
Percy Dalton’s Famous Peanut Co.<br />
Ltd<br />
Traders and manufacturers of peanut,<br />
nut and dried fruit products<br />
Old Ford Works, Dace Road<br />
London E3 2PE<br />
Tel: +44 (0)20 89859241<br />
Fax: +44 (0)20 89863028<br />
Email: enquiries@percydaltons.com<br />
Website: www.percydaltons.com<br />
The Paragon Food Co Ltd<br />
Import<strong>in</strong>g, pack<strong>in</strong>g and distribution<br />
of peanuts and nuts<br />
1 <strong>West</strong>borough Road<br />
<strong>West</strong>cliff On Sea, Essex SS0 9DR<br />
Tel: +44 (0)1702 390999<br />
Fax: +44 (0)1702 344377<br />
Email: <strong>in</strong>fo@paragonfoods.com<br />
Website: www.paragonfoods.com<br />
George Payne & Co Ltd<br />
Confectionery manufacturers<br />
PO Box 113, Croydon Surrey CR9<br />
4BU<br />
Tel: +44 (0)20 86887744<br />
Fax: +44 (0)20 86860082<br />
Email: <strong>in</strong>fo@paynes.co.uk<br />
Premier Fruit & Nut Ltd<br />
Premier House, 325 Streatham High<br />
Road<br />
London SW16 3NT<br />
Tel: +44 (0)20 86798226<br />
Fax: +44 (0)20 86798823<br />
99
Readifoods Ltd<br />
Packers and blenders of dried fruit<br />
and nut mixes<br />
Station Road, Heck<strong>in</strong>gton<br />
Slea<strong>for</strong>d L<strong>in</strong>colnshire NG34 9JH<br />
Tel: +44 (0)1529 461551<br />
Fax: +44 (0)1529 461454<br />
Email: readifoods@bt<strong>in</strong>ternet.com<br />
Website: www.readifoods.com<br />
Southwaves Ltd<br />
Edible nut traders<br />
18 Broad Rob<strong>in</strong><br />
Gilligham, Dorset SP8 4PJ<br />
Tel: +44 (0)1747 822088<br />
Fax: +44 (0)1747 822838<br />
Email: southwvs@aol.com<br />
Sunscoop Products Ltd<br />
Peanut and nut processor<br />
Units K1/K3, Coedcae Lane<br />
Industrial Estate,<br />
Pontyclun, Mid. Glamorgan<br />
South Wales CF72 9HG<br />
Tel: +44 (0)1443 229229<br />
Fax: +44 (0)1443 228883<br />
Email: nuts@sunscoop.co.uk<br />
Sun Valley Ltd<br />
Processors and packers of peanuts<br />
and nut products<br />
Georgia Avenue, Bromborough<br />
Wirral L62 3RD<br />
Tel: +44 (0)151 3347788<br />
Fax: +44 (0)151 3347789<br />
Email: <strong>in</strong>fo@sun-valley.co.uk<br />
Website: www.sun-valley.co.uk<br />
100<br />
RS T<strong>in</strong>sley (Liverpool) Ltd<br />
Peanut and nut broker<br />
Cunard Build<strong>in</strong>g - 2nd Floor,<br />
Water Street<br />
Liverpool L3 1DS<br />
Tel: +44 (0)151 2360797<br />
Fax: +44 (0)151 2364556<br />
Email: rst<strong>in</strong>ut@aol.com<br />
Website:<br />
www.rst<strong>in</strong>sleynutbrokers.com<br />
Trigon Snacks Ltd<br />
Manufacturer of snack nuts<br />
Atherton Road, A<strong>in</strong>tree<br />
Liverpool L9 7AQ<br />
Tel: +44 (0)151 5238700<br />
Fax: +44 (0)151 5215370<br />
Email: enquiries@trigon-snacks.com<br />
TRS Wholesale Co Ltd<br />
Wholesalers of ethnic foods and<br />
distributors of nuts, lentils, rice<br />
and spices<br />
Southbridge Way, The Green<br />
Southall, Middlesex UB2 4BY<br />
Tel: +44 (0)20 85713252<br />
Fax: +44 (0)20 85741716<br />
Email: mail@trs.co.uk<br />
Tw<strong>in</strong> Trad<strong>in</strong>g Ltd.<br />
Third Floor, 1 Curta<strong>in</strong> Road<br />
London EC2A 3LT<br />
Tel: +44 (0) 20 7375 1221<br />
Fax: +44 (0) 20 7375 1337<br />
Email: <strong>in</strong>fo@tw<strong>in</strong>.org.uk<br />
Website: www.tw<strong>in</strong>.org.uk
United Biscuits Food Division/KP<br />
Manufacturer of savoury snack<br />
nut products<br />
Eastwood Trad<strong>in</strong>g Estate,<br />
Fitzwilliam Road<br />
Rotherham, South Yorkshire S65 1TD<br />
Tel: +44 (0)1709 828101<br />
Fax: +44 (0)1709 835912<br />
Website: www.kpnuts.com<br />
Voicevale Ltd<br />
Supplier and distributor of nuts and<br />
dried fruit globally<br />
Dove House, Arcadia Avenue<br />
London N3 2JU<br />
Tel: +44(0)20 8371 3600<br />
Fax:+44(0)20 8371 0208<br />
Website: www.voicevale.com<br />
Netherlands<br />
Aldebaran Commodities BV<br />
Maasstraat 17, NL-3001 KB<br />
Rotterdam<br />
Tel: +31-(0)10-436-4900<br />
Fax: +31-(0)10-436-4865<br />
Email: jpvelzen@aldebaran.nl<br />
Alimenta Commodities BV, Golden<br />
Peanut Co. LLC<br />
Verkaade 9, NL-3016 Rotterdam<br />
Tel: +31-(0)10-404 4600<br />
Fax: +31-(0)10-411 1319<br />
Bohemia Nut Company BV<br />
<strong>West</strong>erstraat 46, NL-3016<br />
Rotterdam<br />
Tel: ++31-(0)412 6099<br />
Fax: ++31-(0)10-412-91 09<br />
Email: <strong>in</strong>fo@bohemianutcomp.nl<br />
FC Elfferich Trad<strong>in</strong>g BV<br />
Hooipolderweg 8<br />
NL-2635 AZ Den Hoom<br />
Tel: ++31-(0)-15-2511-660<br />
Fax: ++31-(0)-15-214 22 00<br />
Email: elfferich@elfferich.etrade.nl<br />
Handelsveem BV<br />
Parmentierple<strong>in</strong> 1, NL-3088 GN<br />
Rotterdam<br />
Tel: ++31-(0)10-487 95 46<br />
Fax: ++31-(0)10-487 95 50<br />
Email: p.kommene@nl.ste<strong>in</strong>weg.com<br />
Jas Trad<strong>in</strong>g BV<br />
Haspelslaan 11, NL-1181 Amstelveen<br />
Tel: ++31-(0)20-643-64 12<br />
Fax: ++31-(0)20-643-21 27<br />
Email: <strong>in</strong>fo@jastrad<strong>in</strong>g.nl<br />
The Nut Company BV<br />
Bedrijvenpark Ijsseloord 2<br />
Meander 601 6825 ME Arnhem<br />
Tel: ++31 (0) 26 384 0156<br />
Fax: ++31 (0) 26 384 0151<br />
Email: p.bello@thenutcompany.com<br />
Olam Europe BV<br />
P.O. Box 29051, NL-3001 GB<br />
Rotterdam<br />
Tel: ++31-10-404 4014<br />
Fax: ++31-10-4044010<br />
Email: rene@olameurope.com<br />
101
Van Maurik<br />
International peanut broker<br />
“Gravenlust”, Buizenwerf 207, 3063<br />
AE Rotterdam<br />
Tel: +31 (10) 4110716<br />
Fax: +31 (10) 4144170<br />
Email: rikma@wxs.nl<br />
Vebero Eastwood Upgrad<strong>in</strong>g<br />
Blanch<strong>in</strong>g BV<br />
Rederijweg 30, NL-4960 Oosterhout<br />
Tel: ++31-(0)162 437 777<br />
Fax: ++31-(0)162-437 711<br />
Email: <strong>in</strong>fo@vebero-eastwood.nl<br />
Germany<br />
HD Cotterell<br />
Ellerholzdamm 29-35<br />
D-20457 Hamburg<br />
Tel: ++49-(0)40-3178 7535<br />
Fax: ++49-(0)40-3179 0816<br />
Email: m.lembke@cotterell.de<br />
CSTS Internationale Spedition<br />
Grüner Deich 110, 20097 Hamburg<br />
Tel: ++49-(0)40-23 69 800<br />
Fax: ++49-(0)40-23 19 78<br />
Email: csts@csts.cargol<strong>in</strong>k.de<br />
Eichholtz & Cons. GmbH<br />
Müggenburger Strasse 7-15, 20539<br />
Hamburg<br />
Tel: +49-(0)40-780946-0<br />
Fax: +49-(0)40-780946-21<br />
Email: r.kraupner@eichholtz.de<br />
102<br />
Felix The Nut Company GmbH & Co.<br />
KG<br />
B<strong>in</strong>nerheide 28, D-58239<br />
Tel: ++49-(0)2304-472 13<br />
Fax: ++49-(0)2304-472 40<br />
Email: burkhard.feldhaus@felix.de<br />
Ernst-Georg Göck Fruchtagentur<br />
GmbH<br />
Elbchaussee 84, D-22763 Hamburg<br />
Tel: ++49-(0)40-32 56 520<br />
Fax: ++49-(0)40-32 65 76<br />
Email: egg@eggoeck.de<br />
Max Kiene GmbH<br />
Oberhafenstraße 1, D-20097 Hamburg<br />
Tel: ++49-(0)40-30 96 550<br />
Fax: ++49-(0)40-30 96 55 20<br />
Email: maxkiene@maxkiene.de<br />
Kunz Consult<strong>in</strong>g<br />
Tannenweg 11, D-59939 Olsberg<br />
Tel: ++49-(0)2962-841 66<br />
Fax: ++49-(0)2962-843 64<br />
The Lorenz Bahlsen Snack-World<br />
GmbH & Co.<br />
Siemensstrasse 10, D-63263 Neu-<br />
Isenburg<br />
Tel: ++49-(0)6102-293 112<br />
Fax: ++49-(0)6102-293 151<br />
Email: alfred. pawlowski@lbsnacks.com<br />
Nuts Consult and Public Relations<br />
Basaltweg 60, D-22395 Hamburg<br />
Tel: ++49-(0)40-602 47 49<br />
Fax: ++49-(0)40-602 97 14
OMNITRADE Handelsgesellschaft<br />
GmbH<br />
Große Straße 2, D-22926<br />
Ahrensburg<br />
Tel: ++49-(0)4102-88 620<br />
Fax: ++49-(0)4102-886 288<br />
Email: <strong>in</strong>fo@omnitrade-hamburg.de<br />
Primex Trad<strong>in</strong>g GmbH<br />
Holzbrücke 7, 20450 Hamburg<br />
Tel: ++49-(0)40-36 90 580<br />
Fax: ++49-(0)40-36 90 58 58<br />
Email: primex.hamburg@t-onl<strong>in</strong>e.de<br />
Peter Riege<br />
Alter Elbdeich 23, D-21217 Seevetal<br />
Tel: ++49-(0)40-769 21 60<br />
Fax: ++49-(0)6102-293 151<br />
Email: peter.riege@t-onl<strong>in</strong>e.de<br />
Ludger Wehry GmbH<br />
Lärchenweg 5, D-49413 D<strong>in</strong>klage<br />
Tel: ++49-(0)4443-96 320<br />
Fax: ++49-(0)4443-963 220<br />
WEJ GmbH<br />
Stenzelr<strong>in</strong>g 14b, D-21107 Hamburg<br />
Tel: ++49-(0)40-7527 0929<br />
Fax: ++49-(0)40-7527 0920<br />
Email: lothar.boers@wej.de<br />
Switzerland<br />
Alimenta S.A., Golden Peanut<br />
Co.LLC<br />
154 Route de Suisse, CH 1290<br />
Versoix-Génève<br />
Tel: ++41-22-7750 200<br />
Fax: ++41-22-7750 292<br />
Email: tfrangie@alimenta.ch<br />
103
Appendix 9: <strong>Groundnut</strong> contacts <strong>in</strong> the USA<br />
From the American Peanut Council<br />
From: http://www.peanutsusa.com/<br />
<strong>in</strong>dex.cfm?fuseaction=home.page&<br />
pid=9<br />
Equipment manufacturers<br />
(Blanchers)<br />
Ashton Food Mach<strong>in</strong>ery Co., Inc.<br />
Neumunz Division<br />
1455 MCCarter Highway<br />
Newark, NJ 07104<br />
USA<br />
Tel: (201) 483-8518<br />
Fax: (201) 483-2756/0200<br />
Blaw-Knox Food And Chemical<br />
Equipment Company<br />
PO Box 1041<br />
Buffalo, NY 14240<br />
USA<br />
Tel: (716) 895-2100<br />
Fax: (716) 895-8263<br />
Krispy Kist Company<br />
120 S, Halsted Street<br />
Dept. 9P<br />
Chicago, IL 60661<br />
USA<br />
Tel: (312) 733-0900<br />
Fax: (312) 733-3508<br />
104<br />
Wolver<strong>in</strong>e Proctor & Schwartz, Inc.<br />
251 Gibraltar Road<br />
Horsham, PA 19044<br />
USA<br />
Tel: (215) 443-5200<br />
Fax: (215) 443-5206<br />
Website: www.wolver<strong>in</strong>eproctor.com<br />
Peanut Butter Process<strong>in</strong>g<br />
Equipment Manufacturers<br />
Ashton Food Mach<strong>in</strong>ery Company,<br />
Inc.<br />
Neumunz Division<br />
1455 McCarter Highway<br />
Newark, NJ 07104<br />
USA<br />
Tel: (973) 483-8518<br />
Fax: (973) 483-2756/0200<br />
Cantrell International<br />
Division of AC Horn<br />
1269 Majesty<br />
Dallas, TX 75247<br />
USA<br />
Tel: (800) 657-6155<br />
Fax: (214) 630-0130<br />
Krispy Kist Company<br />
120 S. Halsted Street<br />
Department 9P<br />
Chicago, IL 60661<br />
USA<br />
Tel: (312) 733-0900<br />
Fax: (312) 733-3508
Union Standard Equipment<br />
Company<br />
801-825 E. 141st Street<br />
Bronx, NY 10454<br />
USA<br />
Tel: (718) 585-0200<br />
Fax: (718) 993-2650<br />
Urschel Laboratories Inc.<br />
2503 Calumet Road<br />
Valparaiso, IN 46383<br />
USA<br />
Tel: (219) 464-4811<br />
Fax: (219) 462-3879<br />
Wolver<strong>in</strong>e Proctor & Schwartz, Inc.<br />
251 Gibraltar Road<br />
Horsham, PA 19044<br />
USA<br />
Tel: (800) PROCTOR<br />
Fax: (215) 443-5206<br />
Website: www.wolver<strong>in</strong>eproctor.com<br />
Roast<strong>in</strong>g Equipment Suppliers<br />
Ashton Food Mach<strong>in</strong>ery Company,<br />
Inc.<br />
Neumunz Division<br />
1455 McCarter Highway<br />
Newark, NJ 07104<br />
USA<br />
Tel: 973-483-8518<br />
Fax: 973-483-2756<br />
Contact: Peter Isler<br />
Blaw-Knox Food and Chemical<br />
Equip. Co.<br />
PO Box 1041<br />
Buffalo, NY 14240<br />
USA<br />
Tel: 716-895-2100<br />
Contact: JP Newell<br />
Cantrell International<br />
1269 Majesty<br />
Dallas, TX 75247<br />
USA<br />
Tel: 214-630-3311<br />
Fax: 214-630-0130<br />
Heat & Control Inc.<br />
2111 Cabot Blvd.<br />
Hayward, CA 94545<br />
USA<br />
Tel: (510) 259-0500<br />
Contact: Don Giles<br />
Krispy Kist Company<br />
120 S. Halsted Street<br />
Dept. 9P<br />
Chicago, IL 60661<br />
USA<br />
Tel: 312-733-0900<br />
Fax: 312-733-3508<br />
Specialties Appliance Corp.<br />
715 South 25th Avenue<br />
Bellwood, IL 60104<br />
USA<br />
Tel: 708-544-6500<br />
Fax: 708-544-6505<br />
Contact: Keith Smith<br />
105
Wolver<strong>in</strong>e Proctor & Schwartz, Inc.<br />
251 Gibraltar Road<br />
Horsham, PA 19044<br />
USA<br />
Tel: 215-443-5200<br />
Fax: 215-443-5206<br />
Website: www.wolver<strong>in</strong>eproctor.com<br />
Contact: Chuck Kovacs<br />
Used & Rebuilt Equipment<br />
Dealers<br />
Madison Equipment Company<br />
2950 <strong>West</strong> Carroll<br />
Chicago, IL 60612<br />
USA<br />
Tel: 312-533-5800<br />
Fax: 312-533-5820<br />
Union Standard Equipment Co.<br />
801-825 E. 141st. Street<br />
Bronx, NY 10454<br />
USA<br />
Tel: 718-585-0200<br />
Fax: 718-993-2650<br />
email: salesla@unionstandard.com<br />
US Peanut Butter Supplier List<br />
Cargill Peanut Products*<br />
PO Box 272<br />
North Ma<strong>in</strong> Street<br />
Dawson, GA 31742<br />
Tel: (912) 995-2111<br />
Fax: (912) 995-3268<br />
Contact: Mike Boyd<br />
*Private Label Processor<br />
106<br />
The Carriage House Companies, Inc.*<br />
196 Newton Street<br />
Fredonia, NY 14063<br />
Tel: (716) 673-1000<br />
Fax: (716) 679-7702<br />
Contact: Mike Hackbarth<br />
*Private Label Processor<br />
Con-Agra Grocery Products +<br />
3353 Michelson Drive<br />
MS 1-A55<br />
Irv<strong>in</strong>e, CA 92612-0650<br />
USA<br />
Tel: (949) 437-1172<br />
Fax: (949) 437-3339<br />
Contact: Bob Fortmeier<br />
+ Maker of Peter Pan Brand<br />
George Wash<strong>in</strong>gton Carver Food<br />
Products, Inc.*<br />
420 Williamson Avenue<br />
Peanut Product Division<br />
Opelika, AL 36804<br />
Tel: (334) 741-4100<br />
Fax: (334) 741-4117<br />
Email: gwcfoodprod@msn.com<br />
Contact: RJ Lewis<br />
*Private Label Processor<br />
JM Smucker Company*<br />
One Strawberry Lane<br />
PO Box 280 Orrville, OH 44667-0280<br />
Tel: (330) 682-3000<br />
Fax: (330) 684-3115<br />
Website: www.smucker.com<br />
Contact: Gary Rasor<br />
*Maker of Jif and Private Label<br />
Processor
Once Aga<strong>in</strong> Nut Butter, Inc.*<br />
12 South State Street<br />
PO Box 429 Nunda, NY 14517<br />
Tel: (716) 468-2535<br />
Fax: (716) 468-5995<br />
Contact: Jeremy Thaler<br />
*Private Label Processor<br />
Tara Foods*<br />
1900 Cowles Avenue<br />
Albany, GA 31705-1514<br />
Tel: (229) 431-1330<br />
Fax: (229) 439-1458<br />
Contact: Roger Templeton<br />
1014 V<strong>in</strong>e Street<br />
C<strong>in</strong>c<strong>in</strong>nati, OH 45202<br />
Tel: (513) 762-1236<br />
Fax: (513) 762-1342<br />
Contact: Mary Egnor<br />
*Private Label Processor<br />
Unilever Bestfood<br />
Export Division<br />
800 Sylvan Ave<br />
Englewood Cliffs, NJ 07632<br />
USA<br />
Tel: (201) 894-4943<br />
Fax: (201) 894-2702<br />
Contact: Walter Taylor<br />
Universal Blanchers<br />
800 Commerce Drive<br />
Suite 201<br />
Peachtree City, GA 30269<br />
Tel: (770) 487-1230<br />
Fax:(770) 487-3828<br />
Website: www.universalblanchers.com<br />
Contact: Kev<strong>in</strong> Ga<strong>in</strong>es<br />
Email:<br />
mmckee@universalblanchers.com<br />
US Peanut Processors<br />
Ferrara Pan Candy Company<br />
7301 W. Harrison Street<br />
Forest Park, IL 60130-2083<br />
Tel: (708) 366-0500<br />
Fax: (708) 366-5921<br />
Contact: James S Buffardi<br />
John B Sanfilippo & Son, Inc.<br />
2299 Busse Road<br />
Elk Grove Village, IL 60007-0057<br />
Tel: (847) 593-2300<br />
Fax: (847) 593-9608<br />
Website: www.fishernuts.com<br />
Contact: Mike Valent<strong>in</strong>e<br />
Kroger Foods<br />
1014 V<strong>in</strong>e Street<br />
C<strong>in</strong>c<strong>in</strong>nati, OH 45202<br />
Tel: (513) 762-1236<br />
Fax: (513) 762-1342<br />
Contact: Mary Egnor<br />
L<strong>in</strong>coln Snacks Company<br />
4 High Ridge Park<br />
Stam<strong>for</strong>d, CT 06905<br />
Tel: (203) 329-4545<br />
Fax: (203) 329-4555<br />
Website: www.l<strong>in</strong>colnsnacks.com<br />
Contact: R Scott Kirk<br />
Morven Partners, LP<br />
PO Box 465<br />
Edenton, NC 27932<br />
Tel: (252) 482-2193<br />
Fax: (252) 482-7857<br />
Contact: Hal Burns<br />
107
Nature Kist Snacks<br />
6909-D Positas Rd.<br />
Livermore, CA 94550<br />
Tel: (925) 606-4200<br />
Fax: (925) 606-7183<br />
Contact: Ron Moz<strong>in</strong>go<br />
Peanut Processors, Inc.<br />
PO Box 160<br />
Dubl<strong>in</strong>, NC 28332-0160<br />
Tel: (910) 862-2136<br />
Fax: (910) 862-8076<br />
Contact: Lyn Shaw<br />
Website: www.peanutprocessors.com<br />
Tom’s Foods, Inc.<br />
900 8th Street<br />
PO Box 60<br />
Columbus, GA 31994-0001<br />
Tel: (706) 323-2721<br />
Fax: (706) 596-9772<br />
Contact: Ben Smith<br />
Universal Blanchers<br />
800 Commerce Drive<br />
Suite 201<br />
Peachtree City, GA 30269<br />
Tel: (770) 487-1230<br />
Fax:(770) 487-3828<br />
Contact: Kev<strong>in</strong> Ga<strong>in</strong>es<br />
Email:<br />
mmckee@universalblanchers.com<br />
Website:<br />
www.universalblanchers.com<br />
108<br />
US Blanchers<br />
Tidewater Blanch<strong>in</strong>g Corp.<br />
160 County Street<br />
PO Box 219<br />
Suffolk, VA 23439-0219<br />
Tel: (434) 384-7098<br />
Fax: (434) 384-9528<br />
Contact: Jerry D Canaday<br />
Universal Blanchers<br />
800 Commerce Drive<br />
Suite 201<br />
Peachtree City, GA 30269<br />
Tel: (770) 487-1230<br />
Fax:(770) 487-3828<br />
Contact: Kev<strong>in</strong> Ga<strong>in</strong>es<br />
Email:<br />
mmckee@universalblanchers.com<br />
Website:<br />
www.universalblanchers.com<br />
The Cl<strong>in</strong>t Williams Company<br />
Hwy. 199 East (Shipp<strong>in</strong>g)<br />
PO Box 310<br />
Madill, OK 73446<br />
Tel: (580) 795-5555<br />
Plant Tel: (580) 795-7368<br />
Fax: (580) 795-5802<br />
Plant Fax: (580) 795-7518<br />
Contact: Alan Ortloff
US Broker List<br />
Ba-Com Commodities, Inc.<br />
3500 Virg<strong>in</strong>ia Beach Blvd.<br />
Little Neck Towers<br />
Suite 211<br />
Virg<strong>in</strong>ia Beach, VA 23452<br />
Tel: (757) 631-8775<br />
Fax: (757) 430-3428<br />
Contact: David Bacon<br />
Charles R Hood Brokerage Co., Inc.<br />
PO Box 13948<br />
1282 Timberlane Commons, Suite C<br />
Tallahassee, FL 32317<br />
Tel: (850) 668-4996<br />
Fax: (850) 668-3608<br />
E-mail: hoodcr@aol.com<br />
Contact: Charles R Hood, President<br />
Hofler Brokerage, Inc.<br />
124 Clay Street<br />
PO Box 1603<br />
Suffolk, VA 23439-1603<br />
Tel: (757) 539-0291<br />
Fax: (757) 539-3291<br />
Contact: Thomas Hofler, President<br />
International Service Group<br />
22 Ramsey Street<br />
Suite B<br />
Roswell, GA 30075<br />
Tel: (770) 518-0988<br />
(770) 518-0299<br />
Contact: Robert N Kopec, President<br />
JR James Brokerage Company, Inc<br />
PO Box 1801<br />
Tel: (912) 888-7395<br />
1208 N. Madison Street<br />
Fax: (912) 888-3738<br />
Albany, GA 31702<br />
Email: i-jrjame@bellsouth.net<br />
Contact: Robert S Johnson<br />
Lovatt And Rush<strong>in</strong>g, Inc.<br />
6075 The Corners Parkway<br />
Suite 110<br />
Norcross, GA 30092<br />
Tel: (770) 446-1113<br />
Fax: (770) 446-7056<br />
Contact: George I Lovatt<br />
Mazur and Hockman, Inc.<br />
PO Box 991<br />
1501 Third Avenue<br />
Albany, GA 31702<br />
Tel: (229) 883-3456<br />
Fax: (229) 883-3525<br />
E-mail: eatpnuts@surfsouth.com<br />
Contact: Richard Barnhill<br />
O’Connor and Company, Inc.<br />
PO Box 1679<br />
314 W. Wash<strong>in</strong>gton Street<br />
Suffolk, VA 23439-1679<br />
Tel: (757) 539-0296<br />
Fax: (757) 539-9074<br />
Contact: Thomas J O’Connor, III,<br />
President<br />
109
RB Wolff & Company, Inc.<br />
3 Cotesworth Place<br />
Savannah, GA 31411-2876<br />
Tel: (912) 598-0022<br />
Fax: (253) 595-4240<br />
Email: ru medium@aol.com<br />
Contact: Ronald B Wolff, President<br />
SGL International LLC<br />
PO Box 720124<br />
6065 Roswell Road<br />
Suite 730 Atlanta, GA 30358-2124<br />
Tel: (404) 252-6887<br />
Fax: (404) 256-4097<br />
Contact: Sid Levy, President<br />
US Shellers<br />
Anderson’s Peanuts<br />
A Division of Alabama Farmers<br />
Cooperative, Inc.<br />
603 South Maloy Street<br />
PO Drawer 810<br />
Opp, AL 36467-0810<br />
Tel: (334) 493-4591<br />
Fax: (334) 493-7767<br />
Export Contact: John Reed, Sales<br />
Manager<br />
Runner-shelled<br />
Birdsong Peanuts<br />
612 Madison Avenue (23434)<br />
PO Box 1400<br />
Suffolk, VA 23439<br />
Tel: (757) 539-3456<br />
Fax: (757) 539-7360<br />
Email: dperry@ birdsongpeanuts.com<br />
110<br />
Export Contacts: Warren Birdsong,<br />
Vice President<br />
David Birdsong, Sales Representative<br />
Runner-shelled, Spanish-shelled,<br />
Virg<strong>in</strong>ia-shelled and <strong>in</strong>-shell<br />
Borden Peanut Company, Inc.<br />
PO Box 28<br />
620 East Lime Street<br />
Portales, NM 88130<br />
Tel: (505) 536-8545<br />
Fax: (505) 359-0072<br />
Export Contact: Bill Owen, Vice<br />
President/General Manager<br />
Valencia-shelled and <strong>in</strong>shell<br />
Golden Peanut Company<br />
Suite 400<br />
100 North Po<strong>in</strong>t Center East<br />
Tel: (770) 752-8200<br />
Fax: (770) 752-8306<br />
Alpharetta, GA 30022<br />
Website: www.goldenpeanut.com<br />
Export Contacts: Alexandre<br />
Izmirlian, Vice President,<br />
International Sales;<br />
Jean-Paul Bodourian, Vice-President,<br />
Export Sales<br />
Runner-shelled, Spanish-shelled,<br />
Virg<strong>in</strong>ia-shelled and <strong>in</strong>shell,<br />
blanched peanuts<br />
Export contacts <strong>for</strong> specialty<br />
products: Bruce Kotz, Manager,<br />
Specialty Products<br />
Processed peanuts, peanut butter,<br />
flour, oil
Lee County Peanut Company, Inc.<br />
136 South Caldwell<br />
Gidd<strong>in</strong>gs, TX 78942<br />
Tel: (979) 542-3453<br />
Fax: (979) 542-0991<br />
Website: www.alphal.net/~lcpnuts<br />
Export Contact: Jonathan Socha,<br />
President<br />
Spanish-shelled<br />
McCleskey Mills, Inc.<br />
PO Box 98<br />
Highway 118 <strong>West</strong><br />
Smithville, GA 31787<br />
Tel: (229) 846-2003<br />
Fax: (229) 846-4805<br />
Export Contact: Jerry M Chandler,<br />
President<br />
Runner-shelled<br />
Morven Partners, LP<br />
Edenton Division<br />
PO Box 465<br />
Edenton, NC 27932<br />
Tel: (252) 482-2193<br />
Fax: (252) 482-7857<br />
Export Contact: Hal Burns, Vice<br />
President, In-shell Group<br />
Runner-shelled, Virg<strong>in</strong>ia-shelled and<br />
<strong>in</strong>shell, blanched peanuts, processed<br />
peanuts <strong>in</strong>clud<strong>in</strong>g salted <strong>in</strong>shell<br />
Reeves Peanut Company<br />
340 East Broad Street<br />
PO Box 565<br />
Eufaula, AL 36072-0565<br />
Tel: (334) 687-2756<br />
Fax: (334) 687-9126<br />
Website: www.mr-macs-peanuts.com<br />
Export Contact: Ben C Reeves,<br />
President<br />
Runner-shelled<br />
Sessions Company, Inc.<br />
PO Box 31-1310<br />
801 N. Ma<strong>in</strong> Street (36330)<br />
Enterprise, AL 36331-1310<br />
Tel: (334) 393-0200<br />
Fax: (334) 393-0240<br />
E-mail: pnutsouth @aol.com<br />
Website: www.peanutsouth.com<br />
Export Contact: William T Ventress,<br />
Jr., President<br />
Shelled peanuts<br />
Severn Peanut Company, Inc.<br />
PO Box 710<br />
Severn, NC 27877<br />
Tel: (252) 585-0838<br />
Fax: (252) 585-1718<br />
Export Contact: Carl Gray, Jr.,<br />
Secretary-Treasurer, Sales<br />
Virg<strong>in</strong>ia-shelled and <strong>in</strong>shell<br />
Tom’s Foods, Inc.<br />
900 8TH Street<br />
PO Box 60<br />
Columbus, GA 31994-0001<br />
Tel: (706) 323-2721<br />
Fax: (706) 596-9772<br />
Export Contact: Ben Smith,<br />
Manager, Peanut Operations<br />
Runner-shelled<br />
111
Wilco Peanut Company<br />
PO Drawer B<br />
Highway 281 North (Physical)<br />
Pleasanton, TX 78064-0060<br />
Tel: (830) 569-3808<br />
Fax: (830) 569-2743<br />
Export Contact: Byron Warnken,<br />
President<br />
Runner-shelled, Spanish-shelled<br />
Cl<strong>in</strong>t Williams Company<br />
A Division of Texoma Peanut<br />
Company<br />
433 East Ma<strong>in</strong> Street<br />
PO Box 310<br />
Madill, OK 73446-0310<br />
Tel: (580) 795-5555<br />
Plant Tel: (580) 795-7368<br />
Fax: (580) 795-5802<br />
Plant Fax: (580) 795-7518<br />
Export Contact: Jim Bull,<br />
Operations Coord<strong>in</strong>ator & Sales<br />
Manager<br />
Runner-shelled, Spanish-shelled,<br />
Virg<strong>in</strong>ia-shelled and <strong>in</strong>shell,<br />
Valencia-shelled and <strong>in</strong>shell,<br />
blanched peanuts<br />
US Manufacturers<br />
The Carriage House Companies,<br />
Inc.<br />
196 Newton Street<br />
Fredonia, NY 14063<br />
Tel: (716) 673-1000<br />
Fax: (716) 679-7702<br />
Contact: Mark M Miller, Director of<br />
Purchas<strong>in</strong>g<br />
112<br />
Ferrara Pan Candy Company<br />
7301 W. Harrison Street<br />
Forest Park, IL 60130-2083<br />
Tel: (708) 366-0500<br />
Fax: (708) 366-5921<br />
Contact: James S Buffardi,<br />
Secretary/Chief F<strong>in</strong>ancial Officer<br />
Hershey Foods Corporation<br />
PO Box 810<br />
100 Crystal A Drive<br />
Hershey, PA 17033<br />
Tel: (717) 534-6675<br />
Fax: (717) 534-7754<br />
Contact: Dick Barnoski, Manager,<br />
Nut Procurement<br />
Con-Agra Grocery Products*<br />
3353 Michelson Drive<br />
MS 1-A55<br />
Irv<strong>in</strong>e, CA 92612-0650<br />
USA<br />
Tel: (949) 437-1172<br />
Fax: (949) 437-3339<br />
Contact: Bob Fortmeier<br />
*Maker of Peter Pan Brand<br />
JM Smucker Company<br />
Corporate Headquarters of HB<br />
Dev<strong>in</strong>ey Co., Inc.<br />
One Strawberry Lane<br />
PO Box 280<br />
Orrville, OH 44667-0280<br />
Tel: (330) 682-3000<br />
Fax: (330) 684-3115<br />
Website: www.smucker.com<br />
Contact: Gary Rasor, Director,<br />
Corporate Purchas<strong>in</strong>g
John B Sanfilippo & Son, Inc.<br />
2299 Busse Road<br />
Elk Grove Village, IL 60007-0057<br />
Tel: (847) 593-2300<br />
Fax: (847) 593-9608<br />
Website: www.fishernuts.com<br />
Contact: Mike Valent<strong>in</strong>e<br />
Kraft Foods Inc. Snacks Division<br />
200 DeForest Avenue<br />
PO Box 1944<br />
East Hanover, NJ 07936-1944<br />
Tel: (973) 501-4788<br />
Fax: (973) 503-2399<br />
Website: www.nabisco.com<br />
Contact: Doug Smyth<br />
Masteroods USA<br />
P. O. Box 3289<br />
1209 <strong>West</strong> Oakridge Drive<br />
Tel: (229) 434-4807<br />
Fax: (229) 434-4812<br />
Albany, GA 31706-3289<br />
Website: www.m-ms.com<br />
Contact: Charles Ivy, Commodity<br />
Purchas<strong>in</strong>g Manager<br />
Nestle USA<br />
Chocolate & Confections Division<br />
800 North Brand Boulevard<br />
6th Floor<br />
Glendale, CA 91203<br />
Tel: (818) 549-5033<br />
Fax: (818) 543-7952<br />
Website: www.nestle.com<br />
Contact: Charles Stelmokas, Vice<br />
President, Supply Cha<strong>in</strong><br />
Tara Foods<br />
A Division of the Kroger Company<br />
1900 Cowles Avenue<br />
Albany, GA 31705-1514<br />
Tel: (229) 431-1330<br />
Fax: (229) 439-1458<br />
Contact: Richard Barnhill, General<br />
Manager<br />
Tom’s Foods, Inc.<br />
900 8th Street<br />
PO Box 60<br />
Columbus, GA 31994-0001<br />
Tel: (706) 323-2721<br />
113
Appendix 10: Bibliography<br />
Abdoulaye Mohamed. 1982. Les problèmes de production arachidières au Niger et les<br />
tentatives de redressement. Pages 151-153 <strong>in</strong> Symposium International en Afrique sur<br />
la production arachidière, le marché mondial des oléag<strong>in</strong>eux et le commerce <strong>in</strong>terafrica<strong>in</strong><br />
de l’arachide et des produits arachidiers, Banjul, Gambia 7-11 June 1982.<br />
Adams GP, <strong>West</strong>hoff B, Willott and Young RE. 2001. Do decoupled payments affect<br />
US crop area? Prelim<strong>in</strong>ary evidence from 1997-2000. American Journal of<br />
Agricultural Economics 83(5): 1190-95.<br />
Akobundu E. 1998. Farm–household analysis of policies affect<strong>in</strong>g groundnut<br />
production <strong>in</strong> Senegal. MS thesis, Virg<strong>in</strong>ia Polytechnic and State University.<br />
Anderson KJ, Francois T, Hertel B, Hoekman and Mart<strong>in</strong> W. 2000. Potential ga<strong>in</strong>s<br />
from trade re<strong>for</strong>m <strong>in</strong> the new millennium. Paper presented at the Third Annual<br />
Conference on Global Economic Analysis held June 27-30, 2000 at Monash<br />
University, Victoria, Australia.<br />
Badiane O and K<strong>in</strong>teh S. 1994. Trade pessimism and regionalism <strong>in</strong> <strong>Africa</strong>n countries:<br />
The case of groundnut exporters. IFPRI Research Report 97, International Food Policy<br />
Research Institute, Wash<strong>in</strong>gton, DC.<br />
Badiane O and Gaye M. 1999. Liberalization of groundnut markets <strong>in</strong> Senegal: Impact<br />
on the market<strong>in</strong>g and process<strong>in</strong>g sector. IFPRI Discussion Paper 17. International Food<br />
Policy Research Institute, Wash<strong>in</strong>gton, DC.<br />
Baffes J. 2003. Cotton market sett<strong>in</strong>g, policies, issues and facts. World Bank Policy<br />
Work<strong>in</strong>g Paper. The World Bank, Wash<strong>in</strong>gton, DC.<br />
Begh<strong>in</strong> JC, Bureau J-C and Drogué S. 2003. The calibration of <strong>in</strong>complete demand<br />
systems <strong>in</strong> quantitative analysis. CARD Work<strong>in</strong>g Paper 03-WP 324. Center <strong>for</strong><br />
Agricultural and Rural Development, Iowa State University.<br />
Begh<strong>in</strong> JC and Matthey H. 2003. Model<strong>in</strong>g world peanut product markets: A tool <strong>for</strong><br />
agricultural trade policy analysis. CARD Work<strong>in</strong>g Paper 03-WP 332. Center <strong>for</strong><br />
Agricultural and Rural Development, Iowa State University.<br />
Begh<strong>in</strong> JC, Diop N, Matthey H and Sewadeh M. 2003. <strong>Groundnut</strong> trade<br />
liberalization: A South-South debate? Work<strong>in</strong>g Paper 03-WP 347, Center <strong>for</strong><br />
Agricultural and Rural Development, Iowa State University. www.card.iastate.edu.<br />
Begh<strong>in</strong> JC, Roland-Holst D and van der Mensbrugghe D. 2003. How will<br />
agricultural trade re<strong>for</strong>ms <strong>in</strong> high-<strong>in</strong>come countries affect the trad<strong>in</strong>g relationships of<br />
develop<strong>in</strong>g countries? Pages 39-57 <strong>in</strong> Agriculture, Trade, and Poverty: Mak<strong>in</strong>g Policy<br />
Analysis Count. Paris: Organisation <strong>for</strong> Economic Co-operation and Development<br />
Publications.<br />
Bello P. 2003. Personal Communication.<br />
114
Boakye-Yiadom L. 2003. An economic surplus evaluation of aflatox<strong>in</strong>-reduc<strong>in</strong>g<br />
research: A case study of Senegal’s confectionery groundnut sector. Thesis submitted<br />
to the Faculty of Virg<strong>in</strong>ia Polytechnic Institute and State University, Blacksburg,<br />
Virg<strong>in</strong>ia.<br />
CAE. 2001. Analyse de l’État des Filières des Oléag<strong>in</strong>eux. Bamako: Centre Agro-<br />
Entreprise (CAE).<br />
Chvosta J, Thurman WN, Brown BA and Rucker RR. 2003. The end of supply<br />
controls: The economic effects of recent change <strong>in</strong> federal peanut policy. Selected<br />
paper presented at the 2003 Southern Agricultural Economics Association, Mobile.<br />
CIRAD. 1998. Étude du développement de la filière arachide de bouche au Sénégal.<br />
Montpellier: CIRAD.<br />
CPS. 1998. Diagnostique de la filière arachide au Mali. Cellule de Planification et de<br />
Statistique, M<strong>in</strong>istère du Développement Rural et de l’Eau.<br />
Danguioua, Amadou M, Abdoulaye and Oua S. 2000. Étude filière huile d’arachide<br />
au Niger. <strong>Africa</strong>n Development Foundation, Niamey. 193 pp.<br />
Dimanche P and Kane A. 2002. Senegal’s confectionary peanut supply cha<strong>in</strong>: The<br />
challenge of controll<strong>in</strong>g aflatox<strong>in</strong> levels. In Food Safety Management <strong>in</strong> Develop<strong>in</strong>g<br />
Countries, 2002 (Hanak E, Boutrif E, Fabre P and P<strong>in</strong>eiro M. Sci. eds.). Proceed<strong>in</strong>gs of<br />
the International Workshop, CIRAD-FAO, 11-13 December 2002, Montpellier,<br />
France. Montpellier: CIRAD-FAO.<br />
Diop N, Begh<strong>in</strong> J and Sewadeh M. 2003. <strong>Groundnut</strong> policies, global trade dynamics<br />
and the impact of trade liberalization. World Bank Policy Work<strong>in</strong>g Paper, The World<br />
Bank, Wash<strong>in</strong>gton, DC.<br />
Fletcher SM and Revoredo CL. 2003. Does the US need the groundnut tariff rate<br />
quota under the 2002 US Farm Act? Paper presented at the International Conference<br />
on Agricultural Policy and the WTO: Where Are We Head<strong>in</strong>g? June 23-26 2003,<br />
Capri, Italy.<br />
Food and Agricultural Policy Research Institute (FAPRI). Elasticity database. Iowa<br />
State University.<br />
Freeman HA, Nigam SN, Kelley TG, Ntare BR, Subrahmanyam P and Boughton D.<br />
1999. The world groundnut economy: facts, trends, and outlook. Patancheru, India :<br />
ICRISAT. 48 pp.<br />
Ganguli R. 2004. India sees a chance to up groundnut oil exports <strong>in</strong> ’03-04. Times [of<br />
India] News Network, 15 January 2004.<br />
Gray JK. 2002. The groundnut market <strong>in</strong> Senegal: exam<strong>in</strong>ation of price and policy<br />
changes. Ph.D. Dissertation, University of Vermont. grayjk@vt.edu<br />
115
Gray JK. 2004. Personal communication.<br />
Hathie I and Lopez RA. The impact of market re<strong>for</strong>ms on the Senegalese peanut<br />
economy. Journal of International Development 14(5): 543-54.<br />
Kettlewell R. 2003. Personal Communication.<br />
Ngjeunga J, Ntare B and Schill<strong>in</strong>g R. 2003. Global and regional perspectives of the<br />
groundnut market: Competitiveness of <strong>Africa</strong>n producers. In: Ntare B, Mayeux A and<br />
Waliyar F. 2003. Proceed<strong>in</strong>gs of the f<strong>in</strong>al workshop of the <strong>Groundnut</strong> Germplasm<br />
Project. Patancheru, India: ICRISAT. 153 pp.<br />
Ntare B, Mayeux A and Waliyar F. 2003. Proceed<strong>in</strong>gs of the f<strong>in</strong>al workshop of the<br />
<strong>Groundnut</strong> Germplasm Project. Patancheru, India: ICRISAT. 153 pp.<br />
IFDC. 2003. IFDC-Daim<strong>in</strong>a Field Survey, August 2003. http://www.afam<strong>in</strong>.net/<br />
Nigeria/mis_nigeria_aug03.htm<br />
IOPEA. 2003. Chairman’s Speech (2003), Indian Oilseeds and Produce Exporters<br />
Association (IOPEA). http://www.iopea.org/sem<strong>in</strong>ar.htm.<br />
ITC. 1998. HPS groundnut: A survey of selected European markets. International<br />
Trade Centre, Netherlands.<br />
Lovelace JA. 1999. Export sector liberalization and <strong>for</strong>ward markets: Manag<strong>in</strong>g<br />
uncerta<strong>in</strong>ty dur<strong>in</strong>g policy transitions. <strong>Africa</strong> Economic Analysis, Woodrow Wilson<br />
School of Public and International Affairs, Pr<strong>in</strong>ceton University. http://<br />
www.afbis.com/analysis/f<strong>in</strong>ancial_markets.htm.<br />
Lubulwa, Godfrey and Davis J. 1994. Estimat<strong>in</strong>g the social cost of the impacts of<br />
fungi and aflatox<strong>in</strong>s. In Proceed<strong>in</strong>gs of the 6th International Work<strong>in</strong>g Conference on<br />
Stored-product Protection, 17-23 April 1994, Canberra. Wall<strong>in</strong>g<strong>for</strong>d, Ox<strong>for</strong>d:<br />
Commonwealth Agricultural Bureau International (CABI). Economic Evaluation Unit<br />
Work<strong>in</strong>g Paper Series.<br />
M<strong>in</strong>istère de l’Agriculture [du Mali]. 1980. Tentative de bilan sur les opérations de<br />
développement rural. Mali, 48pp.<br />
Musa Y. FG Demonstrates Commitment to <strong>Africa</strong>n <strong>Groundnut</strong> Commitment. Kano.<br />
http://www.thisdayonl<strong>in</strong>e.com/archive/2002/01/13/20020113stall.html.<br />
NESG. 2003. NESG xrays Nigeria’s agriculture. In: Bus<strong>in</strong>ess Day, Nigeria 2003-12-02<br />
10:05:16. http://www.bus<strong>in</strong>essdayonl<strong>in</strong>e.com/<strong>in</strong>dex.php?fArticleId=674<br />
Ntare B. 2002. The groundnut pyramids of Nigeria: Can they be revived? ICRISAT<br />
website: www.icrisat.org.<br />
Nouve K, Staatz J, Schweikhardt D and Yade M. 2002. Trad<strong>in</strong>g out of poverty: WTO<br />
agreements and the <strong>West</strong> <strong>Africa</strong>n agriculture. Michigan State University International<br />
Department of Agricultural Economics, Development Department of Economics.<br />
Work<strong>in</strong>g Paper No. 80.<br />
116
Onwueme IC and S<strong>in</strong>ha TD. 1991. Field Crop Production <strong>in</strong> Tropical <strong>Africa</strong>:<br />
Pr<strong>in</strong>ciples and Practice. Ede, Netherlands: CTA. 324-336 pp.<br />
Oosterman S. 2003. Global groundnut markets and prospects <strong>for</strong> Malawian exports.<br />
A Report to ICRISAT.<br />
Otsuki T, Wilson JS and Sewadeh M. 2001. What price precaution? European<br />
harmonisation of aflatox<strong>in</strong> regulations and <strong>Africa</strong>n groundnut exports. European<br />
Review of Agricultural Economics 28(3): 263-83.<br />
Purseglove JW. 1968, 1988. Tropical crops: Dicotyledons. Essex, UK: Longman. 224-<br />
236 pp.<br />
Rehm S and Espig G. 1991. The cultivated plants of the tropics and subtropics.<br />
Stuttgart: Verlag Josef Margraf. 97-101 pp.<br />
Revoredo CL and Fletcher S. 2002. World peanut market: An overview of the past 30<br />
years. Research Bullet<strong>in</strong> Number 437, Georgia Agricultural Experiment Stations,<br />
University of Georgia College of Agricultural and Environmental Sciences. 21 pp.<br />
www.ces.uga.edu/ES-pubs/RB437.htm<br />
Revoredo CL and Fletcher S. 2002. The US 2002 Farm Act and the effects on US<br />
groundnut exports. Mimeo: University of Georgia.<br />
Rucker RR and Thurman WN. 1990. The economic effects of supply controls: The<br />
simple analytics of the US Peanut Program. Journal of Law and Economics 33(2): 483-<br />
515.<br />
Shapouri, Shahla and Trueblood M. 2003. The <strong>Africa</strong>n Growth and Opportunity Act<br />
(AGOA): Does it really present opportunities? Contributed paper presented at the<br />
International Conference Agricultural policy re<strong>for</strong>m and the WTO: Where are we<br />
head<strong>in</strong>g? June 23-26, 2003, Capri, Italy.<br />
Simmonds N. 1994. Personal communication.<br />
Sissoko M. 1993. Description de la filière arachide au Mali. Programme SIRPAO -<br />
Mali : compte-rendu des travaux par thème. 31 pp.<br />
Sk<strong>in</strong>ner R. 1999. Issues fac<strong>in</strong>g the US peanut <strong>in</strong>dustry dur<strong>in</strong>g the Seattle round of the<br />
World Trade Organization. US Department of Agriculture, Economic Research<br />
Service. Wash<strong>in</strong>gton, DC.<br />
Van der Pijll M. 2003. Personal communication.<br />
Wa<strong>in</strong>io J and Gibson P. 2003. The significance of nonreciprocal trade preferences <strong>for</strong><br />
develop<strong>in</strong>g countries. Paper presented at the International Conference Agricultural<br />
policy re<strong>for</strong>m and the WTO: where are we head<strong>in</strong>g? June 23-26, 2003, Capri, Italy.<br />
117
118
FONDS COMMUN POUR LES PRODUITS DE BASE<br />
ICRISAT<br />
Document Technique du FCPB N° 39<br />
Opportunités Commerciales<br />
de L’Arachide en<br />
Afrique de L’Ouest<br />
Edité par<br />
BR Ntare, F Waliyar, M Ramouch, E Masters<br />
et J Ndjeunga<br />
ICRISAT
ii<br />
<strong>COMMON</strong> <strong>FUND</strong> FOR COMMODITIES<br />
Stadhouderskade 55, 1072 AB Amsterdam, The Netherlands<br />
Postal Address: P.O. Box 74656, 1070 BR Amsterdam, The Netherlands<br />
Tel: (31 20) 575 4949 • Fax: (31 20) 676 0231<br />
Telex 12331 cfc nl e-mail:Manag<strong>in</strong>g.Director@common-fund.org<br />
Website: www.common-fund.org<br />
Copyright © Common Fund <strong>for</strong> Commodities 2004<br />
The contents of this report may not be reproduced, stored <strong>in</strong> a data retrieval system or<br />
transmitted <strong>in</strong> any <strong>for</strong>m or by any means without prior written permission of the Common Fund<br />
<strong>for</strong> Commodities, except that reasonable extracts may be made <strong>for</strong> the purpose of comment or<br />
review provided the Common Fund <strong>for</strong> Commodities is acknowledged as the source.
AVANT PROPOS<br />
La production, le market<strong>in</strong>g et le commerce de l’arachide constituent des<br />
sources majeures d’emploi, de revenus et de devises dans beaucoup de pays<br />
Ouest <strong>Africa</strong><strong>in</strong>s. Les produits à base d’arachide ont une importance multiple<br />
pour des milliers de petits producteurs en Afrique de 1’Ouest. I1s<br />
representent 60% du revenu des populations rurales et occupent 70% de la<br />
ma<strong>in</strong> d’œuvre rurale au Sénégal et en Gambie. Le commerce de l’arachide<br />
reste cependant <strong>in</strong>stable, ce qui affecte sa compétitivité sur le marché<br />
mondial.<br />
Jusqu’à ma<strong>in</strong>tenant, les soutiens du Fonds Commun pour les Produits de<br />
Base et de l’ICRISAT se sont concentrés sur le developpement des<br />
technologies pour l’accroissement de la productivité de l’arachide et sa<br />
tolérance aux stress biotiques et abiotiques. Bien que cette recherche ait été<br />
un succès en ce qui conceme le développement de variétés per<strong>for</strong>mantes,<br />
l’attention doit se porter davantage sur les aspects de la demande. Il est clair<br />
que le marché est un des moteurs de l’adoption de ces nouvelles variétés.<br />
Cette nouvelle notion du développement technologique et de sa<br />
dissém<strong>in</strong>ation nécessite une identification des partenaires et des liens avec le<br />
marché, au-delà de l’idée que le marché est disponible si la production est<br />
bonne. Cette étude permet de faciliter ce processus.<br />
Beaucoup de facteurs expliquent la faible compétitivité de l’arachide sur<br />
le marché local, régional et <strong>in</strong>ternational. Ces facteurs <strong>in</strong>cluent la faible<br />
production et des normes plus strictes sur les niveaux et les règles, que la<br />
plupart des producteurs Ouest <strong>Africa</strong><strong>in</strong>s ont des difficultés à satisfaire. Les<br />
politiques locales limitent également le commerce de l’arachide. Cette étude<br />
fournit des <strong>in</strong><strong>for</strong>mations de base sur la production de l’arachide en Afrique de<br />
L’Ouest, sur les contra<strong>in</strong>tes à sa production, trans<strong>for</strong>mation et<br />
commercialisation, et ouvre des voies pour le marché de l’arachide et ses<br />
produits dérivés. E11e explore aussi les moyens d’augmenter la compétitivité<br />
de l’arachide sur le marché local, régional et <strong>in</strong>temational.<br />
Notre souhait est que cette publication soit utile à la production et le<br />
commerce de l’arachide, pour l’Afrique de l’Ouest, mais aussi pour l’ensemble<br />
des pays sub-sahariens où l’économie dépend essentiellement de l’agriculture.<br />
W.D. Dar<br />
Directeur Général, ICRISAT<br />
Amb. Ali Mchumo<br />
Directeur Général CFC<br />
iii
Table des matières<br />
Résumé ........................................................................................................ 1<br />
1.0 Introduction ......................................................................................... 4<br />
1.1 Le Commerce de l’Arachide et de ses sous-produits...................... 4<br />
2.0 Marchés ouest africa<strong>in</strong>s d’arachide ........................................................ 7<br />
2.1 Nouvelles tendances en production et consommation .................. 7<br />
2.2 Caractéristiques du marché de la zone d’étude ............................. 8<br />
2.3 Conclusions ................................................................................ 11<br />
2.4 Stratégies pour l’Afrique de l’Ouest ........................................... 13<br />
3.0 Pr<strong>in</strong>cipaux pays producteurs sur le marché <strong>in</strong>ternational .................... 17<br />
3.1 Introduction ............................................................................... 17<br />
3.2 Ch<strong>in</strong>e .......................................................................................... 18<br />
3.3 Les Etats-Unis d’Amérique ......................................................... 19<br />
3.4 Argent<strong>in</strong>e .................................................................................... 22<br />
3.5 Inde ............................................................................................ 23<br />
3.6 Vietnam ...................................................................................... 24<br />
3.7 Afrique du Sud ........................................................................... 24<br />
3.8 Autres Orig<strong>in</strong>es <strong>Africa</strong><strong>in</strong>es .......................................................... 25<br />
4.0 Tendances du marché mondial et conditions de qualité ...................... 27<br />
4.1 Introduction ............................................................................... 27<br />
4.2 Europe ........................................................................................ 28<br />
4.3 Les Etats-Unis d’Amérique ......................................................... 32<br />
4.4 Afrique du Sud ........................................................................... 35<br />
4.5 Pays asiatiques ............................................................................ 36<br />
5.0 Afrique de l’Ouest : profils des marchés du Sénégal, du Mali,<br />
du Niger et du Nigeria ........................................................................ 37<br />
5.1 Introduction ............................................................................... 37<br />
5.2 Sénégal ....................................................................................... 38<br />
5.3 Mali ............................................................................................ 45<br />
5.4 Niger .......................................................................................... 52<br />
5.5 Nigeria ........................................................................................ 58<br />
5.6 Statistiques des prix de l’arachide au Mali ................................... 65<br />
5.7 Observations supplémentaires ..................................................... 68<br />
6.0 Historique et méthodologie ............................................................... 70<br />
v
Annexes<br />
Annexe 1 : Analyse statistique du commerce mondial d’arachide ....... 77<br />
Annexe 2 : Liste de prix des échantillons, Aldebaran<br />
Commodities, Rotterdam ................................................. 88<br />
Annexe 3 : Politiques commerciales nationales actuelles<br />
du commerce d’arachide (2003) ....................................... 90<br />
Annexe 4 : Importations d’arachide américa<strong>in</strong>e<br />
sous l’AGOA, 2002 .......................................................... 92<br />
Annexe 5 : Aspects qualités des arachides dans le commerce ............. 93<br />
Annexe 6 : Aflatox<strong>in</strong>e chez l’arachide ................................................ 99<br />
Annexe 7 : l’Organisation mondiale de la santé sur les<br />
mycotox<strong>in</strong>es.................................................................... 101<br />
Annexe 8 : Acheteurs et <strong>in</strong>termédiaires européens d’arachide .......... 105<br />
vi<br />
Annexe 9 : Liste d’adresses des Etats-Unis<br />
(American Peanut Council) ............................................ 112
Résumé<br />
Le commerce d’arachide sur les marchés <strong>in</strong>ternationaux représente seulement<br />
4 à 6 % de la production mondiale. La grande majorité de cette production<br />
mondiale d’arachide est utilisée essentiellement pour la satisfaction des<br />
beso<strong>in</strong>s de consommation et les demandes des marchés domestiques. En<br />
général, les dernières décennies ont connu une augmentation de la<br />
consommation d’arachide pour divers usages, avec un profond revirement de<br />
l’arachide d’huilerie et du tourteau, pour lesquels il y a des substituts de<br />
produits (notamment le soja) vers l’arachide de confiserie, pour laquelle il n’y<br />
a aucun produit de substitution. Cependant, les normes de qualité du produit<br />
sont beaucoup plus sévères pour l’arachide de bouche, cette tendance<br />
implique une amérioration de la qualité du produit en particulier en termes<br />
d’Aspergillus, source d’aflatox<strong>in</strong>e.<br />
En général, le marché européen d’arachide s’est mo<strong>in</strong>s diversifié au cours<br />
de la décennie passée. Il a été mentionné que vers la f<strong>in</strong> des années 1990,<br />
certa<strong>in</strong>s décortiqueurs d’orig<strong>in</strong>e/fournisseurs ont vendu le produit à des<br />
<strong>in</strong>termédiaires pour les beso<strong>in</strong>s des <strong>in</strong>dustries de trans<strong>for</strong>mation et des<br />
supermarchés.<br />
Depuis le début des années 70, les modes de consommation d’arachide<br />
ont changé en Afrique de l’Ouest comme dans d’autres régions du monde.<br />
Pendant que la consommation totale en Afrique australe et orientale a<br />
dim<strong>in</strong>ué, l’utilisation d’arachide en Afrique de l’Ouest a augmenté<br />
sensiblement en raison du changement vers la consommation de l’arachide de<br />
bouche. Vers la f<strong>in</strong> des années 1980, en Afrique de l’Ouest l’arachide est<br />
devenue pr<strong>in</strong>cipalement une culture vivrière plutôt qu’un oléag<strong>in</strong>eux. Entre<br />
1972 et 2000, la quantité d’arachide ouest africa<strong>in</strong>e consommée comme<br />
culture vivrière a augmenté de plus de 209 %, tandis que les exportations<br />
dim<strong>in</strong>uaient précipitamment au cours de la même période.<br />
Le décl<strong>in</strong> des exportations africa<strong>in</strong>es d’arachide est lié au changement<br />
vers la production d’arachide de bouche, qui a été mal programmée à cause<br />
des restrictions croissantes d’aflatox<strong>in</strong>e a<strong>in</strong>si qu’à l’augmentation de produits<br />
de substitution en particulier le soja.<br />
Bien que tous les pays producteurs d’arachide soient exposés à la<br />
contam<strong>in</strong>ation d’aflatox<strong>in</strong>e, l’Afrique est particulièrement considérée comme<br />
un cas problématique par les acheteurs <strong>in</strong>ternationaux à cause du fait que la<br />
chaîne de production dans chaque pays (à l’exception de l’Afrique du Sud)<br />
1
soit fragmentée. Les systèmes de production n’ont pas été capables de faire<br />
face au problème – le suivi des <strong>in</strong>festations par l’aflatox<strong>in</strong>e est virtuellement<br />
<strong>in</strong>existant et les <strong>in</strong>spections avant embarquements sont perçus comme peu<br />
fiables.<br />
Malheureusement, le commerce <strong>in</strong>ternational de l’arachide est basé sur<br />
la confiance et la fiabilité en terme d’offre et de qualité du produit. Les<br />
normes actuelles de l’Union européenne sur l’aflatox<strong>in</strong>e ont certa<strong>in</strong>ement<br />
contribué à l’accroissement de la tendance conservatoire parmi les acheteurs<br />
européens, qui ne souhaitent prendre aucun risque sur les aspects concernant<br />
l’aflatox<strong>in</strong>e.<br />
Une conséquence économique directe et regrettable est que pour que<br />
l’Afrique de l’Ouest <strong>in</strong>tègre à nouveau le marché mondial de l’arachide<br />
(particulièrement celui de l’Europe, qui présente peut-être les plus grandes<br />
potentialités), les prix à l’exportation doivent pouvoir concurrencer ceux de<br />
l’arachide en provenance de la Ch<strong>in</strong>e, dont l’offre est abondante, bon marché<br />
et a une bonne réputation en terme de fiabilité de l’offre et de la qualité.<br />
Au vu des prix actuels de l’arachide de Ch<strong>in</strong>e qui sont de l’ordre de 650<br />
dollars la tonne – prix équivalent au coût moyen de production d’une tonne<br />
d’arachide de bouche (ARB) sous irrigation au Sénégal – les marges<br />
bénéficiaires actuelles et prévisibles ne sont en aucun cas favorables à la<br />
reprise des exportations ouest africa<strong>in</strong>es vers le marché mondial, même sans<br />
tenir compte de la qualité du produit et des perceptions des acheteurs<br />
<strong>in</strong>ternationaux.<br />
D’autre part, bien que les liens commerciaux ne soient pas assez bien<br />
établis (ou sont mo<strong>in</strong>s coûteux) comme entre l’Afrique de l’Ouest et l’Europe,<br />
le marché sud africa<strong>in</strong> représente une opportunité potentielle et significative<br />
pour les producteurs ouest africa<strong>in</strong>s. A cause de la mauvaise récolte<br />
enregistrée en 2003, l’Afrique du Sud est entra<strong>in</strong> d’importer de l’arachide de<br />
l’Afrique australe et même de l’Argent<strong>in</strong>e à des prix préférentiels – supérieurs<br />
à plus de 700 dollars la tonne d’arachide non triée (prix CAF) au Malawi. Il<br />
existe des possibilités d’accès au marché sud africa<strong>in</strong> une fois le problème de<br />
l’aflatox<strong>in</strong>e résolu par l’amélioration de la gestion et du suivi de la qualité des<br />
produits au niveau de la production.<br />
La conclusion primaire de cette étude est que des ressources doivent être<br />
allouées à l’amélioration de la filière de l’arachide dans chaque pays<br />
producteur, avec un accent particulier sur la satisfaction des beso<strong>in</strong>s tant<br />
nationaux, sous-régionaux que régionaux.<br />
2
Bien que les détails opérationnels d’un tel programme devraient être<br />
négociés au niveau de chaque pays – l’<strong>in</strong>tervention de l’état devant en tout état<br />
de cause rester limitée – les po<strong>in</strong>ts communs pourraient <strong>in</strong>clure la<br />
construction d’entrepôts publics et/ou de po<strong>in</strong>ts de collectes, dans lesquels la<br />
production serait triée, catégorisée et testée sur des caractéristiques telles que<br />
l’aflatox<strong>in</strong>e et d’autres normes de qualité.<br />
En évaluant les opportunités commerciales actuelles et futures pour<br />
l’arachide d’orig<strong>in</strong>e ouest africa<strong>in</strong>e, il serait important de capitaliser lentement<br />
et de manière délibérée sur les acquis du passé (<strong>in</strong>cluant la disponibilité de<br />
semences améliorées à travers le présent projet), tout en accordant une<br />
attention particulière à la chaîne de production – spécialement sur les aspects<br />
concernant les pratiques culturales, les méthodes de récolte et les techniques<br />
post-récoltes qui pourraient réduire les <strong>in</strong>fections par l’Aspergillus, et de ce<br />
fait améliorer la qualité des produits.<br />
Il est donc vivement recommandé que le projet actuel et l’ICRISAT<br />
considèrent comme axe prioritaire la mise en place d’un programme sousrégional<br />
harmonisé pour lever les contra<strong>in</strong>tes d’ordre technique au niveau des<br />
petits exploitants agricoles de l’Afrique de l’ouest qui constituent des<br />
obstacles au développement des exportations et exposent les populations des<br />
pays à des risques croissants de détérioration de leur santé à travers la<br />
consommation d’arachides contam<strong>in</strong>ées par l’aflatox<strong>in</strong>e.<br />
Avec la mise en place d’un tel programme, un système de certification de<br />
la qualité des produits pourrait être développé en collaboration avec les<br />
laboratoires d’analyses nationaux et <strong>in</strong>ternationaux.<br />
Pour le moment, le projet pourrait aider à développer des opportunités<br />
de commercialisation à l’<strong>in</strong>térieur des pays et de la région grâce au bon suivi de<br />
l’offre en arachide et de la collecte de l’<strong>in</strong><strong>for</strong>mation sur les prix des marchés<br />
locaux et nationaux, et faciliter la diffusion de telles <strong>in</strong><strong>for</strong>mations aux<br />
pr<strong>in</strong>cipaux acteurs à l’aide de radios rurales et autres moyens de<br />
communications appropriés.<br />
3
4<br />
1.0 Introduction<br />
La présente étude a été commanditée par l’ICRISAT avec l’appui du Fonds<br />
commun pour les produits de base (CFC). L’étude a été réalisée aux Etats-<br />
Unis, en Afrique et en Europe, du 16 ju<strong>in</strong> au 15 décembre 2003. Les résultats<br />
ont été présentés à l’ICRISAT à la réunion annuelle du projet<br />
« Développement de systèmes semenciers durables pour l’arachide en Afrique<br />
de l’Ouest » f<strong>in</strong>ancé par le CFC.<br />
1.1 Le Commerce de l’Arachide et de ses sousproduits<br />
Arachis hypogea (également connue sous le nom d’arachide) est une plante<br />
domestique, une légum<strong>in</strong>euse riche en huile et proté<strong>in</strong>es, qui est apparentée<br />
avec l’espèce sauvage Arachis, espèce locale endémique au Brésil, en Bolivie,<br />
en Uruguay et au nord de l’Argent<strong>in</strong>e. Le commerce mondial de l’arachide a<br />
commencé avec l’extraction <strong>in</strong>dustrielle de son huile à Marseille au milieu du<br />
19 e siècle (Purseglove 1968, 1988).<br />
L’arachide est commercialisée sous plusieurs <strong>for</strong>mes et les pr<strong>in</strong>cipaux<br />
marchés ciblent chacun différents modes de consommation. L’arachide est<br />
désignée selon le type ou la variété (terme utilisé ici dans son sens générique<br />
décrivant un type physique, plutôt qu’un synonyme de « cultivar »), et la taille<br />
des gra<strong>in</strong>es passant par un ensemble d’écrans qui sont calibrés en fonction du<br />
nombre de gousses par once. L’arachide connue sous le label « 40/50 » (la plus<br />
répandue sur le marché mondial et de taille moyenne) est composée de 40 à<br />
50 gra<strong>in</strong>es par once.<br />
Les trois types d’arachides de base sont le type Virg<strong>in</strong>ia (variété grosse<br />
gousse, utilisée dans l’<strong>in</strong>dustrie sous <strong>for</strong>me grillage et dest<strong>in</strong>ée aux snack), le<br />
type Runner (gousse taille moyenne, généralement utilisée en confiserie et<br />
comme pâte d’arachide) et le type Spanish/Valencia (plus petite, de <strong>for</strong>te<br />
teneur en huile et également utilisée en confiserie et comme pâte d’arachide).<br />
La <strong>for</strong>me d’arachide la plus commercialisée est l’arachide en coque, qui<br />
constitue la majorité des transactions dans les pays producteurs et sur le plan<br />
<strong>in</strong>ternational. En seconde position arrive l’arachide décortiquée, en termes de<br />
volume d’échanges.<br />
Les produits d’arachide peuvent être divisés entre les arachides de<br />
bouche, également connues comme arachides de confiserie, qui sont
entièrement commercialisées pour une trans<strong>for</strong>mation ultérieure, et les<br />
arachides d’huilerie dest<strong>in</strong>ées à la production de l’huile vegetal. Environ les<br />
deux tiers de la production mondiale d’arachides sont utilisés pour la<br />
production d’huile. Les pr<strong>in</strong>cipaux pays exportateurs d’arachide d’huilerie ont<br />
toujours été le Sénégal et l’Argent<strong>in</strong>e. L’Inde a récemment ré<strong>in</strong>tégré dans le<br />
marché mondial, suite à la hausse exceptionnelle des prix en 2003. Ce volet<br />
sera discuté plus dans la section 3.5.<br />
Autant la teneur en huile de la gra<strong>in</strong>e varie entre 38 à 47 % pour la<br />
confiserie et 47 à 55 % pour les variétés d’huilerie, autant le rendement en<br />
huile est sensiblement égal à celui du tourteau. Les normes de qualité pour les<br />
oléag<strong>in</strong>eux sont de lo<strong>in</strong> <strong>in</strong>férieurs à ceux de l’arachide de bouche et le tourteau<br />
d’arachide peut être chimiquement détoxifié des résidus d’aflatox<strong>in</strong>e par un<br />
processus <strong>in</strong>dustriel simple (Kettlewell 2003). Tandis que les prix de l’huile<br />
d’arachide sont demeurés sensiblement constants au cours des 25 dernières<br />
années, ceux des tourteaux d’arachide ont régulièrement dim<strong>in</strong>ué, en grande<br />
partie à cause de la concurrence du soja (Freeman et al. 1999). Durant la<br />
campagne 1999-2000, 30 % de l’huile d’arachide consommée dans le monde<br />
provenaient de l’Afrique (dont 14% du Sénégal). Il en est de même de 40% du<br />
tourteau d’arachide utilisé dans le monde, dont les 15 % sont fournis par le<br />
Sénégal (Ntare et al. 2003).<br />
La teneur en proté<strong>in</strong>es de l’arachide varie de 24 à 35 %, et celui du<br />
tourteau de 40 à 50 % (Rehm et Espig 1991). En plus de la production<br />
<strong>in</strong>dustrielle d’huile d’arachide au Niger, au Sénégal et au Nigeria, l’extraction<br />
dans les ménages ou sous <strong>for</strong>me artisanale demeure une activité économique<br />
importante, en particulier pour les femmes rurales. Après l’extraction de<br />
l’huile, le tourteau d’arachide est employé dans la fabrication d’aliments de<br />
bétail, mais il peut également être utilisé dans l’alimentation huma<strong>in</strong>e, telles<br />
que le kulikuli qui est fait à base de pâte d’arachide (un sous-produit<br />
d’extraction traditionnelle) par des femmes au Niger et au Nigeria et dest<strong>in</strong>é à<br />
la consommation locale et la vente. Les arachides de bouche peuvent subir un<br />
blanchiment par dépelliculage des gra<strong>in</strong>es par immersion dans l’eau. La<br />
plupart des arachides de bouche sont grillées mais certa<strong>in</strong>es font l’objet d’une<br />
trans<strong>for</strong>mation avancée, par exemple avec l’addition d’enrobages pour des<br />
beso<strong>in</strong>s de l’<strong>in</strong>dustrie de snacks (qui exige une taille et une <strong>for</strong>me<br />
particulièrement consistantes), et pour produire la pâte d’arachide, qui est<br />
également commercialisé (et accepté) comme produit. Environ 25 % de<br />
l’arachide utilisée sur le marché mondial est torréfiée, salée et consommée<br />
5
sous <strong>for</strong>me de snack. Plus de la moitié de l’arachide consommée aux USA l’est<br />
sous <strong>for</strong>me de pâte d’arachide (Onwueme et S<strong>in</strong>a 1991).<br />
Dans les pays producteurs, l’arachide est également commercialisée en<br />
verte, sous <strong>for</strong>me de gra<strong>in</strong>e fraîche et de semence.<br />
Dans les marchés <strong>in</strong>ternationaux, l’arachide de qualité médiocre est<br />
utilisée dans la fabrication d’aliments de bétail et de volaille.<br />
L’arachide est généralement exportée dans des sacs de 50 kg, dans des<br />
cargaisons m<strong>in</strong>imales de 18 à 22 tonnes (respectivement en conta<strong>in</strong>er<br />
d’arachide coque et d’arachide décortiquée). Les acheteurs exigent<br />
généralement un certificat phytosanitaire venant d’un laboratoire agréé.<br />
Cependant, une certification supplémentaire peut être requise pour s’assurer<br />
que le produit a été traité par fumigation avec un <strong>in</strong>secticide comme le<br />
phosphure d’alum<strong>in</strong>ium. Cette dernière condition a été identifiée comme une<br />
contra<strong>in</strong>te majeure au développement d’un commerce <strong>in</strong>ternational de<br />
l’arachide organique, pour laquelle les marges bénéficiaires ne sont pas<br />
toujours garanties (R. Kettlewell 2003).<br />
En effet, les importations mondiales d’arachide de confiserie se sont<br />
développées de manière extraord<strong>in</strong>aire, on observe une augmentation de 83 %<br />
des années 1979/81 aux années 1994/96 (Freeman et al. 1999). Cependant,<br />
comme les normes de qualité du produit sont élevées pour l’arachide de<br />
bouche, cette tendance a entraîné une demande plus accrue en qualité (en<br />
particulier par rapport à l’Aspergillus qui produit l’aflatox<strong>in</strong>e substance tox<strong>in</strong><br />
et cancérigène (voir annexe 6, les aspects de qualité dans la commercialisation<br />
de l’arachide).<br />
6
2.0 Marchés ouest africa<strong>in</strong>s d’arachide<br />
2.1 Nouvelles tendances en production et<br />
consommation<br />
Depuis le début des années 1970, les modes de consommation d’arachide ont<br />
évolué. Tandis que la consommation totale en Afrique australe et orientale a<br />
chuté, l’utilisation de l’arachide en Afrique de l’ouest a augmenté<br />
sensiblement en la faveur de produits de consommation. Depuis la f<strong>in</strong> des<br />
années 1980, en Afrique de l’Ouest, l’arachide est devenue pr<strong>in</strong>cipalement<br />
une culture vivrière plutôt qu’un oléag<strong>in</strong>eux, comme <strong>in</strong>diqué dans le tableau<br />
ci-dessous. Entre 1972 et 2000, la quantité d’arachides consommées sous<br />
<strong>for</strong>me de culture vivrière a augmenté de 209 % (Tableau 1).<br />
Tableau 1: Utilisation de l’arachide en Afrique de l’Ouest sur une moyenne de c<strong>in</strong>q<br />
ans, 1972-2000.<br />
1972-75 1976-80 1981-85 1986-90 1991-95 1996-2000<br />
Arachide Consommée 2,520,000 2,498,000 2,498,000 2,722,000 3,050,000 4,215,000<br />
(la tonne)<br />
Pourcentage consommé 29.9 % 36.0 % 43.3 % 44.5 % 51.0 % 55.3 %<br />
dans l’alimentation :<br />
Pourcentage trans<strong>for</strong>mé : 61.3 % 53.4 % 43.2 % 45.1 % 37.3 % 32.5 %<br />
Pourcentage semences,<br />
tourteaux et déchets : 8.9 % 10.7 % 13.5 % 10.5 % 11.7 % 12.2 %<br />
De : Revoredo et Fletcher 2002.<br />
Les critères commerciaux ont également significativement évolué durant<br />
la même période. De 1972 à 1975, les pays du projet ont eu un profil<br />
important sur le marché <strong>in</strong>ternational, tenant ensemble 14,5 % de part du<br />
marché mondial d’exportation (Nigeria 7,3 %, Sénégal 4,6 %, Mali 2,1 % et<br />
Niger 1,6 %). Jusqu’en 1996-2000, seul le Sénégal restait sur le marché<br />
<strong>in</strong>ternational, avec seulement 0,6 % des exportations mondiales (Revoredo et<br />
Fletcher 2002), dont 90 % étaient dest<strong>in</strong>ées à l’Union européenne.<br />
Le décl<strong>in</strong> des exportations africa<strong>in</strong>es d’arachide est lié au changement<br />
vers la production d’arachide de bouche, qui a été mal programmée à cause<br />
des restrictions croissantes d’aflatox<strong>in</strong>e a<strong>in</strong>si qu’à l’augmentation de produits<br />
de substitution dans l’<strong>in</strong>dustrie par d’autres huiles, en particulier le coton et le<br />
soja.<br />
7
2.2 Caractéristiques du marché de la zone d’étude<br />
Etant donné que le marché du Sénégal fonctionne selon ses propres structures<br />
et procédures, avec une demande nette globale selon sa base <strong>in</strong>dustrielle, ceux<br />
de la Gambie, du Mali et du Niger constituent des fournisseurs nets<br />
d’arachide pour satisfaire le surplus de demande des marchés sénégalais et<br />
nigérians. Ceci ne doit pas trop simplifier les rapports commerciaux<br />
complexes discutés dans cette section. Le marché est toujours basé en grande<br />
partie sur la demande d’oléag<strong>in</strong>eux et de tourteaux d’arachide, mais la<br />
tendance des 30 dernières années va de plus en plus vers l’arachide de bouche.<br />
Dans chacun des pays étudiés, la qualité de l’arachide est déterm<strong>in</strong>ée par<br />
sa condition (particulièrement sa teneur en humidité) en plus d’autres<br />
caractéristiques (teneur en huile et taille de la gousse).<br />
Les résultats de l’étude effectuée en Afrique de l’Ouest <strong>in</strong>diquent que<br />
les marchés nationaux couvrent diverses préférences des acheteurs aussi bien<br />
sur le plan national qu’une partie sous-régionale, par exemple des<br />
commerçants nigérians achetant sur les marchés de Maradi et de Niamey.<br />
Une teneur élevée en huile était la meilleure caractéristique citée par les<br />
acheteurs, mais d’autres attributs de certa<strong>in</strong>es variétés « traditionnelles » sont<br />
également appréciés des commerçants régionaux. Les acheteurs semblent<br />
montrer une préférence générale pour des grosses amandes (1 à 2 par coque)<br />
plutôt que les variétés précoces, bien que d’autres aient exprimé une<br />
préférence pour les petites de type rouge (Spanish), qui sont perçues comme<br />
ayant un plus faible taux d’humidité.<br />
Les tendances globales (discutées ci-dessus et plus en détail dans la<br />
section 4), montrent un grand changement de l’arachide comme culture<br />
oléag<strong>in</strong>euse, vers un produit comestible d’une grande variation de préférences<br />
du commerce et du consommateur. Bien que l’arachide sous <strong>for</strong>me<br />
d’oléag<strong>in</strong>eux dom<strong>in</strong>e toujours les marchés nationaux dans chacun des pays<br />
étudiés, les <strong>in</strong><strong>for</strong>mations par pays montrent une augmentation des prix, mais<br />
l’importance de ce prix « préférentiel » n’est pas <strong>for</strong>tement rémunératrice<br />
compte tenu des coûts élevés de production.<br />
Les tendances vers l’arachide de bouche reflètent (ou sont<br />
symptomatiques) des ga<strong>in</strong>s du marché réalisés par le soja sur le marché global<br />
sur une période de 30 ans, en tant que concurrent de l’arachide comme gra<strong>in</strong>e<br />
oléag<strong>in</strong>euse et source de nourriture (Revoredo et Fletcher 2002).<br />
8
En Afrique de l’Ouest, la concurrence la plus importante est celle d’avec<br />
la gra<strong>in</strong>e de coton, dont la production augmente au Mali et au Nigéria, bien<br />
que l’huile de palme et le soja soient également des concurrents puissants. La<br />
production du sésame est également en augmentation au Niger et au Nigeria<br />
(Njeunga, Ntare et Schill<strong>in</strong>g 2002). Comme l’arachide, (à un plus grand degré<br />
le soja), le sésame a un grand potentiel pour satisfaire les beso<strong>in</strong>s alimentaires<br />
aussi bien que les potentiels du marché comme oléag<strong>in</strong>eux et culture vivrière.<br />
Malheureusement, l’Afrique de l’Ouest est mal située pour satisfaire la<br />
demande de l’arachide de bouche, à mo<strong>in</strong>s qu’un engagement soit pris pour<br />
aborder les problèmes de chaîne d’approvisionnement, de qualité post-récolte<br />
et de traitement du produit.<br />
Le marché sous-régional est contra<strong>in</strong>t par les coûts élevés de transaction,<br />
parmi lesquels le plus important demeure le transport, qui compte pour plus<br />
de la moitié des coûts de transaction (55 % du commerce régional ou frontalier<br />
et plus de 70 % de l’arachide échangée sur le plan national). Ces estimations<br />
sont con<strong>for</strong>mes aux études de Camara 1992, Gaye 1992, Savadogo et al.<br />
1992, et Gabre-Mahd<strong>in</strong> et al. 1992, comme cité par Barry et al. : « les coûts de<br />
transport représentent plus de la moitié des coûts totaux de transfert des<br />
produits agricoles en Afrique de l’Ouest ».<br />
Les frais de transport pour la région de Dosso au Niger ont également été<br />
estimés entre 6 et 20 fCFA/dt*km au cours d’une étude précédente (Abele<br />
2000).<br />
Bien que la plupart des répondants aient exprimé un <strong>for</strong>t désir d’éviter de<br />
ne stocker que le nécessaire, (dû aux considérations de qualité, de teneur en<br />
humidité et de produits connexes), les coûts de stockage ne se sont pas avérés<br />
aussi importants que ceux liés au transport et autres coûts y afférants.<br />
Les coûts du commerce de l’arachide aux plan national et régional ont été<br />
étudiés au Niger, où l’<strong>in</strong><strong>for</strong>mation la plus détaillée a été obtenue sur le marché<br />
(et a été corroborée). Un modèle a été établi sur la base des entretiens avec<br />
des commerçants sur les marchés nationaux. Un commerçant de niveau<br />
moyen de Niamey vend 5.000 sacs d’arachide (coque) tous les ans, à une<br />
valeur moyenne de 9.500 fCFA. Basé sur les coûts de transport, de stockage,<br />
de droits du marché et autres coûts, les coûts de transaction d’un sac<br />
d’arachide obtenu localement revient à 615 fCFA de plus que le prix chez le<br />
paysan. Tandis que les coûts de transaction d’un sac obtenu à la frontière<br />
revient à 2.615fCFA, un facteur de plus de 4.<br />
9
Tableau 2 : Analyse des coûts de transaction<br />
Tandis que le coût total de transaction comprenait seulement 7 % de la<br />
valeur du sac d’arachide (coque), sur le marché régional (où une seule<br />
frontière a été traversée), ce coût s’élève à plus de 27 %.<br />
Il est important de noter que les figures ci-dessus représentent les coûts<br />
globaux de transaction et ne sont pas nécessairement soutenus par un seul<br />
parti (c.-à-d. le commerçant lui-même). Tandis que les frais de transport vers<br />
les marchés sur le plan national sont généralement à la charge des vendeurs<br />
(c.-à-d. les acheteurs primaires, ou des producteurs eux-mêmes), le<br />
commerce régional est entrepris par les spécialistes qui jugent les demandes<br />
selon les préférences des consommateurs, par exemple en Côte d’Ivoire pour<br />
la variété 47-10, connue pour sa teneur élevée en huile.<br />
Un manque d’<strong>in</strong><strong>for</strong>mation fiable sur le prix et l’approvisionnement (a<strong>in</strong>si<br />
que les taux de change) font partie des risques et augmentent les coûts de<br />
transaction pour les producteurs aussi bien que pour les commerçants.<br />
10<br />
Pourcentage du coût total des transactions<br />
Coûts de transaction national à l’exportation<br />
Sac 16 % 3 %<br />
Taxe du marché 0.08 % -<br />
Stockage 9 % 2 %<br />
Chargeurs - 38 %<br />
Véhicule 73 % 17 %<br />
Sous total transport : 73 % 55 %<br />
Pourcentage de la valeur moyenne du produit<br />
Coûts de transaction national à l’exportation<br />
Sac 1 % 1 %<br />
Taxe du marché 0.05 % 0.05 %<br />
Stockage 0.60 % 0.60 %<br />
Chargeurs - 10 %<br />
Véhicule 4 % 4 %<br />
Sous total transport : 4 % 14 %
2.3 Conclusions<br />
Confronté à la concurrence d’autres oléag<strong>in</strong>eux et à la demande accrue<br />
d’arachide de bouche (sur une échelle globale a<strong>in</strong>si qu’en Afrique de l’Ouest),<br />
les tendances du marché favorisent une diversité de marché, y compris pour<br />
les oléag<strong>in</strong>eux et l’arachide de bouche (ARB).<br />
Oléag<strong>in</strong>eux et culture vivrière<br />
Etant un oléag<strong>in</strong>eux a<strong>in</strong>si qu’une culture vivrière, l’arachide est en perte<br />
constante face à ses pr<strong>in</strong>cipaux concurrents que sont le coton et le soja et cette<br />
tendance n’est pas prête d’être <strong>in</strong>versée dans l’immédiat. Cependant, en dépit<br />
d’un marché en grande partie non profitable pour les producteurs, les<br />
avantages comparatifs de l’arachide sont l’existence des débouchés de marché<br />
<strong>for</strong>mels et non-<strong>for</strong>mels bien établis (le plus souvent non satisfaits) et une<br />
demande <strong>in</strong>dustrielle régulière, en plus de l’importance de l’arachide dans le<br />
régime alimentaire en Afrique de l’Ouest, ce qui n’est pas le cas du coton ni du<br />
soja.<br />
La gra<strong>in</strong>e de coton représente un sous-produit de récolte plus<br />
rémunérateur que l’arachide, elle est de ce fait en position de la concurrencer<br />
comme oléagn<strong>in</strong>eux, mais comme culture vivrière, elle est mo<strong>in</strong>s appréciée<br />
compte tenu de sa faible teneur en proté<strong>in</strong>es et des traces de gossypol<br />
polyphenol qu’elle contient, auquel les poulets en particulier sont sensibles.<br />
Bien que le soja contienne une teneur plus élevée en proté<strong>in</strong>es que<br />
l’arachide, son utilisation comme aliment en Afrique de l’Ouest n’est pas bien<br />
établie. Bien qu’elle puisse être acceptée sur les marchés urba<strong>in</strong>s, l’huile du<br />
soja ne satisfait pas les préférences de goût de ceux qui préfèrent l’huile<br />
d’arachide sur les marchés locaux.<br />
Le sésame est plus une culture vivrière qu’un oléag<strong>in</strong>eux, avec mo<strong>in</strong>s de<br />
sous-produits et de débouchés sur le marché que l’arachide.<br />
Etant donné le statut de subsistence de la majorité des paysans ouest<br />
africa<strong>in</strong>s, l’arachide offre plus de polyvalence comme culture vivrière bien<br />
établie (à la différence de la gra<strong>in</strong>e de coton et du soja) avec une diversité de<br />
débouchés sur le marché (à la différence du sésame).<br />
Le rôle « traditionnel » important tenu par l’arachide dans les cuis<strong>in</strong>es et<br />
sur les marchés de l’Afrique de l’Ouest est susceptible de lui préserver une<br />
part considérable du marché comme gra<strong>in</strong>e oléag<strong>in</strong>euse et tourteaux en plus<br />
de la part de marché croissant de l’arachide de bouche.<br />
11
Arachide de bouche<br />
Tandis que le sous-secteur ouest africa<strong>in</strong> d’arachide comme oléag<strong>in</strong>eux et<br />
culture vivrière est assailli par la concurrence, comme arachide de bouche, le<br />
produit n’a aucune concurrence directe – c’est un produit très spécifique dans<br />
la confiserie et d’autres débouchés – elle a une teneur élevée en proté<strong>in</strong>es et<br />
est répandue dans le régime alimentaire de l’Afrique de l’Ouest.<br />
Cependant, en dépit de son grand potentiel, le marché de l’arachide de<br />
bouche est confronté à un souci de qualité en termes d’<strong>in</strong>fection par<br />
l’Aspergillus, engendrant un risque élevé et une ma<strong>in</strong> d’œuvre supplémentaire<br />
pour le producteur, deux problèmes difficiles à mesurer.<br />
L’aflatox<strong>in</strong>e représente non seulement une barrière pour l’exportation,<br />
mais également un problème important pour la santé publique, car dans<br />
certa<strong>in</strong>s cas, l’arachide fournit une plus grande part de proté<strong>in</strong>e diététique que<br />
la viande.<br />
La gestion de la qualité de l’offre en ce qui concerne l’aflatox<strong>in</strong>e un est<br />
défi pour les producteurs car cela nécessitera des <strong>in</strong>vestissements dans les<br />
méthodes améliorées de traitement des récoltes, des semences de qualité et<br />
autres <strong>in</strong>trants, en dépit du faible pouvoir économique de la majorité des<br />
paysans producteurs d’arachide.<br />
En général, les paysans de chacun des quatre pays étudiés n’aiment pas<br />
prendre de risque, préférant subvenir aux beso<strong>in</strong>s de subsistance plutot qu’à la<br />
demande du marché. La grande majorité des ventes dans chaque contrée a lieu<br />
juste après la récolte, (quand les prix sont au plus bas) réflétant en partie le<br />
paiement des dispositifs de crédit et autres dettes accumulées, y compris<br />
celles qui se sont accumulées suite à l’achat de produits vivriers pour<br />
compléter ceux cultivés par le ménage. Les coûts de transaction sont élevés,<br />
en particulier le transport et les <strong>for</strong>malités aux frontières en ce qui concerne le<br />
commerce régional.<br />
Une source importante de risque et de coûts plus élevés de transaction<br />
est généralement dûe au manque d’<strong>in</strong><strong>for</strong>mation sur les prix et de l’offre au<br />
niveau des producteurs et des petits commerçants. Cet aspect étant assez<br />
problématique sur les marchés nationaux, le coût élevé des frais pour traverser<br />
les frontières et le transport augmentent considérablement les coûts des<br />
produits dont l’achat ou la vente sont faiblement programmés.<br />
12
2.4 Stratégies pour l’Afrique de l’Ouest<br />
Bien que tous les pays producteurs d’arachide soient exposés à l’<strong>in</strong>cidence de<br />
l’aflatox<strong>in</strong>e, l’Afrique est en particulier considéré comme problématique par<br />
les acheteurs <strong>in</strong>ternationaux. En effet, la filière de chaque pays (exception<br />
faite de l’Afrique du sud) est fragmentée, les systèmes de production sont<br />
<strong>in</strong>efficaces pour lutter contre le problème, le suivi des cultures pour la<br />
contam<strong>in</strong>ation par l’aflatox<strong>in</strong>e est virtuellement <strong>in</strong>existant et les services<br />
d’<strong>in</strong>spection avant embarquement sont perçus comme non fiables.<br />
Malheureusement, le commerce <strong>in</strong>ternational de l’arachide est basé sur<br />
la confiance et la fiabilité en terme d’offre et de qualité du produit. Les<br />
normes actuelles de l’Union européenne sur l’aflatox<strong>in</strong>e ont certa<strong>in</strong>ement<br />
contribué à l’accroissement de la tendance conservatrice parmi les acheteurs<br />
européens, pour lesquels il ne sera pas nécessaire de prendre des risques à<br />
l’égard de l’aflatox<strong>in</strong>e.<br />
Une conséquence économique regrettable et directe est que, pour que<br />
l’Afrique de l’Ouest regagne le marché mondial de l’arachide (et<br />
particulièrement le marché européen, qui offre peut-être le plus grand<br />
potentiel), les prix à l’exportation doivent pouvoir concurrencer l’arachide en<br />
provenance de la Ch<strong>in</strong>e, dont l’offre est abondante, bon marché et a une<br />
bonne réputation favorable en termes de fiabilité de d’offre et de la qualité.<br />
Comme les prix actuels de l’arachide de Ch<strong>in</strong>e sont de l’ordre de 650$<br />
par tonne métrique – équivalent au coût moyen de production d’une tonne<br />
d’arachide de bouche (ARB) sous irrigation au Sénégal, les marges<br />
bénéficiaires actuelles et envisageables ne sont en aucun cas favorable à la<br />
ré<strong>in</strong>tégration des exportations ouest africa<strong>in</strong>es sur le marché mondial, et<br />
même sans tenir compte de la qualité du produit et des mêmes perceptions<br />
parmi les acheteurs <strong>in</strong>ternationaux.<br />
D’autre part, bien que les liens commerciaux ne soient pas aussi bien<br />
établis (ou mo<strong>in</strong>s coûteux) comme entre l’Afrique de l’Ouest et l’Europe, le<br />
marché sud africa<strong>in</strong> représente une opportunité potentielle et significative<br />
pour les producteurs ouest africa<strong>in</strong>s. A cause de la mauvaise récolte de 2003,<br />
l’Afrique du Sud est entra<strong>in</strong> d’importer de l’arachide d’Afrique australe et<br />
même d’Argent<strong>in</strong>e à des prix préférentiels – à plus de 700 $ par tonne<br />
métrique (non triée et CAF) au Malawi. Il peut avoir des possibilités d’accès<br />
au marché sud africa<strong>in</strong> une fois que le problème de l’aflatox<strong>in</strong>e sera résolu par<br />
l’amélioration de la gestion et du suivi de la qualité des produits au niveau de la<br />
production.<br />
13
La conclusion primaire de cette étude est que des ressources doivent être<br />
allouées à l’amélioration de la filière de l’arachide dans chaque pays<br />
producteur, avec un accent particulier sur la production pour satisfaire les<br />
demandes nationales, sous-régionales et même régionales.<br />
Alors que les détails opérationnels d’un tel programme seraient à<br />
négocier au niveau de chaque pays – l’<strong>in</strong>tervention de l’état restant<br />
probablement limitée – les caractéristiques communes pourraient <strong>in</strong>clure la<br />
construction d’entrepôts publics et/ou de po<strong>in</strong>ts d’achats, dans lesquels la<br />
production sera triée, catégorisée et testée pour la contam<strong>in</strong>ation par<br />
l’aflatox<strong>in</strong>e et d’autres normes de qualité.<br />
En évaluant les opportunités de marché actuelles et envisageables pour<br />
l’arachide d’orig<strong>in</strong>e ouest africa<strong>in</strong>e, il sera important de capitaliser lentement<br />
et délibérément sur les acquis (<strong>in</strong>cluant la disponibilité de semences<br />
améliorées à travers le présent Projet), avec une attention particulière sur le<br />
sous-secteur de la production – spécifiquement les pratiques culturales, les<br />
méthodes de récolte et les techniques post-récolte qui réduiraient l’<strong>in</strong>fection<br />
des produits par l’Aspergillus, et de ce fait assurer la qualité des produits.<br />
Les recommandations suivantes sont faites sur la base des entrevues avec<br />
beaucoup d’acteurs, des paysans producteurs des pays ciblés, en passant par<br />
les acheteurs d’arachide et les <strong>in</strong>termédiaires européens :<br />
14<br />
en termes de potentiel d’exportation de l’arachide ouest africa<strong>in</strong>e vers<br />
l’Europe, il est important de noter que l’<strong>in</strong>spection avant l’embarquement<br />
et la certification ne sont pas universellement acceptées par les acheteurs<br />
européens – y compris la certification à la fois par le Service<br />
gouvernemental d’<strong>in</strong>spection et par une compagnie contractée par les<br />
importateurs. La grande importance de la réputation – d’une donnée sûre<br />
de per<strong>for</strong>mance responsable – ne peut être surestimée ;<br />
dans le but d’<strong>in</strong>itier une relation d’exportation avec un acheteur européen,<br />
par exemple, il serait alors nécessaire pour une entité d’exportation de<br />
rassembler au m<strong>in</strong>imum un conta<strong>in</strong>er de commande d’arachide –<br />
typiquement 18 TM d’arachide coque ou 22 TM d’arachide décortiquée –<br />
et payer les frais de transit et d’embarquement du produit au port de<br />
l’acheteur (probablement Rotterdam). Si, après analyse en transit,<br />
l’embarcation est approuvée (certifiée) comme « propre », le prix d’achat et<br />
les coûts de transport seront joyeusement payés par l’acheteur – et un<br />
important précédent serait établi ;
premièrement, l’entité d’exportation doit chercher à identifier les arachides<br />
exemptes d’aflatox<strong>in</strong>e. Cela peut être obtenu localement, à travers une<br />
coopérative ou même chez un paysan <strong>in</strong>dividuel. L’avantage, c’est d’être<br />
capable d’offrir des arachides exemptes d’aflatox<strong>in</strong>e même en petites<br />
quantités (au m<strong>in</strong>imum 18-22 TM). Ceci peut entraîner les importateurs à<br />
prendre le risque d’acheter sur un po<strong>in</strong>t de vente non homologué ;<br />
il y a un avantage considérable à fournir de l’arachide égoussée<br />
manuellement et triée (HPS), comme c’est le cas en Afrique de l’Ouest.<br />
Les standards de production peuvent fausser quand les technologies de<br />
calibrage mécanique sont employées, comme ce fût le cas récemment en<br />
Afrique du Sud ;<br />
si les arachides exemptes d’Aflatox<strong>in</strong>e ne sont pas disponibles en quantités<br />
suffisantes pour rassembler un m<strong>in</strong>imum d’expédition de 18-22 TM, il<br />
serait plus sensible de se tourner vers un sous-secteur différent du marché<br />
<strong>in</strong>ternational – soit l’aliment pour bétail, l’aliment pour la volaille ou le<br />
stock d’huile, chacun de ces aliments autorisant des niveaux de<br />
contam<strong>in</strong>ation par l’aflatox<strong>in</strong>e successivement plus élevés.<br />
étant donné l’importance de la « traçabilité » des po<strong>in</strong>ts d’orig<strong>in</strong>e à l’égard la<br />
confiance et la fiabilité en la qualité, il est plus important pour un<br />
exportateur donné de traiter de façon responsable le problème de la qualité<br />
du produit que d’essayer de soutenir un produit de faible qualité vers<br />
l’importation. Etant donné la grande rigueur des services d’<strong>in</strong>spection en<br />
transit (particulièrement sur les ports européens), on peut être quasi<br />
certa<strong>in</strong> que tous les problèmes de qualité seront notés – et si cela <strong>in</strong>tervient<br />
par surprise à l’acheteur, il est peu probable que le vendeur obtiendra une<br />
seconde chance dans les conditions actuelles et envisageables du marché ;<br />
il est donc <strong>for</strong>tement recommandé que le projet et l’ICRISAT considèrent<br />
la mise en place d’un programme sous-régional harmonisé pour lever les<br />
contra<strong>in</strong>tes d’ordre techniques des paysans ouest africa<strong>in</strong>s qui représentent<br />
actuellement des obstacles au développement de l’exportation et exposent<br />
les populations de ces pays aux risques sérieux et croissants de problèmes<br />
de santé à travers la consommation des arachides contam<strong>in</strong>ées par<br />
l’aflatox<strong>in</strong>e ;<br />
avec la mise en place d’un tel programme, un système de certification de la<br />
qualité des produits pourra être développé dans le temps, en collaboration<br />
avec les laboratoires d’analyses nationaux et <strong>in</strong>ternationaux.<br />
15
Pour le moment, le projet pourrait aider à développer des opportunités<br />
de commercialisation à l’<strong>in</strong>térieur des pays et de la région grâce à un bon suivi<br />
de l’offre en arachide et de la collecte de l’<strong>in</strong><strong>for</strong>mation sur les prix des marchés<br />
locaux et nationaux, et faciliter la diffusion de telles <strong>in</strong><strong>for</strong>mations aux<br />
pr<strong>in</strong>cipaux acteurs à l’aide de radios rurales et autres moyens de<br />
communications appropriés.<br />
16
3.0 Pr<strong>in</strong>cipaux pays producteurs<br />
sur le marché <strong>in</strong>ternational<br />
3.1 Introduction: le commerce de l’arachide et de ses<br />
sous-produits<br />
Sur les marchés <strong>in</strong>ternationaux, le commerce d’arachide représente<br />
seulement 4 à 6 % de la production mondiale. La grande majorité de cette<br />
production mondiale d’arachide est utilisée essentiellement pour la<br />
satisfaction des beso<strong>in</strong>s de consommation et les demandes des marchés<br />
domestiques.<br />
Les exportations d’arachide de bouche sont d’ailleurs concentrées dans<br />
seulement quelques pays d’orig<strong>in</strong>e – les plus importants étant la Ch<strong>in</strong>e, les<br />
Etats-Unis, l’Argent<strong>in</strong>e et l’Inde – entre ces pays, les parts de marché ont<br />
considérablement changé au cours des 30 dernières années (figure 1).<br />
Cette section décrit brièvement la production récente et actuelle<br />
d’exportation de ces quatre pr<strong>in</strong>cipaux pays d’orig<strong>in</strong>e et de l’Afrique du Sud.<br />
Parmi ces pays, l’Argent<strong>in</strong>e et l’Afrique du Sud en particulier peuvent être<br />
considérées comme des pays orientés vers l’exportation, alors qu’en général<br />
pour la Ch<strong>in</strong>e, les Etats-Unis et l’Inde, la première priorité demeure la part du<br />
marché <strong>in</strong>térieur.<br />
Figure 1. Tendance mondiale de l’arachide de bouche Part de marché à<br />
l’exportation et pr<strong>in</strong>cipaux exportateurs, 1972-98<br />
Source : Peanut Trade and the World Trade Organization<br />
17
Alors que le rôle des règlements commerciaux, y compris les taxes, les<br />
frais de douanes et les quotes-parts seront évoqués, un résumé concis des<br />
règlements politiques commerciaux est présenté dans l’annexe 4, sur le<br />
Commerce actuel et les politiques nationales de l’arachide (2003).<br />
3.2 Ch<strong>in</strong>e<br />
Avec une base de production de plus de 15 millions de tonnes d’arachide en<br />
2002, la Ch<strong>in</strong>e produit près de la moitié de la production mondiale (cette<br />
dom<strong>in</strong>ance est graphiquement illustrée dans la base de données FAOSTAT où<br />
les figures de production de l’arachide en provenance de la Ch<strong>in</strong>e sont en fait<br />
situées au-dessus de la production totale du monde – tous les autres<br />
producteurs étant strictement relégués à un ordre alphabétique !).<br />
Représentant plus de 26 % d’arachide décortiquée exportée et 34 %<br />
d’arachide coque au cours de la dernière décennie, la Ch<strong>in</strong>e est de lo<strong>in</strong> le plus<br />
gros producteur et exportateur d’arachide du monde.<br />
La Ch<strong>in</strong>e est généralement considérée comme un pays d’orig<strong>in</strong>e fiable en<br />
termes d’aflatox<strong>in</strong>e, bien qu’ayant connu des problèmes ces dernières années -<br />
en particulier dans les secteurs de production de Henan et de Liaon<strong>in</strong>g.<br />
Pendant la récolte de 1999 – qui a été mauvaise pour toutes les orig<strong>in</strong>es du<br />
monde – des niveaux d’humidité élevée et une contam<strong>in</strong>ation fongique ont été<br />
notés dans la variété Hsuji et la Virg<strong>in</strong>ia qui ont été affectées par<br />
contam<strong>in</strong>ation fongique et par l’aflatox<strong>in</strong>e. Néanmo<strong>in</strong>s, la Ch<strong>in</strong>e est encore<br />
unanimement identifiée comme pays d’orig<strong>in</strong>e fiable en termes de qualité.<br />
L’arachide en provenance de la Ch<strong>in</strong>e a le prix le plus compétitif parmi<br />
les trois pays d’orig<strong>in</strong>e « fiables » en termes d’aflatox<strong>in</strong>e – les deux autres pays<br />
étant l’Argent<strong>in</strong>e et les Etats-Unis. Les prix de l’arachide en provenance de la<br />
Ch<strong>in</strong>e vont généralement de 600 à 650 $ EU la tonne, et augmentent<br />
occasionnellement. L’orig<strong>in</strong>e ch<strong>in</strong>oise a été décrite par un importateur comme<br />
des « fonds de clic », qui peuvent fournir un volume presque illimité de<br />
produit une fois que certa<strong>in</strong>s prix du marché sont atte<strong>in</strong>ts.<br />
Les producteurs ch<strong>in</strong>ois sont <strong>for</strong>tement sensibles aux conditions du<br />
marché, avec une impressionnante faculté de réaction. Entre les récoltes de<br />
1999 et 2000, la production d’arachide a augmenté d’environ 15 %, en<br />
réaction aux bas prix du maïs de 1999. Heureusement pour les producteurs,<br />
les récoltes d’arachide de Ch<strong>in</strong>e en 2000 ont été beaucoup mo<strong>in</strong>s affectées par<br />
la contam<strong>in</strong>ation d’aflatox<strong>in</strong>e que ne l’avaient été les récoltes de 1999, a<strong>in</strong>si la<br />
majeure partie de cette production a été vendue.<br />
18
La demande nationale en Ch<strong>in</strong>e est un facteur considérable, en<br />
particulier pour fournir le marché d’huile d’arachide, qui prend<br />
approximativement 60 % de la récolte d’arachide. Les prix de l’huile<br />
d’arachide sont actuellement très élevés (et certa<strong>in</strong>s conviennent qu’ils sont<br />
<strong>in</strong>soutenables), à plus de 1,400 $ EU la tonne, le prix habituel étant de 900 $<br />
EU. Ce facteur conduit à la hausse des prix de l’arachide et de toutes ces<br />
autres applications – mais cela ne devrait pas cont<strong>in</strong>uer.<br />
3.3 Les Etats-Unis d’Amérique<br />
Ayant fournit plus de 17 % de l’exportation mondiale de l’arachide coque et<br />
plus de 22 % de l’arachide décortiquée au cours de la décennie passée, les<br />
Etats-Unis sont le deuxième plus grand exportateur mondial d’arachide<br />
coque. Cependant, la part mondiale du marché d’arachide des Etats-Unis a<br />
dim<strong>in</strong>ué au cours des deux dernières décennies, d’approximativement 32.9 %<br />
entre 1981 et 1985 (correspondant à un volume d’échange de 354.000 tonnes<br />
métrique (TM)) à 19.8 % entre 1996 et 2000, correspondant à un volume<br />
d’échange de 294.000 TM (Revoredo et Fletcher, 2002).<br />
Historiquement, l’exportation de l’arachide d’orig<strong>in</strong>e américa<strong>in</strong>e a été<br />
<strong>for</strong>tement réglementée par le gouvernement des Etats-Unis, directement et<br />
légalement liée au marché <strong>in</strong>térieur. La synthèse la plus claire faite par l’ancien<br />
gouvernement des Etats-Unis est peut être celle du American Peanut<br />
Coalition (Coalition pour l’arachide américa<strong>in</strong>e), comme proposée sur leur<br />
site Web :<br />
le programme fédéral des Etats-Unis pour l’arachide est composé<br />
d’un système restrictif de quotes-parts de production, d’appuis aux<br />
prix élevés et de restrictions sévères sur les importations. Ensemble,<br />
ces dispositifs fixent le prix <strong>in</strong>terne des propriétaires de quote-part<br />
d’arachide bien au-dessus du prix du marché mondial. Le<br />
programme mandate par décret les quantités d’arachides cultivées<br />
pour la consommation nationale, fixe les prix excessifs que les<br />
propriétaires de quotes-parts reçoivent pour leurs arachides, et fixe<br />
la quantité d’arachides importées pouvant avoir accès au marché<br />
des Etats-Unis. [American Peanut Coalition, ‘www.go-peanuts.org’]<br />
Etant donné la grande portée et les complexités byzant<strong>in</strong>es de<br />
l’<strong>in</strong>tervention du gouvernement des Etats-Unis dans le secteur de l’arachide, il<br />
serait facile de se perdre dans une histoire tangentielle, qui ne serait<br />
19
f<strong>in</strong>alement pas d’utilisation pratique ici. Ce qui suit est une présentation très<br />
brève de cette histoire et l’état actuel de la production américa<strong>in</strong>e et les<br />
conditions du marché, car ceci est spécifiquement applicable à cette étude.<br />
Les règles du gouvernement américa<strong>in</strong> concernant le marché de<br />
l’arachide en général et les exportations en particulier, ont commencé par<br />
l’Agricultural Adjustment Act de 1933 (Loi agricole d’ajustement) une «<br />
Nouvelle donne » classique qui accordait <strong>in</strong>itialement des prêts sur les<br />
produits et avait mis en place des limites de quote-part sur les ventes<br />
d’arachide, de tabac, de sucre et du lait. La section 22 de la Loi de 1933 a<br />
autorisé le Président des Etats-Unis à mettre des restrictions quantitatives sur<br />
les importations de produits agricoles pour lesquels des programmes de<br />
soutien aux prix ont été adm<strong>in</strong>istrés par le M<strong>in</strong>istère de l’Agriculture des<br />
Etats-Unis (le USDA). La Loi de 1933 a efficacement établi l’avenir « du<br />
programme arachide » du USDA.<br />
Après une décision officielle de 1936 stipulant que certa<strong>in</strong>s aspects de<br />
contrôle de production de la Loi de 1933 étaient anticonstitutionnels, le<br />
Congrès des Etats-Unis a répondu par la Loi agricole d’ajustement de 1938,<br />
sous laquelle le programme d’arachide a été mieux élaboré, avec des soutiens<br />
aux prix en plus des limites de quotes-parts. Le programme d’arachide ira<br />
éventuellement au-delà, en mettant en place des mesures de f<strong>in</strong>ancement des<br />
cultures et en déterm<strong>in</strong>ant les surfaces de production d’arachide.<br />
Aux Etats-Unis, l’arachide est actuellement le seul aliment dont l’offre<br />
nationale est contrôlée par le gouvernement fédéral qui en déterm<strong>in</strong>e le<br />
volume spécifique à vendre pendant une année donnée et qui, par les<br />
cont<strong>in</strong>gents restrictifs annuels déterm<strong>in</strong>e également quelle proportion de la<br />
récolte des USA accédera au marché d’exportation au cours d’une année<br />
donnée, et à quel prix.<br />
L’effet de cette <strong>in</strong>terposition devait essentiellement faire en sorte que les<br />
arachides et les sous-produits de l’arachide deviennent artificiellement<br />
« rares » et également plus chers qu’ils ne le seraient, selon l’offre et la<br />
demande d’un marché libre et non réglementé. En 1997, le General<br />
Account<strong>in</strong>g Office (Bureau général des comptabilités) des Etats-Unis<br />
(Gouvernement) a estimé que les consommateurs américa<strong>in</strong>s sont obligés de<br />
dépenser pas mo<strong>in</strong>s de 513 millions de dollars de plus chaque année pour des<br />
produits d’arachide protégés dans le cadre du programme arachide.<br />
Ces dernières années, et spécifiquement avec les ré<strong>for</strong>mes apportées au<br />
secteur de l’arachide américa<strong>in</strong>e sous la Farm Act (Loi sur la ferme) de 2002,<br />
20
le secteur de l’arachide des Etats-Unis a été libéralisé. Le document le plus<br />
précis de ces changements vient peut-être de Begh<strong>in</strong>, Diop, Matthey et<br />
Sewadeh, 2003 :<br />
«la Loi sur la ferme de 2002 a élim<strong>in</strong>é des quotes-parts de<br />
production avec un rachat des quotes-parts et a converti l’ancien<br />
programme de soutien au prix de l’arachide en un système de<br />
paiements directs et anticycliques et plancher les prix cum de<br />
subvention des productions (prêts sans recours avec des<br />
dispositions de subventions pour les ventes). Les pr<strong>in</strong>cipaux<br />
dispositifs du nouveau programme sont les suivants : »<br />
1. Tous les producteurs d’arachide ont ma<strong>in</strong>tenant l’égalité<br />
d’accès à un programme de subvention de vente, sous lequel<br />
les producteurs peuvent mettre en gage leurs récoltes comme<br />
garantie pour obtenir prêt de vente à un taux préférentiel (355<br />
$ la tonne). Les producteurs peuvent rembourser le prêt à un<br />
taux qui est mo<strong>in</strong>s que le taux de remboursement déterm<strong>in</strong>é<br />
par le M<strong>in</strong>istère de l’Agriculture des Etats-Unis (le USDA)<br />
plus l’<strong>in</strong>térêt ou le taux de prêt sur la vente plus l’<strong>in</strong>térêt, ou ils<br />
peuvent renoncer au prêt (Revoredo et Fletcher 2002).<br />
2 Les producteurs avec une histoire de production d’arachide<br />
pendant la période 1998-2001 reçoivent un paiement<br />
« découplé » fixe et un paiement anticyclique. La production<br />
éligible est le produit du rendement moyen en période<br />
fondamentale et 85 % sur la période de base par hectare. Le<br />
paiement anticyclique <strong>in</strong>tervient quand les prix du marché<br />
tombent au-dessous du prix <strong>in</strong>dicatif établi à 495 $ net du<br />
paiement direct (36 $/tonne).<br />
3. Les anciens propriétaires des quotes-parts d’arachide<br />
reçoivent des paiements compensatoires pour la perte de<br />
valeur de leurs actifs de quote-part (voir Revoredo et Fletcher,<br />
2002 pour plus de détails).<br />
« L’élim<strong>in</strong>ation des quotas de production a dim<strong>in</strong>ué le prix payé par<br />
les fabricants américa<strong>in</strong>s de tourteaux, augmentant a<strong>in</strong>si l’utilisation<br />
nationale des arachides. Elle a également amené la logique<br />
d’importation d’arachide en confiserie à dim<strong>in</strong>uer le coût de<br />
trans<strong>for</strong>mation des produits comestibles qui utilisent <strong>in</strong>tensément<br />
l’arachide. Le schéma de quota sur le taux tarifaire aux Etats-Unis<br />
21
22<br />
(TRQ) est toujours en place mais il est superflu et les TRQ ne<br />
remplissent pas (demeurent non satisfaits) (Fletcher et Revoredo<br />
2003). Les mesures d’<strong>in</strong>citation pour importer de la pâte d’arachide<br />
de l’Argent<strong>in</strong>e ou du Mexique ont de ce fait été sérieusement<br />
compromises par les récents changements dans le programme de la<br />
ferme. Les mesures de production créées par la Loi de la ferme de<br />
2002 varient selon les différents types de producteurs mais l’effet<br />
net semble être un accroissement de la production. Les paiements<br />
fixes et anticycliques fournissent quelques <strong>in</strong>citations en vue<br />
d’augmenter la production et peuvent être considérées comme<br />
génératrice de subventions pour les offres (Adams et al. 2001) ».<br />
L’arachide d’orig<strong>in</strong>e américa<strong>in</strong>e fixe uni<strong>for</strong>mément la limite supérieure<br />
des prix du marché <strong>in</strong>ternational, avec des prix à l’exportation de 600 $ à des<br />
prix aussi élevé que 950 $ la tonne. L’arachide des USA a une réputation<br />
enviée tant pour sa qualité que pour la fiabilité de son offre.<br />
Cela ne signifie pas que la récolte des Etats-Unis est toujours une source<br />
fiable d’approvisionnement, ni qu’elle est toujours exempte d’aflatox<strong>in</strong>e, qui<br />
s’est en effet avérée être un problème sérieux ces dernières années.<br />
Aux Etats-Unis, l’<strong>in</strong>festation d’aflatox<strong>in</strong>e la plus importante a été<br />
enregistrée en 1999, en particulier dans les zones de production du sud-est<br />
(y compris la Georgie et la Virg<strong>in</strong>ie) – qui ont souffert 60 à 70 % de rejet selon<br />
des normes européennes d’aflatox<strong>in</strong>e. Sur les quantités certifiées comme<br />
« exempt d’aflatox<strong>in</strong>e » par le USDA pendant cette année – achetée à un prix<br />
préférentiel de 30 à 40 $ la tonne par une compagnie d’importation<br />
hollandaise – environ 60 % se sont plus tard avérés être au-delà des normes<br />
européennes d’aflatox<strong>in</strong>e. Cette année-là, seules les zones de production du<br />
sud-ouest des Etats-Unis ont pu fournir des types d’arachides coques de<br />
Virg<strong>in</strong>ia et Runner exempts d’aflatox<strong>in</strong>e.<br />
3.4 Argent<strong>in</strong>e<br />
L’Argent<strong>in</strong>e a représenté plus de 16 % du marché mondial d’arachide<br />
décortiquée à l’exportation au cours de la dernière décennie, faisant d’elle le<br />
troisième grand exportateur d’arachide décortiquée. Approximativement<br />
28.3 % de la récolte de l’Argent<strong>in</strong>e a été exporté en 2001.<br />
L’orig<strong>in</strong>e argent<strong>in</strong>e est considérée comme la « première remplaçante » de<br />
l’orig<strong>in</strong>e américa<strong>in</strong>e. L’arachide de l’Argent<strong>in</strong>e est généralement chiffrée entre
600 $ et 900 $ la tonne ; les prix sont en grande partie déterm<strong>in</strong>és par la<br />
récolte d’arachide des Etats-Unis, pour laquelle l’Argent<strong>in</strong>e fournit un<br />
« approvisionnement de secours » important pour le marché <strong>in</strong>térieur.<br />
Etant donné ses propres demandes nationales de près de 43 000 tonnes<br />
métriques par an et son profil <strong>in</strong>ternational de qualité, la demande mondiale<br />
d’arachide en provenance d’Argent<strong>in</strong>e dépasse généralement le stock<br />
disponible, les contrats se font donc bien à l’avance. Cependant, ceci ne veut<br />
pas dire que l’aflatox<strong>in</strong>e n’est pas un problème en Argent<strong>in</strong>e – cela fût le cas en<br />
1999 – et même la Ch<strong>in</strong>e (dont les prix sont concurrentiels) peut tout à fait<br />
favorablement concurrencer l’Argent<strong>in</strong>e en termes de qualité du produit.<br />
La crise économique nationale de 2001 a eu des conséquences graves sur<br />
les exportateurs d’arachide en Argent<strong>in</strong>e, en dépit d’une bonne moisson et<br />
d’une récolte propre. Des droits d’exportation de 10 % ont été imposés (et<br />
sont toujours en vigueur à ce jour). Ces droits a<strong>in</strong>si que l’annulation de la<br />
subvention d’exportation de 5 % - ont conduit à une réduction nette de revenu<br />
de 15 %. Même la dévaluation du peso argent<strong>in</strong> face au dollar n’a pu atténuer<br />
les dégâts, d’autant plus que plusieurs exportateurs argent<strong>in</strong>s détenaient des<br />
crédits d’<strong>in</strong>vestissement en dollars américa<strong>in</strong>s et ne pouvaient donc pas<br />
ple<strong>in</strong>ement bénéficier d’un taux de change apparemment salutaire.<br />
3.5 Inde<br />
L’Inde a fourni 9,1 % du marché mondial de l’arachide décortiquée à<br />
l’exportation au cours de la dernière décennie et près de 7 % d’arachide coque<br />
à l’exportation. Le prix de l’arachide d’orig<strong>in</strong>e <strong>in</strong>dienne est logiquement situé<br />
en dessous de celui de la Ch<strong>in</strong>e, au bas des « quatre grands » pays d’orig<strong>in</strong>e, un<br />
reflet de ce qui doit charitablement être appelé problèmes de qualité.<br />
Considéré comme pays d’orig<strong>in</strong>e « sujet à l’aflatox<strong>in</strong>e » actuellement et<br />
uni<strong>for</strong>mément évité par les importateurs européens, le marché <strong>in</strong>dien<br />
d’exportation d’arachide a été en grande partie dévasté par l’adoption des<br />
règlements européens d’aflatox<strong>in</strong>e. Selon des statistiques de l’Association<br />
<strong>in</strong>dienne des gra<strong>in</strong>es oléag<strong>in</strong>euses et d’exportateurs de produit (IOPEA), de<br />
1997/98 à 2001/02, les exportations <strong>in</strong>diennes d’arachide se sont effondrées<br />
de près de 50 %, les chiffres de FAOSTAT sont con<strong>for</strong>mes à cette estimation.<br />
Les exportations d’arachide <strong>in</strong>dienne vers l’Europe sont ma<strong>in</strong>tenant limitées<br />
aux aliments pour la volaille. (IOPEA 2003).<br />
Les perspectives pour la réhabilitation (ou le développement) de la<br />
réputation <strong>in</strong>ternationale de l’arachide <strong>in</strong>dienne – et de son retour sur le<br />
23
marché européen – ne sont pas très prometteuses dans l’avenir. En attendant,<br />
l’Indonésie absorbe actuellement une grande partie de l’exportation <strong>in</strong>dienne,<br />
car elle est mo<strong>in</strong>s chère que l’arachide en provenance de la Ch<strong>in</strong>e.<br />
Indépendamment de la demande <strong>in</strong>ternationale d’arachide <strong>in</strong>dienne, la<br />
production a augmenté sensiblement ces dernières années, et plus récemment<br />
en réponse aux demandes du marché mondial d’huile d’arachide, qui se sont<br />
plaflonnées à 1.500 $ en août 2003.<br />
On estime que près 92 % de la récolte <strong>in</strong>dienne d’arachide est<br />
trans<strong>for</strong>mée en huile, pr<strong>in</strong>cipalement pour servir le marché <strong>in</strong>térieur. Avec la<br />
bonne récolte d’arachide en 1993, et après une <strong>in</strong>terruption de 40 ans, l’Inde<br />
est revenue dans le marché mondial comme fournisseur d’huile d’arachide, en<br />
concurrence directe avec le Sénégal et l’Argent<strong>in</strong>e, deux pays qui ont souffert<br />
de pertes significatives pendant la récolte actuelle (2003/2004).<br />
Bien que le prix de l’huile d’arachide au niveau mondial se soit<br />
rapidement rajusté avec la re-émergence de l’Inde comme fournisseur (un<br />
prix qui a baissé à 1.170 $ en janvier 2004), ce niveau est toujours<br />
sensiblement meilleur que le prix local. Heureusement pour les producteurs<br />
<strong>in</strong>diens, l’exportation de plus de 50.000 TM d’huile a efficacement protégé la<br />
structure de prix local contre un effrondrement en réponse à la bonne récolte<br />
de 2003 (Ganguli 2004).<br />
3.6 Vietnam<br />
Le Vietnam a représenté 8,2 % du marché mondial de l’arachide décortiquée à<br />
l’exportation, la plupart dest<strong>in</strong>ée à l’Indonésie, la Malaisie, les Philipp<strong>in</strong>es et<br />
au Japon. Bien que l’arachide d’orig<strong>in</strong>e vietnamienne ait récemment atte<strong>in</strong>t le<br />
marché américa<strong>in</strong> sous le Pacific Rim Trade Agreement (Traité de commerce<br />
du pacifique Rim), elle est plutôt rare sur le marché européen.<br />
3.7 Afrique du Sud<br />
L’Afrique du Sud a représenté 2,2 % du marché mondial de l’arachide<br />
décortiquée à l’exportation au cours de la dernière décennie. L’arachide sudafrica<strong>in</strong>e<br />
est considérée parmi les meilleures qualités du monde et est<br />
communément bien cotée au même titre que celle de l’Argent<strong>in</strong>e, allant de<br />
600 $ à un prix aussi élevé que 870 $ la tonne.<br />
Une demande locale très élevée tend également à faire flotter les prix de<br />
l’arachide sud-africa<strong>in</strong>e, un facteur qui sera discuté plus lo<strong>in</strong> dans la section 4.4.<br />
24
L’arachide sud-africa<strong>in</strong>e est appréciée sur le marché européen, elle a également<br />
récemment gagné un équilibre raisonnable sur le marché des Etats-Unis.<br />
Cependant, il a été noté que la qualité générale de l’arachide sudafrica<strong>in</strong>e<br />
a légèrement changé ces dernières années, car l’uni<strong>for</strong>mité des<br />
variétés contenues dans chaque lot n’est plus aussi sûre qu’elle l’était<br />
auparavant. Ce décl<strong>in</strong> dans l’uni<strong>for</strong>mité est dû à l’<strong>in</strong>troduction récente de<br />
mach<strong>in</strong>es avec des technologies de calibrage, par opposition à l’ancienne<br />
méthode qui consistait à égousser et trier manuellement (HPS) les lots<br />
d’arachides.<br />
La production et la vente de l’arachide sud-africa<strong>in</strong>e est facilitée par un<br />
réseau bien-organisé de coopératives de producteurs, d’associations<br />
commerciales et autres acteurs, y compris <strong>Groundnut</strong> International et<br />
Safr<strong>in</strong>ut. La qualité de l’arachide sud-africa<strong>in</strong>e est certifiée par le Perishable<br />
Products Export Control Board (PPECB) (Bureau de contrôle des produits<br />
d’exportaiton périssables), une structure paraétatique ayant une grande<br />
crédibilité <strong>in</strong>ternationale dans le secteur de l’arachide.<br />
Toutefois, l’aflatox<strong>in</strong>e peut être un problème, en particulier dans les<br />
zones de production plus arides. Bien que la récolte sud-africa<strong>in</strong>e d’arachide<br />
ait été en grande partie dévastée par contam<strong>in</strong>ation d’aflatox<strong>in</strong>e à deux<br />
reprises ces dernières années – en 1999 et encore en 2002 – l’Afrique du Sud<br />
est encore considérée comme un fournisseur digne de confiance sur le marché<br />
<strong>in</strong>ternational de l’arachide, en grande partie dû à la fiabilité des services<br />
d’<strong>in</strong>spection avant embarquement du PPECB, des activités de contrôle de<br />
qualité de ses us<strong>in</strong>es de décortiquage (certification européenne), et à la<br />
surveillance active et fiable de sa production par les <strong>in</strong>stances commerciales<br />
telles que Safr<strong>in</strong>ut et <strong>Groundnut</strong> International.<br />
Selon les importateurs hollandais, il a été estimé que plus de la moitié de<br />
la production sud-africa<strong>in</strong>e d’arachide de 2002 a été contam<strong>in</strong>ée par<br />
l’aflatox<strong>in</strong>e au-dessus des normes européennes.<br />
3.8 Autres Orig<strong>in</strong>es <strong>Africa</strong><strong>in</strong>es<br />
D’autres pays africa<strong>in</strong>s qui exportent l’arachide - notamment la Gambie, le<br />
Sénégal, le Soudan et le Zimbabwe - sont généralement considérés comme les<br />
pays d’orig<strong>in</strong>e <strong>for</strong>tement sujets à la contam<strong>in</strong>ation par l’aflatox<strong>in</strong>e. Dans la<br />
plupart des cas, les importateurs européens ne feront pas confiance à<br />
l’<strong>in</strong>spection avant embarquement de ces pays - même dans le cas de filiales<br />
nationales de sociétés <strong>in</strong>ternationales telles que la Société Générale de<br />
25
Surveillance (SGS). Cette polarisation négative est entièrement soutenue par<br />
des règlements actuels de l’Union européenne et ren<strong>for</strong>cée par les conclusions<br />
de l’analyse d’une équipe d’experts réalisée en 2001 sur les règlements<br />
d’aflatox<strong>in</strong>e de l’Union européenne.<br />
Des quantités limitées d’arachide de la Gambie et de la Gu<strong>in</strong>ée ont<br />
récemment accédé au marché des Etats-Unis sous le <strong>Africa</strong> Growth and<br />
Opportunities Act (Le Pacte africa<strong>in</strong> de croissance et des affaires) (voir<br />
Annexe 4, Les importations américa<strong>in</strong> d’arachide sous l’AGOA, 2002).<br />
26
4.0 Tendances du marché mondial<br />
et conditions de qualité<br />
4.1 Introduction<br />
Comme <strong>in</strong>diqué ci-dessus, la part de marché des exportations d’arachide est<br />
dom<strong>in</strong>ée par quelques pays seulement ; les modèles d’importation d’arachide<br />
sont beaucoup plus fractionnés.<br />
Néanmo<strong>in</strong>s, seuls quelques grands marchés offrent des promesses pour<br />
l’arachide d’orig<strong>in</strong>e ouest africa<strong>in</strong>e, le marché européen en tête - bien que les<br />
standards de qualité aient récemment considérablement empêché l’accès de<br />
ce marché à l’arachide de toutes les orig<strong>in</strong>es.<br />
La figure ci-dessous <strong>in</strong>dique des tendances de prix pour la taille standard<br />
d’arachide de bouche en coque, 40 à 50 par once (“40/50s”), des trois<br />
pr<strong>in</strong>cipaux pays d’orig<strong>in</strong>e, sur le marché de Rotterdam :<br />
Selon Revoredo et Fletcher, les deux pr<strong>in</strong>cipaux pics représentent la<br />
pénurie d’arachide des Etats-Unis, qui dans le deuxième cas a mené à des<br />
répercussions <strong>in</strong>ternationales claires. Un prix préférentiel pour l’arachide des<br />
Etats-Unis est clairement <strong>in</strong>diqué, 50 $ au-dessus de celle orig<strong>in</strong>aire<br />
d’Argent<strong>in</strong>e, et 53 $ au-dessus de celle orig<strong>in</strong>aire de la Ch<strong>in</strong>e.<br />
Figure 2. Arachide coque, prix <strong>in</strong>ternationaux, taille 40/50, catégorie<br />
arachide de bouche standard<br />
De : Revoredo et Fletcher 2002.<br />
27
Les caractéristiques des pr<strong>in</strong>cipaux marchés <strong>in</strong>ternationaux d’arachide<br />
comme dest<strong>in</strong>ations d’exportation seront discutées ci-dessous.<br />
4.2 Europe<br />
Le marché européen d’arachide est axé sur deux ports marchands, c.-à-d.<br />
Rotterdam et Londres. Considérant que Rotterdam est le centre du<br />
commerce d’arachide de bouche, et la France le centre du marché européen<br />
d’huile d’arachide (référence particulière faite au Sénégal), le marché<br />
britannique comprend des acheteurs d’arachides pour la <strong>for</strong>mulation<br />
d’aliments bétails et pour la volaille, ces aliments ayant des standards de<br />
qualité mo<strong>in</strong>dre que celle de l’arachide de bouche.<br />
En général, la demande européenne de l’arachide a augmenté au cours de<br />
ces récentes décennies, changeant d’un marché dom<strong>in</strong>é par les oléag<strong>in</strong>eux vers<br />
une demande accrue de l’arachide de bouche, dont environ 80 % est torréfié<br />
pour être ultérieurement trans<strong>for</strong>mé en casse-croûte ou en pâte d’arachide.<br />
Considérant que la pâte d’arachide représente environ 35 % de la<br />
consommation totale d’arachide des marchés cont<strong>in</strong>entaux, le volume est<br />
proche de 5 % pour le marché britannique (Kettlewell 2003).<br />
Le décl<strong>in</strong> du marché d’huile d’arachide dû à la concurrence du tournesol,<br />
du soja et de la gra<strong>in</strong>e de colza a dim<strong>in</strong>ué la demande européenne d’oléag<strong>in</strong>eux<br />
d’environ 500.000 TM par an en 1983 à environ 200.000 TM aujourd’hui (R.<br />
Kettlewell 2003). Les pr<strong>in</strong>cipaux fabricants et raff<strong>in</strong>eurs européens d’huile<br />
d’arachide sont Cereol (France), Romi (Hollandes), Anglia (Royaume-Uni) et<br />
Karlshamns (Suède et Royaume-Uni).<br />
En général, le marché européen d’arachide est devenu mo<strong>in</strong>s diversifié et<br />
plus concentré au cours de la décennie passée. Il est dit que vers la f<strong>in</strong> des<br />
années 1990, une gamme de grands et petits fournisseurs ont fourni le produit<br />
aux grands et petits revendeurs, pour servir une gamme variée de<br />
consommateurs et des <strong>in</strong>dustries de trans<strong>for</strong>mation f<strong>in</strong>ale pour servir les<br />
supermarchés. Ces dernières années, la tendance a changé vers de grands<br />
décortiqueurs/fournisseurs d’orig<strong>in</strong>e livrent le produit à quelques petits<br />
revendeurs servant quelques grands consommateurs, une part croissante du<br />
marché étant prise par les chaînes de supermarchés.<br />
Il y a une tendance globale vers des fusions entre les maisons<br />
d’importation plus grandes, ayant pour résultat l’absorption ou la disparition<br />
des sociétés de commerce plus petites (qui autrefois brassaient de grands<br />
28
volumes), à la faveur de quelques grandes sociétés commerciales, qui tendent<br />
à vendre de plus petits volumes (paradoxalement), en partie à cause des<br />
problèmes de qualité d’approvisionnement. La fusion entre Cargill et Golden<br />
Peanut Company en mars 2000 est vue comme une évidence expliquant que<br />
dans le nouvel environnement du marché, même les plus grands fournisseurs<br />
ne sont pas immunisés contre les problèmes qui affectent les plus petits<br />
acteurs.<br />
Avec leur présence en dim<strong>in</strong>ution sur le marché, le f<strong>in</strong>ancement autrefois<br />
fourni par les maisons marchandes a en grande partie tari, au détriment de plus<br />
petits fournisseurs et, f<strong>in</strong>alement, des utilisateurs, qui doivent rechercher les<br />
stocks de produits de qualité fiable en constante dim<strong>in</strong>ution.<br />
Considérant que les plus grands revendeurs ont autrefois tenu de grandes<br />
quantités d’actions en Europe, ayant pour résultat un approvisionnement plus<br />
fiable et plus prévisible du marché, les stocks sont ma<strong>in</strong>tenant de plus en plus<br />
tenus par les fournisseurs d’orig<strong>in</strong>e qui doivent supporter les coûts <strong>in</strong>hérents<br />
(et les risques) pour garder de tels stocks. À mesure que les coûts de risque et<br />
de transaction augmentent, la liquidité globale du marché dim<strong>in</strong>ue et le retour<br />
sur l’<strong>in</strong>vestissement décl<strong>in</strong>e.<br />
En plus de ces facteurs contraignants, l’accès croissant aux technologies<br />
de communications au cours de ces dernières années, y compris les sources<br />
d’<strong>in</strong><strong>for</strong>mation du marché disponibles sur Internet et le commerce<br />
électronique, « rétrécissent » les chaînes d’approvisionnements, par des<br />
moyens qui peuvent f<strong>in</strong>alement augmenter la concurrence vis-à-vis des petits<br />
fournisseurs, même si ces technologies ont des moyens d’accès croissants aux<br />
marchés éloignés.<br />
La conclusion logique de la comb<strong>in</strong>aison de ces tendances est une<br />
<strong>in</strong>teraction de plus en plus directe entre les fournisseurs (par exemple les<br />
décortiqueurs et des exportateurs d’arachide) et les utilisateurs f<strong>in</strong>aux (par<br />
exemple les fabricants et de plus en plus, les chaînes de supermarchés). Les<br />
implications de ces tendances naissantes du marché <strong>in</strong>cluront la concurrence<br />
accrue entre les fournisseurs en termes de qualité du produit et de prix.<br />
En ce moment, les petits fournisseurs, les grands commerçants et les<br />
petits utilisateurs « sentent tous le p<strong>in</strong>cement », comme l’atteste la disparition<br />
ces dernières années des petits fournisseurs et des grandes maisons de<br />
commerce et de courtage, l’absorption de petits fabricants par de grandes<br />
sociétés et le développement d’un marché de plus en plus impitoyable en<br />
termes de qualité, où les orig<strong>in</strong>es perçues comme « non fiables » – comme<br />
l’Inde – sont à toute f<strong>in</strong> utile vouées à l’oubli.<br />
29
En plus de ces nouvelles tendances, les marchés européens d’arachide (et<br />
ceux du monde) ont été rigoureusement affectés par l’adoption du Règlement<br />
de la Commission européenne no. EC 1525/9 le 16 juillet 1998 (modifiant le<br />
Règlement de la Commission européenne no. 194/97 du 31janvier 1997), qui<br />
a fixé les niveaux maximum d’aflatox<strong>in</strong>e dans certa<strong>in</strong>s produits alimentaires.<br />
Une Directive séparée de la Commission (98/53/CE) a été adoptée le même<br />
jour pour harmoniser les modes de prélèvement d’échantillons et les<br />
méthodes d’analyse des teneurs en aflatox<strong>in</strong>e dans les produits alimentaires.<br />
Tous les deux règlements ont pris effet à compter du 1 er janvier 1999 (Journal<br />
officiel des Communautés européennes du 17 juillet 1998, L 201/93 et L<br />
201/101).<br />
Le Règlement de la Commission européenne EC no. 1525/9 a fixé le<br />
taux maximum d’aflatox<strong>in</strong>e B 1 autorisé à 2 μg/kg (ou parts par milliard, ppm)<br />
et les limites d’aflatox<strong>in</strong>es totales (B 2 + G 1 + G 2 ) à 4 ppm pour l’arachide<br />
prévue pour la consommation directe par les huma<strong>in</strong>s ou comme <strong>in</strong>grédient<br />
dans les produits alimentaires. Les limites pour les arachides qui doivent subir<br />
des trans<strong>for</strong>mations par calibrage ou autres traitements physiques avant la<br />
consommation huma<strong>in</strong>e ont été fixées à 8 ppm pour l’aflatox<strong>in</strong>e B 1 et à 15<br />
ppm pour les aflatox<strong>in</strong>es totales (B 1 + B 2 + G 1 + G 2 ).<br />
En général, les nouvelles normes d’aflatox<strong>in</strong>e UE sont considérées<br />
comme des mesures ayant considérablement augmenté le risque <strong>in</strong>hérent à<br />
une <strong>in</strong>dustrie déjà « dangereuse », un risque qui n’est pas bien soutenu, étant<br />
donné la pression additionnelle qu’il met sur un marché dont la rentabilité est<br />
en baisse.<br />
Les implications de prix ont suivi en conséquence, augmentant les<br />
risques subis par les différents acteurs du marché. Depuis que le code de<br />
l’Union européenne a été établi, il est apparu clairement que la qualité d’un<br />
produit donné est devenue beaucoup plus importante que son volume total ;<br />
la taille en déterm<strong>in</strong>ant des prix, occasionnant de grandes difficultés dans les<br />
prévisions et tendances du marché basées sur le développement des récoltes,<br />
comme c’était le cas dans le passé. Puisque dans certa<strong>in</strong>s cas l’essai de fiabilité<br />
est seulement réalisé à l’arrivée d’une expédition donnée dans le port, les<br />
dé<strong>for</strong>mations potentielles de prix peuvent créer des ravages le long de la<br />
chaîne d’approvisionnement, car les prix calculés à l’avance peuvent s’avérer<br />
<strong>in</strong>suffisants pour garantir la qualité du volume requis.<br />
Comme résultat partiel, les utilisateurs européens sont pr<strong>in</strong>cipalement<br />
et de plus en plus <strong>in</strong>téressés à réduire au m<strong>in</strong>imum leur risque en achetant de<br />
30
l’arachide exempte d’aflatox<strong>in</strong>e (ou « afla-négative »). Les importateurs sont<br />
venus à partager ce souci, en précisant que là où l’aflatox<strong>in</strong>e existe, on ne peut<br />
être confiant et que quelle soit la méthode d’analyse utilisée, rien ne peut<br />
adéquatement sécuriser l’acheteur.<br />
En dépit de la Directive de la Commission (98/53/CE), les difficultés<br />
techniques d’un échantillonnage adéquat et représentatif, la variabilité et<br />
l’<strong>in</strong>consistance des méthodes analytiques – en particulier au niveau des<br />
<strong>in</strong>specteurs avant expédition – augmentent les soucis concernant la qualité du<br />
produit.<br />
Un grand importateur a présenté un exemple graphique d’un cas<br />
hypothétique dans lequel 20 % des lots d’une expédition donnée s’avèrent<br />
être contam<strong>in</strong>és au-delà des règlements de l’Union européenne – disons 20<br />
conta<strong>in</strong>ers sur une expédition totale de 100 conta<strong>in</strong>ers. Après cette première<br />
analyse, si les 80 conta<strong>in</strong>ers restants d’arachides « approuvés » sont analysés<br />
une deuxième fois, il est presque certa<strong>in</strong> que 20 % de ces derniers s’avérera<br />
être contam<strong>in</strong>és par l’aflatox<strong>in</strong>e au-delà des règlements de UE et a<strong>in</strong>si de<br />
suite.<br />
Les stocks exempts d’aflatox<strong>in</strong>e ont un prix préférentiel aussi élevé que<br />
50 $ Etats-Unis la tonne, prix que les acheteurs acceptent de payer, étant<br />
donné les risques impliqués dans l’acceptation de n’importe quelle arachide<br />
ayant des traces d’aflatox<strong>in</strong>e.<br />
La priorité étant donnée aux produits exempts d’aflatox<strong>in</strong>e chez les<br />
importateurs et utilisateurs européens, l’achat de n’importe quelle arachide<br />
implique un certa<strong>in</strong> risque de qualité, <strong>in</strong>dépendamment de l’<strong>in</strong>spection avant<br />
embarquement et de la documentation résultant de l’analyse. Comme un<br />
acheteur l’a vigoureusement dit, « ce n’est pas une affaire de papier, c’est une<br />
affaire de produit ! »<br />
Tandis que les <strong>in</strong>specteurs <strong>in</strong>ternationaux avant expédition d’un pays<br />
peuvent être considérés comme « fiables » à cause de leur certification<br />
particulière, les importateurs peuvent ne pas faire confiance aux <strong>in</strong>specteurs<br />
affiliés à la même société dans un autre pays. Comme toute autre franchise<br />
<strong>in</strong>ternationale, la qualité et la fiabilité des services avant embarquement<br />
peuvent et changent considérablement d’un pays à un autre, avec des<br />
implications de risque important pour les importateurs en ce qui concerne de<br />
nouvelles importations aux orig<strong>in</strong>es <strong>in</strong>certa<strong>in</strong>es – beaucoup mo<strong>in</strong>s que celles<br />
qui étaient <strong>in</strong>certa<strong>in</strong>es dans le passé.<br />
Les petits fournisseurs doivent avant tout établir et cultiver des rapports<br />
à long terme avec quelques importateurs. Ils mettront à profit la période<br />
31
<strong>in</strong>itiale pour établir la confiance, une bonne réputation et la certification d’une<br />
expérience professionnelle en termes de qualité du produit et de son<br />
uni<strong>for</strong>mité, aussi bien que la fiabilité de l’offre.<br />
Actuellement, seuls trois pays – les Etats-Unis, l’Argent<strong>in</strong>e et la Ch<strong>in</strong>e –<br />
sont considérés comme des fournisseurs dignes de confiance par les<br />
importateurs européens. D’autres pays d’orig<strong>in</strong>e essayent cependant d’entrer<br />
sur le marché européen, notamment le Soudan, le Brésil, le Paraguay, le<br />
Nicaragua, Israël et l’Australie.<br />
4.3 Les Etats-Unis d’Amérique<br />
Même si les normes de qualité du marché d’importation des Etats-Unis pour<br />
l’arachide sont considérablement mo<strong>in</strong>s rigoureuses que les caractéristiques<br />
de l’Union européenne – compte tenu des niveaux d’aflatox<strong>in</strong>e totales de 15<br />
ppm pour l’arachide de bouche, con<strong>for</strong>mes aux règlements de Codex<br />
Alimentarius – l’entrée dans le marché des Etats-Unis a été bloquée pendant<br />
plusieurs années par une barrière complexe de soutiens aux prix, de quotas<br />
d’importation et autres législations protectionnistes.<br />
Les années récentes ont vu une érosion considérable de ces entraves aux<br />
échanges commerciaux, mais il reste à voir jusqu’à quel po<strong>in</strong>t le marché<br />
américa<strong>in</strong> peut s’avérer prometteur pour l’arachide d’orig<strong>in</strong>e ouest africa<strong>in</strong>e.<br />
La permission d’importer l’arachide comme produit avec un statut spécial<br />
d’exonoration de droits de taxe d’importations venant de pays africa<strong>in</strong>s choisis<br />
(y compris les quatre pays concernés) sous l’actuel Pacte africa<strong>in</strong> de croissance<br />
et des affaires (AGOA) n’est pas très claire.<br />
Tandis que plusieurs sources publiées <strong>in</strong>diquent (et déplorent) que<br />
l’arachide fraîche et la pâte d’arachide sont tous deux exclus des importations<br />
en franchise de droits de douane sous l’AGOA, la US Trade Commission 2003<br />
Tariff Database (Base de données des taxes 2003 de la Commission<br />
commerciale des Etats-Unis) <strong>in</strong>dique qu’un certa<strong>in</strong> nombre de produits<br />
classés d’arachide coque et décortiquée – fraîche, blanchie ou traitée<br />
autrement – sont en effet habilités à être importés en franchise de droits sous<br />
AGOA, de même que l’huile d’arachide brute et raff<strong>in</strong>ée (bien que la pâte<br />
d’arachide soit spécifiquement exclu).<br />
Cependant, selon les statistiques de la Commission commerciale des<br />
Etats-Unis, très peu de pays africa<strong>in</strong>s ont tiré profit du statut apparent<br />
d’exonoration de droits pour l’arachide accordé sous l’AGOA – y compris<br />
l’Afrique du Sud, la Gambie et la Gu<strong>in</strong>ée – et le volume d’arachide importé de<br />
32
ces pays depuis le début de l’AGOA en 2000 demeure tout à fait négligeable.<br />
L’Afrique du Sud a également exporté un volume modeste de la pâte<br />
d’arachide vers les Etats-Unis depuis 2000, bien que ce produit soit exclu des<br />
importations exonorées de droits vers les Etats-Unis sous l’AGOA.<br />
De ces statistiques récentes, les perspectives pour les exportations ouest<br />
africa<strong>in</strong>es d’arachide vers les Etats-Unis sous l’AGOA ne semblent pas<br />
particulièrement prometteuses en tant que telles, mais une enquête sera<br />
menée et des éclaircissements seront demandés directement aux<br />
fonctionnaires commerciaux de l’AGOA aux Etats-Unis au cours du reste de<br />
l’étude.<br />
Une petite histoire de règlementation<br />
Comme présentée ci-dessus, l’histoire de l’<strong>in</strong>terposition du gouvernement des<br />
Etats-Unis dans le secteur de l’arachide remonte aux Agricultural Adjustment<br />
Acts (Lois agricoles d’ajustement) de 1933 et 1938, Section 22 qui ont mis en<br />
place ce qui allait devenir le programme d’arachide du USDA. Initialement,<br />
les importations d’arachide étaient parmi les produits de base à proscrire par<br />
un ensemble de quotas et de taxes restrictifs, mais ceux de l’arachide ont plus<br />
perduré que ceux de n’importe quel autre produit.<br />
En 1953, pendant le décl<strong>in</strong> des cours des matières premières lié à la<br />
guerre entre les Etats-Unis et la Corée, des restrictions commerciales<br />
additionnelles sur l’arachide ont été <strong>in</strong>itiées sous la section 22 de la Loi de<br />
1933, mais ont été contestées aux termes du General Agreement on Tariffs<br />
and Trade, (GATT) (Accord général sur les taxes et le commerce). À partir de<br />
1956, en réponse à l’action du GATT, des quotas d’importation de l’arachide<br />
ont été déterm<strong>in</strong>és sur une base annuelle, et se sont lentement développés en<br />
réponse aux demandes nationales croissantes, a<strong>in</strong>si qu’aux accords successifs<br />
du commerce <strong>in</strong>ternational.<br />
Avec la US Freedom to Farm Act (Loi libre de la ferme) de 1996 (Farm<br />
Act de 1996), aux termes du Uruguay Round Agreement (l’Accord de<br />
l’Uruguay) du GATT (ma<strong>in</strong>tenant l’Organisation mondiale du commerce,<br />
OMC), la section 22 de la Loi agricole d’ajustement de 1933 a été élim<strong>in</strong>ée et<br />
les quotas d’importation d’arachide ont été f<strong>in</strong>alement remplacés par une taxe<br />
ad valorem fixé par quote-part de taux de taxe à l’importation (TRQ). La Loi<br />
de 1996 sur la ferme est considérée comme la première étape sérieuse dans la<br />
déréglementation du marché de l’arachide aux Etats-Unis (après un faux<br />
démarrage en 1981).<br />
33
Considérant que le but du Programme arachide de l’USDA est d’abord<br />
de protéger les prix de l’arachide coque fraîche dest<strong>in</strong>ée uniquement à la<br />
consommation huma<strong>in</strong>e directe et utilisée aussi sous <strong>for</strong>me d’huile, de<br />
tourteaux ou autres usages, la TRQ sur l’arachide couvre l’arachide coque<br />
fraîche, l’arachide décortiquée, derobe et « autres », à l’exception de la pâte<br />
d’arachide, qui est réglée par une TRQ séparée et additionnelle. Les<br />
spécifications complètes et <strong>for</strong>melles des TRQ sur l’arachide des Etats-Unis<br />
sont proposées dans le US Harmonized Tariff Schedule of the United States,<br />
HTSUS (Programme de taxe harmonisée des Etats-Unis), au Chapitre 12, à la<br />
note 2(b).<br />
Des ajustements ascendants considérables des TRQs sur l’arachide des<br />
Etats-Unis ont été provoqués aux termes du North American Free Trade<br />
Agreement, NAFTA (Accord de libre-échange nord-américa<strong>in</strong>) et sont<br />
susceptibles de s’accroître dans la Free Trade Area of the Americas, FTAA<br />
(Zone de libre-échange des Amériques), qui offriront un accès plus grand au<br />
marché des Etats-Unis aux pays d’orig<strong>in</strong>e actuellement m<strong>in</strong>eurs (mais<br />
prometteurs), tels que le Nicaragua et le Brésil. Du quota d’importation <strong>in</strong>itial<br />
de 775 TM fixé en 1933, le quota (comme TRQ) a atte<strong>in</strong>t 33,871 TM en<br />
1995, et jusqu’à 56.938 TM c<strong>in</strong>q ans plus tard.<br />
Sous NAFTA, les Etats-Unis ont accordé l’accès préférentiel de leur<br />
marché aux arachides et aux produits arachidiers d’orig<strong>in</strong>e canadienne et<br />
mexica<strong>in</strong>e, entra<strong>in</strong>ant une augmentation substantielle des importations<br />
d’arachide des Etats-Unis en provenance de ces pays.<br />
Après avoir efficacement remplacé le quota d’importation d’arachide,<br />
même le taux tarifaire des Etats-Unis a effectivement dim<strong>in</strong>ué. D’un taux<br />
<strong>in</strong>itial de 192.7 % pour l’arachide coque et de 155 % pour l’arachide<br />
décortiquée en 1995, en 2000 la taxe ad valorem d’importation d’arachide des<br />
Etats-Unis avait été réduit à 163.8 % pour l’arachide coque et à 131.8 % pour<br />
l’arachide décortiquée sous l’OMC.<br />
Sous NAFTA, cependant, en 2000 les taxes ad valorem pour l’arachide<br />
décortiquée étaient de 93 %. Sous les quotas de NAFTA, l’importation des<br />
arachides mexica<strong>in</strong>es s’est développée de 1400 % entre 1993 et 2000, à une<br />
valeur de 1.8 millions de dollars, alors que l’importation des arachides<br />
canadiennes se développait plus modestement de 10 % à 289 millions de<br />
dollars. Initialement (1994) les TRQ sur 3.377 TM, ont permis à l’arachide<br />
d’orig<strong>in</strong>e mexica<strong>in</strong>e d’accéder librement au marché des Etats-Unis, en<br />
quantité illimitée et exonorée de taxes à compter de 2008. Actuellement, la<br />
34
pâte d’arachide mexica<strong>in</strong>e est autorisée à accéder librement au marché<br />
américa<strong>in</strong> et sans quota, taxe ou autre restriction.<br />
En outre, un accord commercial bilatéral a été conclu entre les Etats-<br />
Unis et l’Argent<strong>in</strong>e en 1994, allouant à l’Argent<strong>in</strong>e jusqu’à 78 % de l’excédent<br />
de quota de préférence tarifaire d’arachide des Etats-Unis sur les c<strong>in</strong>q<br />
procha<strong>in</strong>es années, de 26.341 TM en 1995 à 43.901 TM en 2000. Une<br />
attribution semblable de préférence tarifaire a été donnée aux termes d’un<br />
accord pour la pâte d’arachide en provenance d’Argent<strong>in</strong>e, avec une quantité<br />
de quote-part de 3.650 TM en 1995, avec un taux de taxe de quote-part<br />
identique à, et fixée pour une réduction au même niveau que celle du Canada<br />
sous NAFTA.<br />
Jusqu’à récemment, l’Argent<strong>in</strong>e, le Mexique, et le Nicaragua ont<br />
représenté plus de 90 % des importations d’arachide américa<strong>in</strong>es (USDA/<br />
FAS, 2000), avec l’Argent<strong>in</strong>e fournissant 75 %. En 2000, cependant, la Ch<strong>in</strong>e<br />
a récemment dépassé le Nicaragua en fournissant une grande part du tiers des<br />
importations d’arachide des Etats-Unis, avec un volume d’échange de 4.900<br />
TM au cours l’année 2000.<br />
Il est prévu que ce volume augmente, la Ch<strong>in</strong>e étant déjà une « des<br />
Nations les plus favorisées » (Most Favored Nation, MFN) sous les<br />
concessions commerciales des Etats-Unis et qu’elle pourra négocier une plus<br />
grande part de l’arachide TRQ des Etats-Unis aux termes des accords<br />
commerciaux bilatéraux et lors de futures réunions de l’OMC.<br />
Etant donné les coûts impliqués dans la « location » pour ma<strong>in</strong>tenir le<br />
quota tarifaire d’arachide des Etats-Unis, il y’a des spéculations récentes que<br />
les TRQs sur l’arachide ont survécu à leur utilité et que leur élim<strong>in</strong>ation<br />
bénéficierait seulement aux consommateurs locaux et aurait peu d’impact sur<br />
les producteurs.<br />
4.4 Afrique du Sud<br />
Bien que n’étant pas particulièrement mentionné dans les termes de référence<br />
de cette étude, le marché sud-africa<strong>in</strong> d’arachide est <strong>for</strong>tement significatif sur<br />
le plan <strong>in</strong>ternational, et les développements récents peuvent s’avérer utiles en<br />
vue d’établir une présence accrue des producteurs ouest africa<strong>in</strong>s d’arachide<br />
dans le commerce <strong>in</strong>ternational.<br />
En plus de sa productivité et de sa fiabilité comme source d’arachide de<br />
haute qualité pour approvisionner les marchés <strong>in</strong>ternationaux (comme discuté<br />
35
ci-dessus), la demande locale d’arachide en Afrique du Sud est plus <strong>for</strong>te que<br />
l’offre. Puisque les normes de qualité d’arachide pour le marché <strong>in</strong>térieur sont<br />
considérablement mo<strong>in</strong>s rigoureuses que celles qui régissent le marché<br />
d’exportation (en particulier vers l’Europe), la demande locale sert<br />
d’amortisseur du marché, absorbant les stocks faiblement affectés par<br />
l’aflatox<strong>in</strong>e.<br />
Même pendant une année normale, l’arachide est demandée pour servir<br />
le marché <strong>in</strong>térieur et est importée des pays de l’Afrique australe (notamment<br />
le Zimbabwe et le Malawi), et même au-delà. Un importateur européen a<br />
spéculé que l’arachide sénégalaise a probablement accédé au marché sudafrica<strong>in</strong>.<br />
En cas de contam<strong>in</strong>ation sérieuse d’aflatox<strong>in</strong>e de ce genre, l’arachide<br />
peut même être importée des Etats-Unis ou d’Argent<strong>in</strong>e. Cette année, Dr<br />
Juan Estrada de l’ICRISAT Malawi a rapporté des offres d’achat de plus de<br />
750 dollars la TM, Franco Lilongwe pour les stocks non calibrés au niveau<br />
paysan – un prix jamais atte<strong>in</strong>t auparavant par les producteurs de Malawi.<br />
4.5 Pays asiatiques<br />
Les pr<strong>in</strong>cipaux acheteurs d’arachide en Asie sont l’Indonésie, les Philipp<strong>in</strong>es,<br />
la Malaisie et le Japon. Normalement ces pays achètent la majeure partie de<br />
leur produit en Ch<strong>in</strong>e, mais l’année dernière, avec l’arachide de la Ch<strong>in</strong>e<br />
vendue à des prix relativement élevés, les acheteurs asiatiques ont cherché des<br />
solutions de rechange, se tournant vers des orig<strong>in</strong>es <strong>in</strong>diennes, sud-africa<strong>in</strong>es<br />
et vietnamiennes.<br />
36
5.0 Afrique de l’Ouest : profils des<br />
marchés du Sénégal, du Mali,<br />
du Niger et du Nigeria<br />
5.1 Introduction<br />
Cette section fournira un résumé des modèles de marché d’arachide dans les<br />
quatre pays concernés dans un contexte sous-régional.<br />
Comme décrit dans la section Méthodologie ci-dessus, une multitude de<br />
méthodes <strong>in</strong>vestigatrices, de personnes contactées et de ressources<br />
documentaires, y compris des rapports publiés et non publiés, ont été<br />
employées comme base sur laquelle les profils suivants des pays ont été<br />
développés.<br />
Comme il n’était pas possible d’accéder avec précision aux mêmes<br />
données pour chacun des quatre pays ciblés, et que certa<strong>in</strong>es des données<br />
officielles semblent contradictoires par moment, ce qui suit ne devrait pas être<br />
lu comme une comparaison stricte des quatre secteurs nationaux d’arachide<br />
décrits ci-dessous selon des critères identiques, mais plutôt comme un bref<br />
aperçu par pays en utilisant les données disponibles.<br />
Tandis que les profils des pays fournissent un résumé précis de chacun<br />
des quatre pays du projet, il est plus difficile de présenter un schéma régional.<br />
Bien que des fragments d’ensemble aient été glanés pendant l’étude de chaque<br />
pays, les données spécifiques sur les volumes réels vendus demeurent <strong>in</strong>égales<br />
et contradictoires ; dans certa<strong>in</strong>s cas les figures officielles vont directement<br />
contre la logique économique la plus élémentaire.<br />
Néanmo<strong>in</strong>s, la signification des échanges régionaux des produits<br />
arachidiers pour chacun des pays étudiés ne peut être faussée et les tendances<br />
d’échanges régionales entre les quatre pays producteurs sont claires.<br />
Cycle de comparaison des prix<br />
La comparaison des prix d’arachide entre les quatre pays producteurs est<br />
facilitée par le fait que parmi les quatre, trois partagent une devise commune :<br />
le franc CFA (fCFA). Dans le cas du Nigeria, des données ont été présentées<br />
en Naira nigérian et en fCFA pour la comparaison. Il convient de noter que<br />
pendant la période de l’étude (janvier 2002 à décembre 2003) le Naira a<br />
perdu plus de 41 % de sa valeur face au CFA. Cependant, les implications d’un<br />
37
taux de change officiel très fluide entre le Naira et le CFA ne peuvent pas être<br />
entièrement adressées ici. J’ai choisi d’<strong>in</strong>clure le taux de change mensuel<br />
courant pour illustrer la référence.<br />
Un obstacle secondaire (cependant plus significatif peut-être) à la<br />
comparaison des cycles annuels des prix entre les marchés se situe au niveau<br />
du manque de figures fiables servant d’<strong>in</strong>dicateurs de volumes vendus à un<br />
prix particulier. C’est-à-dire, si un mois (à un prix « a ») explique une grande<br />
prépondérance de ventes d’arachide, et un mois différent (à un prix « k ») une<br />
fraction m<strong>in</strong>uscule, il serait imprécis et trompeur d’accorder aux deux prix le<br />
même poids en faisant leur moyenne (avec les autres prix/mois) pour lesquels<br />
les données étaient disponibles pour ce marché particulier. En raison de cette<br />
<strong>in</strong>certitude, des moyennes annuelles des prix sont <strong>in</strong>diquées comme<br />
« moyennes » et sont prises en compte comme « brutes et sales » pour la<br />
comparaison des marchés étudiés.<br />
En conclusion, la fiabilité des données des prix n’est pas entièrement<br />
assurée. L’absence des figures pendant un mois donné (comme <strong>in</strong>diqué par le<br />
« - ») peut <strong>in</strong>diquer un manque de documentation, et pas nécessairement un<br />
manque de produit réellement en vente en ce moment précis. Quelques<br />
données semblent contradictoires ici également ; sur plusieurs marchés, le<br />
prix d’un produit donné chute le mois précédant avant qu’il ne disparaisse<br />
(apparemment), contrairement à la notion simple que la pénurie <strong>in</strong>fluence le<br />
prix. Cependant, étant donné que la qualité du produit dim<strong>in</strong>ue avec le temps,<br />
il est possible que cette baisse de prix représente les « restes » de récoltes, par<br />
conséquent le prix <strong>in</strong>férieur, dans la mesure où toute l’arachide de « qualité »<br />
avait été vendue au préalable.<br />
Néanmo<strong>in</strong>s, les différences entre les cycles de prix semblent assez<br />
prononcées pour fournir une <strong>in</strong>dication du modèle de rémunération, les prix<br />
tendant à être plus élevés, se rapprochant de la demande, en particulier pour<br />
les <strong>in</strong>dustries de trans<strong>for</strong>mation qui achètent l’arachide, ou aux frontières<br />
nationales en route vers les centres régionaux de demande.<br />
5.2 Sénégal<br />
Production<br />
La production d’arachide dans ce pays est historique à tout po<strong>in</strong>t de vue, le<br />
Sénégal étant le po<strong>in</strong>t d’entrée de la culture en Afrique de l’Ouest, il y a<br />
38
presque deux cents ans. A partir de 1998, environ un million de personnes (un<br />
dixième de la population) ont été impliquées dans la production et la<br />
trans<strong>for</strong>mation de l’arachide (Akobundu 1998). Toutefois, au cours de ces<br />
dernières années, les modèles de culture dans le « bass<strong>in</strong> arachidier »<br />
sénégalais se sont éloignés de l’arachide, allant vers le maïs et d’autres récoltes<br />
vivrières, a<strong>in</strong>si que le coton (Afrol mars 2002).<br />
La production d’arachide a historiquement été en grande partie<br />
consacrée au sous-secteur de gra<strong>in</strong>e oléag<strong>in</strong>euse (par une évaluation récente<br />
du CIRAD, à un facteur de 95 %). Sur le marché mondial, le Sénégal et<br />
l’Argent<strong>in</strong>e sont les deux pr<strong>in</strong>cipaux exportateurs d’huile d’arachide,<br />
pr<strong>in</strong>cipalement vers l’Europe, les Etats-Unis et la Ch<strong>in</strong>e. Parmi les quatre pays<br />
du projet, le Sénégal est en tête des exportations d’arachide, en particulier<br />
vers l’Europe. Cependant, avec l’adoption des règlements européens actuels<br />
sur l’aflatox<strong>in</strong>e, ces exportations ont été sérieusement réduites.<br />
L’organisation française de recherches appliquées, le CIRAD, s’est<br />
<strong>in</strong>vestie dans le développement du sous-secteur de l’arachide de bouche ou<br />
ARB ou de confiserie en fonction des variétés améliorées et la culture irriguée.<br />
Le CIRAD et l’Institut de Technologie Alimentaire (ITA) s’engagent à établir<br />
un système d’homologation de contrôle de qualité et de système de<br />
certification de qualité, faisant a<strong>in</strong>si revivre « la marque » sénégalaise par une<br />
étiquette <strong>in</strong>ternationale reconnue de qualité (Dimanche et Kane 2002).<br />
Cependant, le facteur technique limitant le développement d’un marché<br />
d’exportation pour l’arachide de bouche demeure le beso<strong>in</strong> de prise en<br />
compte par les producteurs de techniques améliorées de production et de<br />
récolte en vu d’adresser la menace d’Aspergillus pour le contrôle de la qualité<br />
du produit.<br />
Pendant la récolte d’arachide de 2003, d’énormes tas de plants<br />
d’arachide séchant au soleil ont été observés au milieu des champs à<br />
travers « le bass<strong>in</strong> arachidier » comme ils l’ont été au cours des récoltes<br />
pendant plusieurs décennies, ouverts aux éléments et susceptibles d’être<br />
<strong>in</strong>fectés par l’Aspergillus sous n’importe quel climat, comme cela a été le cas<br />
l’année dernière.<br />
La production d’arachide pendant la récolte de 2003 a été relativement<br />
faible (bien que 4.800.000 TM aient été prévues à l’orig<strong>in</strong>e, 4.650.000 TM<br />
ont été réalisées) ayant pour résultat une réponse commerciale enthousiaste<br />
des producteurs <strong>in</strong>diens qui ont saisi cette occasion pour rejo<strong>in</strong>dre le marché<br />
<strong>in</strong>ternational de l’huile d’arachide avec l’exportation de 50.000 TM prévue<br />
cette année, après une absence de 40 ans (Times of India 2004).<br />
39
Enquête sur le secteur de l’arachide<br />
Un total de 228 ménages ont été étudiés, parmi lesquels 216 produisent de<br />
l’arachide. Les modèles de production dans cet échantillon étaient <strong>for</strong>tement<br />
biaisés vers l’arachide d’huilerie (97 % des producteurs). Seulement 21 % des<br />
producteurs étudiés a produit la variété rentable d’arachide de bouche ou<br />
ARB, et seulement 4 % ont produit les semences, parmi lesquelles aucune<br />
n’était de niveau N1 exigé par le programme commercial de multiplication des<br />
semences.<br />
Plus de 78 % de répondants ont estimé qu’ils n’ont pas eu un accès<br />
suffisant aux semences d’arachide. 89 % des répondants ont utilisé leurs<br />
propres semences (« ord<strong>in</strong>aires »), seuls 72 % ont acheté n’importe quelles<br />
semences, et 25 % seulement ont utilisé des semences améliorées (N 2).<br />
Par rapport à leur valeur élevée, plus de 90 % des producteurs d’ARB et<br />
tous les producteurs de semences ont acheté des semences, tandis que seuls<br />
60 % des producteurs d’oléag<strong>in</strong>eux ont <strong>in</strong>vesti dans l’achat de semences pour<br />
compléter leurs propres semences.<br />
Production et vente<br />
Le commerce d’arachide au Sénégal a été caractérisé par une <strong>in</strong>tervention<br />
musclée et un contrôle de l’état, avec les prix annuels fixés à l’avance et sur<br />
une base « pana-territoriale » (Gray 2002), uni<strong>for</strong>mes à travers le pays sans<br />
rapport avec la proximité des secteurs ou <strong>in</strong>dustries de production. La majeure<br />
partie de la récolte a été vendue aux huileries d’Etat, qui sont encore en<br />
fonction.<br />
À la différence des profils des trois autres pays, dans lesquels le secteur<br />
arachide a été libéralisé et privatisé au début des années 90, où les subventions<br />
et les taxes protectrices ont été supprimées, le gouvernement du Sénégal a<br />
persisté dans une approche <strong>in</strong>terventionniste dans le secteur de l’arachide, qui<br />
avait subi une série d’étapes mouvementées (pourtant limitées) depuis 1997,<br />
impliquant une pression très directe et concertée des établissements<br />
multilatéraux, en particulier de la Banque mondiale et de l’Union européenne.<br />
Tandis qu’un exposé complet du processus de libéralisation et de<br />
privatisation du secteur ouest africa<strong>in</strong> d’arachide dépasse le cadre de cette<br />
étude, Begh<strong>in</strong>, Diop, Matthey et Sewadeh, 2003 proposent un modèle pour la<br />
compréhension des effets des taxes protectionnistes, des subventions et autres<br />
<strong>for</strong>mes d’<strong>in</strong>tervention de l’état et le contrôle du secteur de l’arachide. En<br />
scrutant l’Afrique, ils observent :<br />
40
L’imposition de taxes sur des paysans producteurs d’arachide était<br />
<strong>for</strong>te dans les années 70, mais depuis le début des années 1990,<br />
quand les prix mondiaux ont dim<strong>in</strong>ué, la situation s’est <strong>in</strong>versée<br />
dans la majorité des pays africa<strong>in</strong>s (Badiane et K<strong>in</strong>teh 1994). Au<br />
Sénégal et en Gambie, le pr<strong>in</strong>cipal raisonnement de l’<strong>in</strong>tervention<br />
dans le secteur de l’arachide a été de sauvegarder la viabilité des<br />
us<strong>in</strong>es de trans<strong>for</strong>mation de l’Etat. En conséquence, les prix des<br />
producteurs d’arachide à l’exportation ont chuté à près de 60 %<br />
dans ces deux pays (Badiane et Gaye 1999). Cette politique a été<br />
contre-productive, puisqu’elle a poussé les paysans à éviter les<br />
grandes sociétés publiques de trans<strong>for</strong>mation, menant à une<br />
surproduction et à des difficultés f<strong>in</strong>ancières. Les politiques<br />
commerciales changent considérablement parmi les exportateurs<br />
traditionnels africa<strong>in</strong>s d’arachide. Le Sénégal et le Malawi<br />
appliquent des taxes aux dérivés et à l’huile d’arachide en vue<br />
d’encourager la trans<strong>for</strong>mation dans le pays (production d’huile<br />
dans le cas du Sénégal). En revanche, la Gambie et le Nigeria ont<br />
une politique commerciale libérale sans <strong>in</strong>terposition de frontière.<br />
La structure tarifaire de l’Afrique du Sud montre une légère<br />
escalade ; les arachides trans<strong>for</strong>mées sont sujettes à une taxe de 6 %<br />
tandis que les arachides non-trans<strong>for</strong>mées entrent sans droits de<br />
douane. Le commerce d’état se produit dans plusieurs pays,<br />
permettant l’application de taxes sur les importations d’huile (au<br />
Sénégal par exemple).<br />
L’annexe 4, Les politiques commerciales nationales actuelles sur<br />
l’arachide (2003), montre les diverses taxes appliquées par les pays africa<strong>in</strong>s<br />
sur les produits trans<strong>for</strong>més (Begh<strong>in</strong>, Diop, Matthey et Sewade, 2003).<br />
Sous la pression de la Banque mondiale et de l’Union européenne, le<br />
gouvernement du Sénégal a au cours de ces dernières années commencé à<br />
libéraliser le secteur de l’arachide, y compris la dissolution de l’ancien<br />
monopole d’état sur le commerce du produit et l’actuelle privatisation prévue<br />
des us<strong>in</strong>es à huile toujours actionnées par la société d’état SONACOS.<br />
Cependant, le processus n’a pas rencontré un succès unanime ; au début,<br />
les producteurs étaient réticents à embrasser le « marché libre » et pour<br />
m<strong>in</strong>imiser les risques, ils se sont précautionneusement dirigés vers des ventes<br />
au marché libre, tout en ma<strong>in</strong>tenant une <strong>for</strong>te tendance vendre aux organes<br />
étatiques au prix autrefois exigé (fixe). Cette tendance commerciale<br />
41
conservatrice du producteur est expliquée comme étant une stratégie pour<br />
réduire les risques au m<strong>in</strong>imum, puisque les producteurs endurent une<br />
existence très précaire – engendrée par une pluviométrie irrégulière, la<br />
dégradation de l’environnement et les pressions des populations sur la terre –<br />
qui, en termes économiques stricts n’arrive pas à se payer elle-même (Gray<br />
2002).<br />
En novembre 2001, Sonagra<strong>in</strong>es, la structure étatique qui organise la<br />
majeure partie de la collecte et du transport de l’arachide au Sénégal à travers<br />
le marché officiel, a été <strong>for</strong>cé de disparaître brutalement sous la pression de la<br />
Banque mondiale et de l’Union européenne, af<strong>in</strong> de permettre le<br />
développement de solutions alternatives privées qui cependant étaient lentes<br />
à se développer. Les fermiers étaient confus quant à la vente de leurs produits<br />
et il a été rapporté que des transporteurs privés, profitant de la situation, ont<br />
acheté des stocks d’arachide à des prix très réduits (Afrol, avril 2002).<br />
Bien que les huileries appartenaient encore à la SONACOS au moment<br />
de l’étude, la vente de SONACOS était imm<strong>in</strong>ente au cours de la dernière<br />
année, une question importante demeure :sera elle vendue sous <strong>for</strong>me d’unité<br />
(comme semble le souhaiter le gouvernement du Sénégal) ou fractionnée (le<br />
souhait de la Banque mondiale parait-il) ?.<br />
En attendant, le marché n’a toujours pas tenu sans SONACOS, qui a<br />
<strong>in</strong>stallé 600 po<strong>in</strong>ts de vente et de collecte pour la récolte de 2003 d’une<br />
production de 400.000 TM. Bien que cette figure soit supérieure à la capacité<br />
des huileries de la SONACOS, on s’attend à ce que la quantité entière soit<br />
achetée par la SONACOS cette année.<br />
Établissement des prix du produit<br />
Cette section sur le profil des pays s’<strong>in</strong>spirera <strong>for</strong>tement d’une thèse récente<br />
de Ph.D. (Le marché de l’arachide au Sénégal : Examen de prix et de<br />
modifications de politiques) par Dr James Katon Gray, qui déjà a été cité deux<br />
fois ci-dessus. L’étude sur laquelle la thèse est basée convient admirablement à<br />
l’analyse (statistiquement valide) du secteur de l’arachide au Sénégal tel qu’il<br />
se présente aujourd’hui, et qu’en temps opportun elle favorise les objectifs de<br />
cette étude. Dr Gray a également consenti à communiquer avec l’auteur en<br />
réponse aux questions spécifiques soulevées par l’étude du Sénégal (Gray,<br />
2004, communication personnelle).<br />
Dans sa thèse, Dr Gray exam<strong>in</strong>e les impacts micro-économiques récents<br />
(et actuels) sur le producteur – et de ce fait l’économie de production elle-<br />
42
même – résultant des premières étapes vers la « libéralisation » du secteur de<br />
l’arachide au Sénégal. Dans sa thèse, Dr Gray propose l’abolition du système<br />
pana-territorial des prix « ce qui aurait un avantage global sur la société<br />
sénégalaise » même si les producteurs éloignés des huileries seront confrontés<br />
à des prix <strong>in</strong>férieurs compte tenu des frais de transport.<br />
Marché Officiel<br />
La libéralisation du secteur de l’arachide au Sénégal a commencé en 1995,<br />
deux ans avant l’étude comme <strong>in</strong>diqué dans le tableau 3. Comme <strong>in</strong>diqué cidessous,<br />
les producteurs ont choisi de ne pas s’aventurer lo<strong>in</strong> des canaux de<br />
vente existants mandatés par l’état.<br />
Tableau 3. La vente de l’arachide au marché officiel en percentage de la production<br />
dans les deux années aprés la liberation du marché.<br />
Département 1995/96 1996/97<br />
Kaolack 77 % 72 %<br />
Fatick 70 % 72 %<br />
Foundiougne 84 % 82 %<br />
Gossas 63 % 46 %<br />
Nioro 65 % 76 %<br />
Kaffr<strong>in</strong>e 69 % 50 %<br />
Moyenne totale 72 % 65 %<br />
Source : Gaye, mars, 1998 dans Gray 2002<br />
Ventes d’arachide dans le circuit officiel comme pourcentage de<br />
production : les deux premières années d’échange suivant la libéralisation.<br />
Bien qu’environ 25 % des répondants aient choisi d’accéder au marché<br />
libre avec leur produit, presque 75 % des ménages de producteurs ont<br />
cont<strong>in</strong>ué à vendre sur le marché officiel. Les huileries appartenaient aux<br />
structures étatiques – comme elles restent les seules aujourd’hui, si seulement<br />
elles étaient justes – et les acquéreurs ont cont<strong>in</strong>ué à acheter la production des<br />
paysans au prix officiel (1997) de 150 fCFA par kilogramme.<br />
Les prix et les canaux officiels de vente pour les trois types d’arachides<br />
changent, avec une <strong>for</strong>te prédom<strong>in</strong>ance des oléag<strong>in</strong>eux de mo<strong>in</strong>dre valeur,<br />
43
comme <strong>in</strong>diqué ci-dessus. Quelques paysans <strong>in</strong>vestissent plus dans la<br />
production de l’ARB qui a une grande valeur et certa<strong>in</strong>s sont contractés pour<br />
multiplier les semences N1 pour produire des semences améliorées N2, avec<br />
les <strong>in</strong>trants nécessaires en engrais et en fongicide.<br />
Dans l’étude, plus de 77 % de la production officielle sur le marché était<br />
des oléag<strong>in</strong>eux, 20 % d’ARB et mo<strong>in</strong>s de 3 % étaient des semences. Parmi les<br />
169 ménages qui ont vendu l’arachide, 86 % ont vendu des oléag<strong>in</strong>eux (une<br />
moyenne de 2.3 TM par ménage) ; 35 % ont vendu de l’ARB (une moyenne de<br />
1.5 TM par ménage) et 4 % ont vendu des semences (une moyenne de 1.5<br />
TM).<br />
L’établissement des prix du produit montre une différenciation dist<strong>in</strong>cte<br />
– pas <strong>for</strong>te cependant – par type de produit, avec peu de variation dans ces<br />
catégories de prix. Tandis que 97 % des 302 producteurs qui ont vendu des<br />
oléag<strong>in</strong>eux obtenaient le prix officiel de 150 fCFA par kilogramme, trois<br />
vendeurs ont obtenu mo<strong>in</strong>s que le prix officiel, avec respectivement des prix<br />
de 102, 109 et 110 fCFA par kilogramme.<br />
La rémunération de l’ARB ne s’est pas avérée proportionnelle à<br />
l’<strong>in</strong>vestissement requis comme on aurait pu s’y attendre ; près de la moitié des<br />
vendeurs d’ARB ont reçu seulement le prix officiel du marché, 150 fCFA par<br />
kilogramme, et près d’un quart ont reçu seulement 151 fCFA ; 20 % ont reçu<br />
plus de 155 fCFA et seulement 6 % ont reçu plus de 160 fCFA par<br />
kilogramme pour leur produit.<br />
L’économie de la production d’ARB au Sénégal et les <strong>in</strong>terventions du<br />
CIRAD, ont été étudiées d’une manière détaillée par Louis Boakye-Yiadom,<br />
2003 dans An Economic Surplus Evaluation of Aflatox<strong>in</strong>-Reduc<strong>in</strong>g Research: A<br />
Case Study of Senegal’s Confectionery <strong>Groundnut</strong> Sector.<br />
Tableau 4. Prix officiels du marché de l’arachide, 2002.<br />
44<br />
Moyenne Ecart type Nombre d’observations<br />
Arachide huilerie 149.7 4.4 75<br />
Arachide de bouche 151.7 4.6 302<br />
Semence d’arachide 157.5 4.5 12<br />
De : Gray 2002
Le Marché libre<br />
Bien que prés de 25 % des ménages parmi les répondants aient vendu de<br />
l’arachide sur le marché libre (parallèle), plus des trois quarts ont cont<strong>in</strong>ué à<br />
vendre la majeure partie de leur production sur le marché officiel. Tandis<br />
qu’un total de 45 TM était vendu par des répondants sur le marché libre, ceci<br />
a représenté seulement 35 % du total vendu sur le marché (128 TM) et<br />
seulement 27 % de la production totale.<br />
Sur le marché libre, 95 % de l’arachide était en coque sèche ou CS.<br />
L’arachide s’est vendue sous toutes les autres <strong>for</strong>mes, décortiquée et triée ou<br />
D&T, arachides vertes et comme pâte d’arachide (sax-sax triturés ou SST)<br />
s’élevant à plus de 2 TM, sur un total de 404 TM exam<strong>in</strong>ées.<br />
Les écarts entre les prix de ces produits reflètent le poids de l’arachide<br />
coque et la valeur ajoutée par la trans<strong>for</strong>mation. Les prix des produits<br />
arachidiers sur le marché libre étaient en moyenne de 168 fCFA par<br />
kilogramme pour l’arachide coque (CS), de 223 fCFA/kg pour l’arachide<br />
décortiquée (D&T), de 168 fCFA/kg pour les arachides vertes et 350 fCFA/kg<br />
pour la pâte d’arachide.<br />
5.3 Mali<br />
Cette section présente un résumé de recherche appliquée sur la production et<br />
de commerce de l’arachide au Mali entrepris par l’Institut d’Économie Rurale<br />
(Kodio, 2003), avec référence spécifique aux études de cas dans chacun des<br />
trois pr<strong>in</strong>cipales zones de production ; Kita dans le secteur de production du<br />
sud-ouest, qui produit un tiers de la récolte totale ; Kolokani (zone de<br />
Bamako), et San (zone de production du sud).<br />
La production d’arachide au Mali a commencé vers 1840 et la production<br />
a augmenté de manière constante avant et après la deuxième guerre mondiale,<br />
quand la production s’est effondrée brusquement pendant quelques années.<br />
Bien que la production se soit développée rapidement pendant les années 60,<br />
le volume vendu à travers les canaux officiels a commencé à dim<strong>in</strong>uer. Le<br />
gouvernement du Mali a répondu en 1971 avec l’Opération Arachidière pour<br />
promouvoir la culture arachidière, organiser le réseau de commercialisation<br />
officiel et dissém<strong>in</strong>er les techniques améliorées de production. A<strong>in</strong>si<br />
commença une série de projets bilatéraux et multilatéraux qui visaient à<br />
augmenter la production et la productivité d’arachide et qui cont<strong>in</strong>uent à ce<br />
jour.<br />
45
À la différence du Sénégal, des prix sont négociés entre acheteurs et<br />
vendeurs sur chaque marché sans tenir compte des taux officiels mandatés.<br />
Les prix changent selon les marchés et dans le temps, durant toute l’année,<br />
compte tenu de l’abondance ou de la pénurie relative de l’arachide selon le<br />
caractère saisonnier de la récolte et de son commerce.<br />
Production et vente<br />
Les marchés d’arachide ont été étudiés dans les quatre pr<strong>in</strong>cipales zones de<br />
production de Kita, Bougouni, Kolokani et San, de 1995 à 2003. Des données<br />
<strong>in</strong>itiales ont été rassemblées par la Cellule de Planification et de Statistique,<br />
M<strong>in</strong>istère du Développement Rural et de l’Eau (Diagnostique de la Filière<br />
Arachide au Mali, 1998). Des données additionnelles ont été compilées par<br />
l’Institut d’Economie Rurale (Kodio 2003).<br />
Les variétés améliorées d’arachide actuellement cultivées au Mali sont<br />
Mossi-tiga (CN94-C), Saméké (JL 24), Kolofa (TS 32-1), 55-437, Niakhalitiga<br />
(GH119-20), Samakho (73-28), Waliyar-tiga (ICG 7878), ICG(FDRS)4,<br />
Kaarta-tiga, 47-10, 28-206, Fleur 11, et 47-10.<br />
Environ 60 % de la production a atte<strong>in</strong>t le marché, en majorité de<br />
l’arachide coque. Selon l’IER, l’arachide coque a représenté 65 % du volume<br />
vendu au marché, plus de 90 % à Kita, Bougouni et San. C’est à Kolokani seule<br />
que la majorité des producteurs ont <strong>in</strong>vesti dans plus de trans<strong>for</strong>mation pour<br />
vendre un produit décortiqué, représentant a<strong>in</strong>si 83 % du volume vendu sur le<br />
marché.<br />
Le caractère saisonnier du commerce d’arachide et le cycle saisonnier des<br />
prix changent entre les quatre secteurs de production étudiés. A Kita,<br />
Kolokani et San, les ventes de produit sont bien distribuées tout au long de<br />
l’année, avec la majorité du volume vendu de décembre à ju<strong>in</strong>, en janvier et<br />
ju<strong>in</strong>, et de décembre à août, respectivement.<br />
A Bougouni cependant, la culture irriguée permet aux producteurs de<br />
cultiver en contre-saison, af<strong>in</strong> de vendre 80 % de leur produit frais en août et<br />
septembre quand d’autres marchés sont à sec et que la demande est plus <strong>for</strong>te,<br />
et le reste à partir d’octobre à avril.<br />
Les prix les plus élevés de l’arachide coque sont obtenus en ju<strong>in</strong> et juillet<br />
pendant la saison de culture, quand l’arachide est rare sur la plupart des<br />
marchés.<br />
Dans les secteurs de production, le commerce d’arachide est entrepris<br />
par les paysans cherchant des revenus secondaires pendant la saison sèche<br />
46
suivant la récolte. Ils ont des contrats avec les grossistes <strong>in</strong>stallés dans les villes<br />
des zones de production, qui préf<strong>in</strong>ancent ou garantissent l’achat du produit<br />
collecté à un prix négocié d’avance. Les frais de transport changent<br />
considérablement d’un secteur à l’autre selon l’état des routes.<br />
Généralement ces « grossistes primaires » achètent seulement quand ils<br />
ont été préf<strong>in</strong>ancés, ou ont une garantie digne de confiance pour l’achat de<br />
leur produit par des grossistes secondaires basés à Bamako et Kayes, qui sont<br />
les centres de consommation et d’exportation. Ce système commercial est<br />
basé sur la confiance, a<strong>in</strong>si, il est difficile pour les nouveaux venus d’y entrer.<br />
La majorité de ces grossistes secondaires ne vendent pas exclusivement<br />
que l’arachide, mais plutôt une gamme des produits agricoles (y compris le<br />
mil, le sorgho et le maïs) comme stratégie pour réduire les risques au<br />
m<strong>in</strong>imum.<br />
Bien que les durées de stockage changent légèrement selon les secteurs<br />
de production, en général le marché favorise le mouvement du produit aussi<br />
vite que possible, et peu d’<strong>in</strong>vestissement est fait dans des traitements et des<br />
équipements de stockage. Pour a<strong>in</strong>si dire, il n’y a pas de spéculation, ce qui est<br />
en partie lié à un accès limité au capital.<br />
Établissement des prix du produit<br />
En général, les producteurs ont un pouvoir limité de négociation en ce qui<br />
concerne l’établissement des prix. Les prix sont fondamentalement négociés<br />
entre les grossistes primaires et secondaires, pas au niveau des secteurs de<br />
production, mais plutôt dans les centres de consommation et d’exportation.<br />
Le manque d’accès à l’<strong>in</strong><strong>for</strong>mation du marché au niveau des producteurs<br />
entrave considérablement leurs capacités de négociation. Car les grossistes<br />
sont relativement peu nombreux, urba<strong>in</strong>s et communiquent les uns avec les<br />
autres, ils ont la capacité de fixer les prix entre eux, alors que les producteurs<br />
– plus nombreux cependant – sont généralement dispersés et mal organisés,<br />
excepté à Kita.<br />
Comme au Niger et au Nigeria, les prix ne sont ni uni<strong>for</strong>mes à travers le<br />
pays (« pana-territorial » comme au Sénégal), ni « fixés » à l’année ; ils<br />
changent considérablement tout au long de l’année en fonction de leur<br />
disponibilité, selon le cycle annuel de production (figure 3).<br />
Tandis que la récolte s’étend d’octobre à décembre, la vente a lieu dans la<br />
plupart des secteurs de décembre à mai, voir début ju<strong>in</strong>. À partir d’avril<br />
jusqu’en août, les prix montent de façon constante quand le produit devient<br />
47
Figure 3. Fluctuations saisonnières des prix au niveau des producteurs sur le<br />
marché de Kita, janvier 1994–mai 1997.<br />
rare. Les prix chutent au plus bas à partir de septembre-novembre en<br />
prévision de la nouvelle récolte, due à la haute teneur en humidité et à<br />
l’altérabilité de la nouvelle récolte pendant qu’elle sèche, et probablement en<br />
réponse à la baisse de qualité des restes de la récolte précédente.<br />
Au Mali, il y a un écart entre les prix de l’arachide décortiquée<br />
manuellement et celle décortiquée à la mach<strong>in</strong>e. L’arachide décortiquée<br />
manuellement a obtenu un prix préférentiel de 10 à 25 fCFA par kilogramme<br />
par rapport au produit décortiqué à la mach<strong>in</strong>e qui est plus encl<strong>in</strong> à être<br />
endommagé, par exemple les gousses peuvent se fendre.<br />
Profils du marché<br />
Kita<br />
Un des premiers secteurs de production, Kita est considéré comme « le bass<strong>in</strong><br />
arachidier » du Mali, contribuant à plus de 21% de la production totale<br />
d’arachide du Mali.<br />
Les variétés les plus populaires à Kita sont la variété précoce 47-10 dans<br />
les zones du nord (Didjian, Sébécoro et Toukoto), et la variété tardive 28-206,<br />
qui demande plus d’eau (de l’ordre de 800-1000 millimètres) dans les zones<br />
du sud, Kokofata, Sagabari et Sirakoro. En général, les seuls <strong>in</strong>trants achetés<br />
sont des fongicides, car les engrais et les <strong>in</strong>secticides sont généralement<br />
considérés comme très onéreux par les producteurs.<br />
Comme <strong>in</strong>diqué ci-dessus, la vente de l’arachide a lieu tout au long de<br />
l’année, avec environ 60 % de la récolte vendue entre janvier et mai. Le<br />
48
stockage de l’arachide à la ferme se limite à 1 ou 2 mois. Les tendances<br />
récentes de production à Kita <strong>in</strong>diquent une plus grande volonté de la part des<br />
producteurs d’<strong>in</strong>vestir dans le transport en provenance des zones de<br />
production af<strong>in</strong> d’obtenir de meilleurs prix au marché de Kita.<br />
Les coûts de transport et de manipulation ont été calculés par l’IER à<br />
12.4 fCFA le kilogramme d’arachide décortiquée. Les paysans n’<strong>in</strong>vestissent<br />
pas habituellement leur temps dans le décorticage, qui est fait pr<strong>in</strong>cipalement<br />
par les collecteurs qui vendent aux grossistes primaires af<strong>in</strong> de réduire les frais<br />
de transport qui sont calculés par sac plutôt qu’au poids (Kodio, 2003).<br />
Les grossistes primaires de Kita ont vendu entre 190 et 1.000 TM<br />
d’arachide décortiquée pendant l’année de l’étude, quittant rarement Kita car<br />
le transport est devenu la responsabilité des paysans ou des collecteurs. Les<br />
durées de stockage sont limitées, une sema<strong>in</strong>e à un mois, reflétant<br />
partiellement des fonds de roulement d’exploitation limités.<br />
Les liens commerciaux s’étendent de Kita à Bamako comme centre de<br />
consommation (de près de la moitié de la récolte annuelle), et Kayes (25 à 30<br />
%) comme passage vers le Sénégal et au-delà. Des exportateurs gu<strong>in</strong>éens et<br />
ivoiriens opèrent également à Kita, mais seulement pendant la récolte et<br />
immédiatement après. Une partie de la production est achem<strong>in</strong>ée vers la<br />
Mauritanie, par le Sénégal ou directement par Nioro. Les exportateurs<br />
étrangers ne préf<strong>in</strong>ancent pas généralement ce qu’ils achètent, ils sont a<strong>in</strong>si<br />
obligés d’acheter au comptant ce que les grossistes primaires ont en stock à<br />
leur arrivée à Kita, sans <strong>in</strong>vestir dans des arrangements commerciaux à plus<br />
long terme.<br />
Selon le Système d’In<strong>for</strong>mation du Marché Céréalier (SIM), les prix du<br />
produit à Kita reflètent un différentiel de 10.2 fCFA entre le prix payé au<br />
producteur et le prix de vente au grossiste secondaire ou à l’exportateur.<br />
Le cycle annuel des prix de Kita montre un cycle ple<strong>in</strong> (différence entre<br />
les prix annuels les plus bas et les plus élevés) dans l’ordre d’un facteur de 2.3,<br />
s’étendant de 150 à près de 250 fCFA le kilogramme selon la saison.<br />
Il est <strong>in</strong>téressant de noter que la variété précoce 47-10 est appréciée en<br />
Côte d’Ivoire pour sa teneur élevée en huile, et elle obtient a<strong>in</strong>si un prix<br />
préférentiel de 5 à 25 fCFA de plus que la variété tardive 28-206. Les niveaux<br />
élevés d’impuretés ou d’humidité auront souvent comme conséquence un prix<br />
réduit payé au producteur ou au collecteur.<br />
49
Kolokani<br />
Comme Kita, Kolokani est l’une des zones de production d’arachide les plus<br />
anciennes du Mali. L’arachide est cultivée pr<strong>in</strong>cipalement dans les zones nord<br />
de la région, alors que le coton est développé au sud. Les rendements à<br />
Kolokani sont d’environ 700 kilogrammes par hectare, par rapport à une<br />
moyenne de 1.000 kilogrammes par hectare à Kita. Malgré ce rendement<br />
limité, l’arachide est la source pr<strong>in</strong>cipale de revenu dans les zones de<br />
production de Kolokani.<br />
La seule variété améliorée utilisée à Kolokani est 47-10 (variété<br />
précoce), car elle est mieux adaptée à la pluviométrie de la zone. Comme à<br />
Kita, les fongicides sont les seuls <strong>in</strong>trants employés par la majorité des paysans<br />
à Kolokani. La traction animale est un moyen important de l’agriculture.<br />
Les coûts de transport et de manipulation de l’arachide à Kolokani sont<br />
estimés par IER à fCFA 5.8 par transport de kilogramme pour lancer sur le<br />
marché est normalement entrepris par des collecteurs, car les producteurs ne<br />
peuvent pas se permettre de transporter leur produit. Les grossistes primaires<br />
de Kolokani se déplacent entre la TA 140 et 910 de l’arachide écossée<br />
annuellement, avec d’autres types de produit agricole.<br />
Les grossistes de Kolokani font un <strong>in</strong>vestissement sensiblement plus<br />
grand en stock, stockant le produit pendant 4 à 6 mois dans des buts purement<br />
spéculatifs, af<strong>in</strong> d’augmenter des bénéfices selon le cycle annuel des prix de<br />
l’arachide. Des stocks sont vendus en septembre af<strong>in</strong> d’éviter la chute annuelle<br />
des prix qui survient avec la nouvelle récolte.<br />
Environ 52 % de la récolte annuelle est dest<strong>in</strong>ée à Bamako, 36 % à Nara,<br />
un des deux passages vers la Mauritanie, et une partie à Nioro qui en est l’autre<br />
passage. Quelques acheteurs ivoiriens fréquentent également Kolokani. Une<br />
petite proportion de la production annuelle de Kolokani est achetée par des<br />
fabricants de pâte d’arachide.<br />
Les grossistes transporteront parfois leurs stocks à Nara, bien que les prix<br />
n’y soient pas particulièrement favorables, en dépit d’une <strong>for</strong>te demande en<br />
Mauritanie. Les grossistes n’amènent pas directement leur produit en<br />
Mauritanie pour des raisons de sécurité – ce qui peut expliquer la pression des<br />
prix à Nara, car ce sont les acheteurs mauritaniens qui doivent prendre des<br />
risques concernant leur sécurité en faisant l’aller et retour. Les prix de<br />
l’arachide décortiquée au marché de Kolokani varient entre 250 et 350 fCFA<br />
le kilogramme.<br />
50
San<br />
Secteur traditionnel (un peu négligé) de production d’arachide, San a<br />
commencé à se concentrer sur la production d’arachide dans le cadre d’un<br />
programme récent du gouvernement tendant à diversifier les revenus dans les<br />
secteurs défavorables à la culture du coton.<br />
Les rendements à San sont <strong>in</strong>férieurs à ceux de Kita ou Kolokani, se<br />
limitant à 640 kilogrammes à l’hectare dû à une pluviométrie limitée. San<br />
produit environ 5 % de la récolte totale nationale d’arachide.<br />
En plus des collecteurs qui fournissent les grossistes primaires à San, des<br />
commerçants ou des demi-grossistes opèrent également sur les marchés<br />
hebdomadaires des secteurs de production, notamment Téné et Tom<strong>in</strong>ian.<br />
Pour les grossistes de San, l’arachide est un produit d’importance<br />
secondaire, car ils sont pour la majorité spécialisés dans l’exploitation du mil,<br />
(vers les villes du nord comme Mopti et Gao) du riz, du sorgho et des haricots.<br />
Le volume d’arachide vendu par ces grossistes se limite entre 0.6 et 2.5 TM<br />
par an.<br />
Ceux qui achètent l’arachide des grossistes de San sont pr<strong>in</strong>cipalement<br />
des grossistes de Mopti et Gao, bien que des acheteurs ivoiriens viennent à<br />
San pour chercher Tigadièni, une variété locale d’arachide qui est <strong>for</strong>tement<br />
estimée en Côte d’Ivoire.<br />
Les données fiables des prix du marché pour San ne sont pas disponibles.<br />
Bougouni<br />
Les zones de production d’arachide de Bougouni sont divisées entre le Soudan<br />
humide et les zones sèches de la savane gu<strong>in</strong>éenne. Comme à San, les<br />
rendements d’arachide à Bougouni se limitent à 760 kilogrammes par hectare.<br />
Les producteurs de Bougouni sont spécialisés dans la production<br />
d’arachide fraîche dont la demande est très élevée à Bamako. Près de 80 % des<br />
ventes sont faites pendant août et septembre, juste avant la baisse des prix.<br />
Pendant que Bougouni est favorisé par la disponibilité du transport vers<br />
Bamako, les producteurs et les collecteurs tendent à vendre leur produit dans<br />
la ville. Le rôle des grossistes à Bougouni est m<strong>in</strong>ime, représentant seulement<br />
18 % environ du volume vendu. Les frais de transport à partir des secteurs de<br />
production sont estimés à 8.7 fCFA vers Bougouni et à 13 fCFA vers Bamako<br />
(IER 2003). Par conséquent, les grossistes sont obligés de se déplacer autour<br />
des secteurs de production pour chercher le produit, pour lequel ils doivent<br />
couvrir les frais de transport jusqu’à Bougouni.<br />
51
Le volume vendu par les grossistes de Bougouni s’élève de 16 à 300 TM<br />
par an. Environ 90 % du commerce a lieu entre octobre et avril.<br />
Tandis que les grossistes de Bamako achètent la première récolte (coque)<br />
en août et septembre, les exportateurs (venant de Côte d’Ivoire, de Gu<strong>in</strong>ée,<br />
de la Mauritanie et même d’Algérie) préfèrent en particulier la variété<br />
améliorée 47-10 dont la teneur en huile est très élevée. Les producteurs de<br />
pâte d’arachide font également parti des acheteurs, pour satisfaire la demande<br />
locale.<br />
5.4 Niger<br />
Qu<strong>in</strong>ze répondants – des paysans, des collecteurs, des commerçants, les<br />
fabricants artisanaux et <strong>in</strong>dustriels – ont été <strong>in</strong>terrogés à l’aide d’un<br />
questionnaire de ju<strong>in</strong> à septembre 2003 (voir les pages qui suivent). Trois<br />
répondants ont été <strong>in</strong>terrogés à Dosso, dix à Maradi, un à Dan Issa et un à<br />
Niamey. Des <strong>in</strong><strong>for</strong>mations statistiques complémentaires ont été obtenues du<br />
Système d’In<strong>for</strong>mation sur les Marchés Agricoles (SIMA) du M<strong>in</strong>istère de<br />
l’Agriculture. Le <strong>for</strong>mulaire SIMA de surveillance du marché a été reproduit<br />
suivant ce profil du pays.<br />
Ce profil du marché est basé sur les données actuelles collectées, tandis<br />
que les statistiques de prix du gouvernement sont aussi présentées pour les<br />
beso<strong>in</strong>s de comparaison, dans la plupart des cas, elles sont con<strong>for</strong>mes aux<br />
données collectées.<br />
52
Table 5. Figures de production 2000-2003, arachide coque.<br />
Cultivé Rendement Production<br />
Département (ha) (kg/ha) (TM)<br />
2000-2001<br />
Agadez 0 0 0<br />
Diffa 157 39 6<br />
Dosso 21,006 498 10,461<br />
Maradi 175,819 339 59,603<br />
Niamey 71 113 8<br />
Tahoua 19,830 296 5,870<br />
Tillabery 7,300 144 1,051<br />
Z<strong>in</strong>der 136,155 266 36,217<br />
NIGER<br />
2002-2003<br />
360,338 314 113,216<br />
Agadez 0 0 0<br />
Diffa 215 426 92<br />
Dosso 33,379 668 22,283<br />
Maradi 142,255 372 52,901<br />
Niamey - - -<br />
Tahoua 81,409 546 44,434<br />
Tillabery 8,279 399 3,302<br />
Z<strong>in</strong>der 69,018 445 30,717<br />
NIGER 334,555 460 153,729<br />
Source de données: Résultats Déf<strong>in</strong>itifs de la Campagne Agricole 2000/2001.<br />
53
Commerce d’arachide / Questionnaire de l’Association (CONFIDENTIEL)<br />
Nom du répondant :<br />
Date :<br />
Nom de la société :<br />
Adresse :<br />
Lieu :<br />
Tél./fax :<br />
Courrier électronique :<br />
1. Quels produits vendez-vous (semence, gra<strong>in</strong>, huile, autres) ?<br />
2. Pour les semences/ou gra<strong>in</strong>s, quels types, (variétés) préférez-vous ?<br />
3. Les variétés préférées ont-elles des prix différents des autres (si oui,<br />
comment ?)<br />
4. Quelles sont les pr<strong>in</strong>cipales zones de production (d’où vous achetez) ?<br />
4b. Achetez-vous au marché, chez les commerçants, chez les paysans<br />
<strong>in</strong>dividuels, ou dans les associations de paysans ? Avez-vous des contrats<br />
d’achat à long terme ?<br />
5. Comment le produit arrive-t-il à votre niveau ? (qui est responsable du<br />
transport ? A quel coût ?)<br />
6. Comment déterm<strong>in</strong>ez-vous la qualité du produit ?<br />
7. Comment déterm<strong>in</strong>ez-vous le prix d’achat ?<br />
8. A quel prix achetez-vous chaque mois ? (estimation et CONFIDENTIEL) :<br />
54<br />
a. Juillet<br />
b. Août<br />
c. Septembre<br />
d. Octobre<br />
e. Novembre<br />
f. Décembre<br />
g. Janvier<br />
h. Février<br />
i. Mars<br />
j. Avril<br />
k. Mai<br />
l. Ju<strong>in</strong><br />
Niveau<br />
Prix « moyen » (prix le plus bas – le plus élevé) :
9. Qui achète vos produits ? (Où) ? A combien d’acheteurs vendez-vous ?<br />
10. Comment déterm<strong>in</strong>ez-vous vos prix de vente ? Commerce d’arachide /<br />
Questionnaire de l’Association (suite)<br />
11. L’acheteur préfère-t-il une variété particulière (de semence ou de gra<strong>in</strong>) ?<br />
12. Les variétés préférées ont-elles des prix différents des autres (si oui,<br />
comment) ?<br />
L’acheteur exige-t-il une qualité particulière ? (si oui, comment est-elle<br />
déterm<strong>in</strong>ée) ?<br />
13. Comment trouvez-vous l’acheteur (ou comment l’acheteur vous trouvet-il)<br />
?<br />
14. Comment le produit arrive chez l’acheteur (qui est responsable du<br />
transport, à quel coût) ? D’autres frais sont-il payés à part le transport ?<br />
15. A quel prix vendez-vous chaque mois (estimation et CONFIDENTIEL) :<br />
a. Juillet<br />
b. Août<br />
c. Septembre<br />
d. Octobre<br />
e. Novembre<br />
f. Décembre<br />
g. Janvier<br />
h. Février<br />
i. Mars<br />
j. Avril<br />
k. Mai<br />
l. Ju<strong>in</strong><br />
Niveau<br />
Prix « moyen » (prix le plus bas – le plus élevé) :<br />
16. Quel volume de chaque produit avez-vous vendu cette année ?<br />
17. L’année passée ?<br />
18. Quel volume avez-vous l’<strong>in</strong>tention de vendre cette année ?<br />
19. Quelle est la dest<strong>in</strong>ation f<strong>in</strong>ale de votre produit (vos produits) ?<br />
20. Avez-vous pu exporter votre produit (vos produits) en dehors du Niger ?<br />
21. Comptez-vous faire d’autres exportations dans le futur (si non, pourquoi<br />
pas) ?<br />
22. Quels sont les plus grands obstacles à votre commerce ? (Qu’est ce qui<br />
limite le volume que vous achetez/vendez ? Qu’est ce qui peut provoquer<br />
la baisse de vos prix (plus que vous ne l’aviez envisagé) ?<br />
23. Que devez-vous entreprendre (ou que d’autres personnes doivent<br />
entreprendre) pour agrandir votre commerce ?<br />
55
Résultats de l’étude<br />
Niamey<br />
Niamey est le centre national de consommation, le po<strong>in</strong>t de transit et le centre<br />
commercial entre le « Bass<strong>in</strong> arachidier » nigérien et les régions de Dosso,<br />
Maradi et Z<strong>in</strong>der et les routes commerciales du nord du Mali (Ayorou vers<br />
Gao) et le Burk<strong>in</strong>a Faso (Torodi vers Fada N’Gourma).<br />
Comme au Sénégal (mais pas au Mali), les centres <strong>in</strong>dustriels sont plus<br />
proches des zones de production que de la capitale (Maradi en particulier),<br />
donc la majeure partie du volume vendu ne passe pas <strong>for</strong>cement par Niamey<br />
comme c’est le cas à Bamako.<br />
La majeure partie du commerce régional implique l’importation et<br />
l’exportation entre les zones de production, les marchés et les centres<br />
<strong>in</strong>dustriels d’offre du Nigeria – Sokoto, Kats<strong>in</strong>a, Kano et Maiduguri. Le<br />
commerce d’arachide se fait avec le Nigeria, le Bén<strong>in</strong>, le Burk<strong>in</strong>a Faso, le<br />
Ghana, la Côte d’Ivoire, peut être avec le Tchad et la Libye sous toutes les<br />
<strong>for</strong>mes, coque, décortiquée, comme huile et comme tourteaux.<br />
Un grossiste <strong>in</strong>terrogé à Niamey vend entre 100 et 133 TM par an à des<br />
acheteurs venant du Niger, du Burk<strong>in</strong>a Faso et du Bén<strong>in</strong>. Ce commerçant paie<br />
25,000 fCFA par mois de location pour le stockage, ce qui veut dire un surplus<br />
de 2.25 à 3.00 fCFA par kilogramme pour le stockage. Généralement le<br />
transport est assuré par le vendeur et l’acheteur ensemble. Le transport coûte<br />
à peu près 6.67 fCFA le kilogramme d’arachide coque.<br />
Le prix de l’arachide (coque par sac d’environ 45 kilogrammes) à Niamey<br />
ne varie pas beaucoup, allant de 155 fCFA par kilogramme durant la récolte à<br />
267 fCFA le kilogramme en juillet et août – un facteur de 1.7 seulement.<br />
Dosso<br />
La région de Dosso s’étend du sud de Niamey à la frontière du Bén<strong>in</strong> à Gaya/<br />
Malanville. La production d’arachide dans cette zone est pr<strong>in</strong>cipalement une<br />
activité fém<strong>in</strong><strong>in</strong>e, pour la fabrication d’huile et de kulikuli pour la<br />
consommation des ménages et pour la vente. Les revenus générés par la vente<br />
de l’arachide, d’huile d’arachide et de kulikuli sont généralement utilisés pour<br />
subvenir aux beso<strong>in</strong>s des ménages, y compris pour la santé des enfants et<br />
l’éducation.<br />
56
Le caractère saisonnier de la production et du commerce est con<strong>for</strong>me à<br />
ceux du Sénégal et du Mali, la récolte débute en octobre, la majeure partie du<br />
commerce se faisant d’octobre à janvier quand les prix sont au plus bas.<br />
Une paysanne à Boboye vend localement entre 450 et 675 kilogrammes<br />
d’arachide décortiquée par an, alors qu’une coopérative de 20 paysans vend<br />
entre 54 et 90 TM d’arachide décortiquée chaque année. Une paysanne<br />
productrice d’huile et de kulikuli vend localement 200 à 300 litres (180-270<br />
kg) d’huile d’arachide par an, mais elle ne comptabilise pas la quantité de<br />
kulikuli vendue.<br />
Les prix de l’arachide à Dosso (coque, par sac d’environ 45 kilogrammes)<br />
change tout au long de l’année, de 67 fCFA le kilogramme durant la récolte<br />
(octobre et novembre) à 267 fCFA le kilogramme de mai à septembre – un<br />
facteur de 4.<br />
Le prix de l’huile d’arachide varie entre 500 fCFA le litre (septembre et<br />
octobre) et 1,000 fCFA le litre (mai) – un facteur de 2.<br />
Maradi<br />
Maradi est le centre du « Bass<strong>in</strong> arachidier » en termes aussi bien géographique<br />
que commercial et <strong>in</strong>dustriel. La société OLGA, l’huilerie prédom<strong>in</strong>ante<br />
(privée) est basée à Maradi.<br />
OLGA achète un m<strong>in</strong>imum de 90 à 175 TM d’arachide deux à trois fois<br />
par an, dans les zones de production de Maradi, Tahoue, Z<strong>in</strong>der, Konni et aussi<br />
lo<strong>in</strong> qu’au Nigeria, à Dosso et à Gaya. Entre 2002 et 2003, OLGA a augmenté<br />
sa production et ses ventes d’huile d’arachide de 495 à 1,080 TM, vendue aux<br />
acheteurs de Niamey, du Nigeria et du Burk<strong>in</strong>a Faso.<br />
Un paysan de Dan Issa recrute de la ma<strong>in</strong>-d’œuvre et vend localement<br />
entre 1.8 et 2.7 TM d’arachide coque par an aux acheteurs de Maradi et du<br />
Nigeria. Le stockage est réduit au m<strong>in</strong>imum au niveau de la ferme.<br />
Les prix de l’arachide coque à Maradi sont comparables à ceux de<br />
Niamey, une résultante directe de la <strong>for</strong>te demande <strong>in</strong>dustrielle (non satisfaite<br />
actuellement), à Maradi même a<strong>in</strong>si qu’au-delà de la frontière à Kats<strong>in</strong>a, Kano<br />
et Zaria. Tandis que le commerce des produits dérivés de l’arachide prospère<br />
dans les deux directions, le Niger est actuellement devenu un importateur<br />
d’arachide (décortiquée et coque), d’huile d’arachide et de tourteaux.<br />
Les prix de l’arachide coque (par sac d’environ 45 kilogrammes) varie<br />
entre 133 fCFA durant la récolte (septembre à novembre) et 267 fCFA le<br />
kilogramme en juillet et août – un facteur de 2.0.<br />
57
Les grossistes de Maradi font un bénéfice de 11 à 33 fCFA sur le<br />
kilogramme d’arachide coque. Il est <strong>in</strong>téressant de noter que les marges<br />
bénéficiaires sont les plus élevées entre septembre et novembre, juste après la<br />
récolte et durant la saison commerciale quand les prix sont au plus bas – ces<br />
profits représentant près de 20 % de leur prix de vente durant le pic de la<br />
saison commerciale. Les grossistes <strong>in</strong>terrogés à Maradi ont vendu entre 6.7 et<br />
1500 TM aux huileries OLGA et aux acheteurs du Nigeria, de la Côte d’Ivoire<br />
et du Ghana.<br />
Pour l’arachide importée du Nigeria, les frais de transport (de 500 fCFA<br />
le sac) sont de 11 fCFA le kilogramme d’arachide coque ou 5.3 fCFA le<br />
kilogramme d’arachide décortiquée, les prix étant calculés en volume non en<br />
poids. Les frais de douanes sont de 1,000 fCFA par sac ou 10.5 fCFA le<br />
kilogramme d’arachide décortiquée.<br />
Les prix de l’arachide coque varient entre 263 fCFA le kilogramme<br />
(d’octobre à décembre) et 347 fCFA (de ju<strong>in</strong> à août) – un facteur de 1.3.<br />
Cependant, ce prix élevé semble faible par rapport au prix standard de<br />
conversion de 0.507 pour l’arachide coque à l’arachide décortiquée<br />
(Danguioua 2000), quand le prix faible est disponible.<br />
Les prix de l’huile d’arachide artisanale varient entre 575 fCFA le litre<br />
(d’octobre à janvier) à 1,000 fCFA le litre entre juillet et septembre – un<br />
facteur de 1.7 – alors que le prix de l’huile <strong>in</strong>dustrielle OLGA reste constant à<br />
955 fCFA le litre.<br />
Les prix de l’arachide en nourriture sous <strong>for</strong>me de kulikuli (sac de 25<br />
kilogrammes) varient entre 55 fCFA le kilogramme à la récolte et 100 fCFA le<br />
kilogramme au producteur ou au collecteur, une variation de 1.8.<br />
Une coopérative <strong>in</strong>terrogée à Dan Issa a produit 1,966 litres d’huile<br />
d’arachide l’année dernière et compte faire du profit cette année en vendant<br />
aux consommateurs de Maradi, de Niamey, du Nigeria, du Ghana et (comme<br />
auparavant) de la Côte d’Ivoire – cette dernière n’étant plus un marché actif à<br />
cause de la guerre. La coopérative a également vendu 5,000 kilogrammes de<br />
nourriture trans<strong>for</strong>mée (sous <strong>for</strong>me de kulikuli), aux acheteurs du marché<br />
local de Maradi et au Nigeria.<br />
5.5 Nigeria<br />
Ancien premier exportateur mondial d’arachide avec 500,000 tonnes par an<br />
(Purseglove 1968), le décl<strong>in</strong> du secteur de l’arachide au Nigeria a été très<br />
58
egretté, mais selon de récentes figures de FAOSTAT, l’arachide nigériane<br />
représente toujours 41 % de la production totale d’Afrique de l’Ouest.<br />
Comme au Sénégal, la majeure partie de la production est dest<strong>in</strong>ée aux<br />
huileries pour satisfaire l’importante demande locale pour l’huile d’arachide<br />
(Kettlewell 2003). Les pr<strong>in</strong>cipaux états producteurs sont Kano, Kats<strong>in</strong>a,<br />
Kaduna, Sokoto, Jigawa et Kebbi au nord ouest ; Bauchi, Yobe et Borno au<br />
nord est ; et Jos Plateau, Benue et Niger State au centre du pays.<br />
Production et vente<br />
La production d’arachide a sérieusement commencé au Nigeria vers 1912<br />
quand les producteurs du nord du Nigeria ont été encouragés à cultiver de<br />
l’arachide à cause des prix mondiaux élevés. La ville de Kano dev<strong>in</strong>t alors le<br />
cœur « du Bass<strong>in</strong> arachidier » nigérian, citée sur la voie ferroviaire en route<br />
vers le port de Lagos. Au pic du boum de l’arachide des années 60, la<br />
production dépassa la capacité des wagons des chem<strong>in</strong>s de fer du Nigeria,<br />
l’arachide récoltée était a<strong>in</strong>si stockée dans des sacs <strong>for</strong>mant de gigantesques<br />
pyramides qui s’entassèrent, couvrant une grande partie du ciel de Kano en<br />
attendant d’être exportés par rail de Lagos vers l’Europe.<br />
Les célèbres (anciennes) pyramides d’arachide de Kano<br />
Source : Internet<br />
Les fières pyramides d’arachide de Kano ont disparu, laissant un goût<br />
nostalgique qui refait surface lors d’appels politiques pour restaurer la<br />
glorieuse production agricole du nord du Nigeria.<br />
Le secteur nigérian de l’arachide était bien structuré et bien organisé,<br />
plus ou mo<strong>in</strong>s con<strong>for</strong>me aux structures étatiques du Sénégal, avec des prix<br />
fixes et un bureau de commercialisation d’état pour faciliter l’exportation. En<br />
1964, l’<strong>in</strong>ter-governmental <strong>Africa</strong>n <strong>Groundnut</strong> Council (AGC), (le conseil<br />
<strong>in</strong>ter-gouvernemental africa<strong>in</strong> de l’arachide) a été créé à Lagos, comprenant le<br />
Nigeria, le Sénégal, la Gambie, le Mali, le Niger et le Soudan pour conseiller<br />
59
les pays producteurs sur les politiques de vente et pour adm<strong>in</strong>istrer des fonds<br />
de compensation au nom des Etats membres. Apparemment existant, le<br />
mandat de l’AGC décrit une entité régionale qui « assure des prix<br />
rémunérateurs à l’arachide et ses sous-produits sur le marché mondial ;<br />
favorise la consommation d’arachide, organise l’échange d’<strong>in</strong><strong>for</strong>mations<br />
technique et scientifique sur la recherche concernant la production, le<br />
market<strong>in</strong>g et les utilisations possibles de l’arachide et favorise la solidarité<br />
entre les Etats membres ».<br />
La production nigériane d’arachide a atte<strong>in</strong>t un pic de 1.6 million TM en<br />
1973, juste avant que le boum pétrolier ne trans<strong>for</strong>me <strong>in</strong>stantanément le<br />
Nigeria en un pays différent. À un moment critique du développement du<br />
secteur de l’arachide, le secteur agricole a été négligé au profit de la fièvre du<br />
pétrole, de ses revenus et du travail en ville pour les jeunes qui se seraient<br />
autrement convertis à l’agriculture.<br />
La nature non plus n’a pas aidé. La sécheresse de 1974/75 a été accusée<br />
d’être la cause d’une <strong>in</strong>festation d’aphides qui ont dissém<strong>in</strong>és le virus mortel<br />
de la rosette, une <strong>in</strong>festation qui a détruit environ 750.000 hectares de récolte<br />
en 1975 – une perte de 250 millions de dollars – avec d’autres épidémies en<br />
1983, 1885 et 1988 (Ntare, 2002). Plus d’une décennie après le pic de 1973,<br />
la production d’arachide avait chuté de plus de 50 %, à seulement 0.7 million<br />
TM.<br />
La libéralisation du secteur de l’arachide est survenue en 1986, avec<br />
l’abolition souda<strong>in</strong>e par le gouvernement du Nigeria des bureaux de<br />
commercialisation. Jason Lovelace (2002) critique vivement la transition,<br />
qu’il considère comme étant :<br />
60<br />
la pire des pratiques » en termes de contrôle de la transition... Ces<br />
changements ont été faits rapidement et avec peu de planification.<br />
Les rôles que le secteur privé devait jouer n’ont pas été clairement<br />
déf<strong>in</strong>is et les mesures n’ont pas été prises pour s’assurer que les<br />
pr<strong>in</strong>cipales fonctions effectuées par le bureau de commercialisation<br />
ont été adéquatement transférées au secteur privé. En outre,<br />
les prix adm<strong>in</strong>istrativement déterm<strong>in</strong>és étaient libéralisés<br />
<strong>in</strong>stantanément mais les prix <strong>in</strong>dicatifs n’ont pas été fournis<br />
(Lovelace 2002, avec référence à Shepherd et Farolfi 1999).<br />
Depuis sa libéralisation, la structure de vente d’arachide a été<br />
démantelée, le secteur privé l’a succédé. Les paysans n’ont plus l’assurance
d’un marché disponible et ils doivent lutter pour obtenir des <strong>in</strong><strong>for</strong>mations sur<br />
un marché pourtant fluide mais parfois volatile.<br />
Après plus d’une décennie de « somnolence », l’AGC a apparemment<br />
ressuscité l’année dernière et son siège social a été transféré de Lagos à Kano.<br />
Dans un discours lu par le M<strong>in</strong>istre du Commerce, le Vice-président du<br />
Nigeria, Alhaji Mustapha Bello, a déploré :<br />
la malheureuse somnolence de l’AGC, qui a été en grande partie<br />
dûe au manque de volonté politique de la part de ses membres.<br />
Ayant réalisé cette tendance malsa<strong>in</strong>e et pour la renverser, le<br />
Président du Nigeria a gracieusement donné son accord au<br />
Président actuel de l’AGC et au M<strong>in</strong>istre du Commerce pour tenir<br />
cette session… Je lance un appel aux Etats membres pour montrer<br />
plus d’engagement et j’encourage également l’AGC à suppléer aux<br />
ef<strong>for</strong>ts des Etats membres en développant des variétés de bonne<br />
qualité, résistantes aux maladies et à la sécheresse et à les distribuer<br />
aux Etats membres (Musa 2002).<br />
Ces paroles <strong>for</strong>tes reflètent le nouvel engagement du gouvernement<br />
nigérian pour raviver le secteur de l’arachide. L’ICRISAT rapporte que l’état<br />
de Kano a récemment importé de « grandes quantités » de la variété améliorée<br />
55-543 pour améliorer l’accès des producteurs aux semences (Ntare 2002).<br />
Ces <strong>in</strong>dications sont en effet prometteuses pour les producteurs d’arachide du<br />
Nigeria et du secteur de l’arachide en général.<br />
Les prix et marchés de l’arachide<br />
Les statistiques du gouvernement ne montrent aucune exportation d’arachide<br />
de 1998 à 2002, aucune exportation d’huile d’arachide non plus depuis lors<br />
(NESG 2003). Au milieu des années 80, d’importantes quantités d’arachide<br />
étaient importées de Gambie pour faire tourner les huileries. Cependant, le<br />
commerce régional a tendance à être très vaste. Malheureusement, les<br />
données commerciales précises ne sont pas disponibles et il est a<strong>in</strong>si très<br />
difficile de documenter et quantifier cet important marché régional.<br />
En dépit des figures officielles qui semblent <strong>in</strong>diquer que les<br />
exportations officielles nigérianes ont chuté, le commerce sous-régional<br />
prospère, en particulier entre le Nigeria et le Niger, avec des flux<br />
commerciaux dans les deux sens. Certa<strong>in</strong>es quantités d’arachides peuvent<br />
franchir la frontière plusieurs fois avant qu’elles ne soient traitées, car l’offre<br />
61
et la demande fluctuent contre le taux de change officiel très fluide entre le<br />
Naira (NGN) et le franc CFA (fCFA), pour plus de détails, voir ci-dessous.<br />
Les prix du marché changent de manière significative selon les marchés,<br />
comme <strong>in</strong>diqué par les <strong>in</strong><strong>for</strong>mations sur les prix obtenues de l’enquête IFDC-<br />
DAIMINA sur le terra<strong>in</strong>, et par le Système d’In<strong>for</strong>mation sur les Marchés<br />
Agricoles (SIMA) du m<strong>in</strong>istère de l’Agriculture du Niger (tableau 6).<br />
Tableau 6. Prix de l’arachide et produits dérivés, août 2003<br />
Produit :<br />
Etat :<br />
En Naira (NGN) Kano Bauchi Oyo<br />
Arachide coque par kg 100 95 130<br />
Arachide décortiquée par kg 80 100 80<br />
Huile d’arachide par L (0.9 kg) 195 160 150<br />
De : IFDC-DAIMINA enquête sur le terra<strong>in</strong><br />
Taux de change : US$1 = NGN 128<br />
Les prix du marché pour Zaria de janvier 2002 à décembre 2003 ont été<br />
obtenus à partir de l’IAR-Samaru (voir la page suivante) (tableau 7):<br />
Table 7. Prix de l’arachide au Nigeria : Zaria, Kaduna State, 2003-2004 [prix mensuels<br />
au Nigeria, en Naira (NGN)].<br />
Mois 2002 2003 « Moyenne »<br />
Janvier 50.6 - 51<br />
Février 65.26 39.25 53<br />
Mars 73.7 74.8 74<br />
Avril 82.5 77 80<br />
Mai 74.8 81.58 78<br />
Ju<strong>in</strong> 82.5 105.23 94<br />
Juillet 103.18 101 102<br />
Août 96.8 104.5 101<br />
Septembre 65.27 68.2 67<br />
Octobre 62.33 73.48 68<br />
Novembre 65.63 91.3 78<br />
Décembre 65.45 99 82<br />
« Moyenne » 74 83<br />
De : IAR<br />
Cependant, l’image devient plus complexe quand nous considérons le<br />
taux de change entre le Naira et le fCFA pendant la même période (voir le<br />
tableau à la page suivante).<br />
62
Alors que les prix de l’arachide au marché de Zaria semblent extrêmement<br />
élevés une fois convertis en fCFA aux taux de change officiels (qui sont très<br />
fluides) (tableau 8), il est très peu probable que les taux officiels soient utilisés<br />
pour faire des affaires <strong>in</strong><strong>for</strong>melles à travers la frontière, les implications d’un<br />
taux de change officiel fluide n’étant pas claires, car les données précises sur de<br />
telles transactions ne sont pas disponibles (Danguioua 2000).<br />
Tableau 8. Implications commerciales régionales : du Naira au Francs CFA.<br />
Taux de change officiel NGN fCFA<br />
Janvier<br />
(1 NGN = fCFA)<br />
6.64478 50.6 336<br />
Février 6.51265 65.26 425<br />
Mars 6.58105 73.7 485<br />
Avril 6.54534 82.5 540<br />
Mai 6.46675 74.8 484<br />
Ju<strong>in</strong> 6.08639 82.5 502<br />
Juillet 5.61795 103.18 580<br />
Août 5.31989 96.8 515<br />
Septembre 5.30174 65.27 346<br />
Octobre 5.36387 62.33 334<br />
Novembre 5.27338 65.63 346<br />
Décembre 5.07839 65.45 332<br />
Janvier 4.95308 - -<br />
Février 4.79496 39.25 188<br />
Mars 4.84814 74.8 363<br />
Avril 4.76005 77 367<br />
Mai 4.51303 81.58 368<br />
Ju<strong>in</strong> 4.26804 105.23 449<br />
Juillet 4.61345 101 466<br />
Août 4.67757 104.5 489<br />
Septembre 4.50353 68.2 307<br />
Octobre 4.32417 73.48 318<br />
Novembre 4.12404 91.3 377<br />
Décembre 3.88865 99 385<br />
* Taux de change officiels (en milieu de mois) de ‘www.oanda.com’<br />
Quelques déductions peuvent être faites, cependant, sur la base d’une<br />
analyse régionale des taux de change conduite par LARES, un programme sousrégional<br />
de collaboration entre le Bén<strong>in</strong>, le Niger, le Nigeria, le Cameroun et le<br />
Tchad. L’étude de LARES a exam<strong>in</strong>é les taux réels de change sur un certa<strong>in</strong><br />
nombre de marchés sous-régionaux, basés sur les données et l’analyse du DAEEFP<br />
(m<strong>in</strong>istère des F<strong>in</strong>ances et de l’économie) Niger, du DSCN du Cameroun, des<br />
universités nigérianes de Zaria et de Maïduguri et d’OBADA (Tchad).<br />
63
Bien que la moyenne sous-régionale ait été relativement proche des taux<br />
(nationaux) officiels – <strong>in</strong>diquant une chute de 4.5 % pendant le premier trimestre<br />
2003, de 4.9 fCFA en janvier à 4.6 fCFA en mars – des différences significatives<br />
ont été notées entre les différents marchés étudiés ; une chute de 1.5 % était<br />
évidente à Igolo, alors que le taux chutait de 8.8 à Konni et de 9.7 % à Gaya, une<br />
chute deux fois plus sévère selon les <strong>in</strong>dications des données officielles.<br />
La complexité de la situation sur le terra<strong>in</strong> – et le défi de documenter avec<br />
exactitude ces <strong>in</strong>dicateurs commerciaux régionaux d’analyse – est illustrée par<br />
le fait que pendant la même période, le Naira a augmenté de 0.7 % à Ndjamena,<br />
avec un niveau moyen de 5 fCFA à la vente et de 5.7 fCFA à l’achat.<br />
Dans la mesure où le gouvernement du Niger enregistre les données<br />
commerciales sur les produits dérivés de l’arachide aussi lo<strong>in</strong> qu’à Diffa<br />
(située sur l’autre rive du Lac Tchad à partir de Ndjamena), il y a certa<strong>in</strong>ement<br />
des implications de ce large éventail de taux de change sur le secteur de<br />
l’arachide le long de la frontière commune qui ne peuvent pas aisément être<br />
évaluées avec confiance et fiabilité.<br />
A<strong>in</strong>si, les prix du marché nigérian rapportés en fCFA par le SIMA au<br />
Niger pourraient probablement être plus précis et utiles pour la<br />
compréhension des courants commerciaux entre les deux pays, même si aux<br />
taux officiels, les chiffres de Zaria en CFA sont comparables à ceux donnés<br />
pour Sokoto.<br />
Figure 4. Evolution du taux FCFA/Naira dans le sous-espace Est Août-01 à<br />
mars-03<br />
Source: LARES L’Echo des Frontières: Regional Bullet<strong>in</strong> of cross - border trade monitor<strong>in</strong>g www.refer.org/<br />
ben<strong>in</strong>/eco/lares5.6 Statistiques des prix des marchés sous-régionaux : Mali, Niger et Nigeria<br />
64
5.6 Statistiques des prix de l’arachide au Mali<br />
Tableau 9. Prix des producteurs d’arachide décortiquée sur les marchés de la<br />
capitale régionale, octobre 1995 à septembre 1997.<br />
Marché :<br />
Année Mois Kayes Sikasso Ségou Mopti Gao Bamako<br />
1995 10 275 252 320 272 325<br />
1995 11 275 205 347 293 325 263<br />
1995 12 275 236 377 322 300 255<br />
1996 1 275 242 390 419 300 269<br />
1996 2 275 225 322 229 313 284<br />
1996 3 275 215 308 302 300 297<br />
1996 4 275 228 313 292 325 279<br />
1996 5 275 245 408 340 354 324<br />
1996 6 275 261 462 343 350 350<br />
1996 7 289 279 462 363 378 342<br />
1996 8 437 311 467 404 432 350<br />
1996 9 475 336 308 413 469 350<br />
1996 10 450 272 349 412 483 340<br />
1996 11 287 267 337 392 438 278<br />
1996 12 275 284 413 364 397 300<br />
1997 1 300 292 308 370 400 300<br />
1997 2 287 309 355 377 400 300<br />
1997 3 379 353 425 394 450 400<br />
1997 4 400 325 325 458 469 400<br />
1997 5 375 408 420 425 488 450<br />
1997 6 400 450 407 436 467 450<br />
1997 7 550 479 415 442 500 457<br />
1997 8 500 488 341 466 500 410<br />
1997 9 428<br />
« moyenne » 1995/96 : 321 255 376 344 361 309<br />
« moyenne » 1996/97 : 375 366 375 412 451 379<br />
Sources : DNSI, rapports mensuels sur le marché, collectés par l’IER<br />
65
Tableau 10. Prix nationaux du marché (au consommateur) 2003 (en CFA/kg).<br />
66<br />
Niamey Agadez Diffa Dosso<br />
Coque Décortiquée Coque Décortiquée Coque Décortiquée Coque Décortiquée<br />
Janvier 295 532 404 468 - 483 321 -<br />
Février 298 548 269 454 - 446 343 -<br />
Mars 282 675 215 411 - 438 346 -<br />
Avril 287 547 318 389 - 476 - -<br />
Mai 287 537 259 365 - 443 - -<br />
Ju<strong>in</strong> - - - - - - - -<br />
Juillet - - - - - - - -<br />
Août - - - - - - - -<br />
Septembre - - - - - - - -<br />
Octobre - - - - - - - -<br />
Novembre - - - - - - - -<br />
Décembre - - - - - - - -<br />
« moyenne » :290 568 293 417 - 457 337<br />
Tilabery Tahoua Maradi Z<strong>in</strong>der<br />
Coque Décortiquée Coque Décortiquée Coque Décortiquée Coque Décortiquée<br />
Mars 311 327 376 - 250 281 204 336<br />
Avril 294 322 376 - 283 291 214 296<br />
Mai 294 344 351 - 223 298 219 303<br />
Ju<strong>in</strong> 294 331 401 - 250 318 229 308<br />
Juillet 275 343 181 - 236 321 227 301<br />
Août - - - - - - - -<br />
Septembre - - - - - - - -<br />
Octobre - - - - - - - -<br />
Novembre - - - - - - - -<br />
Décembre - - - - - - - -<br />
« moyenne » :294 334 337 248 302 219 309
Tableau 11. Commerce régional de l’arachide au Niger (Documenté) 2001-2003.<br />
Dest<strong>in</strong>ation Poste<br />
2001-2002 (TM) 2002-2003 (TM)<br />
régionale frontière Importations Exportations Importations Exportations<br />
Adare 0.25 0 23.82 3<br />
Bén<strong>in</strong><br />
Malanville<br />
Burk<strong>in</strong>a Faso<br />
Gaya 0 0 6 0<br />
Fada / Ouaga<br />
Mali<br />
Torodi 0 0 0 0<br />
Gao<br />
Nigeria<br />
Ayorou 0 0 4.2 0<br />
Kano Magaria 9 0 32.5 0<br />
Kano Sassombroum 0 0 4.2 0<br />
Kats<strong>in</strong>a Dan Issa 0 191 129.5 0<br />
Kats<strong>in</strong>a Matamaye 0 0 36.15 4<br />
Sokoto Dioundjou 2.3 0 0 0<br />
Sokoto Konni 977.48 0 204.8 0<br />
Sokoto Bangui 1.7 0 0.5 10.8<br />
Maiduguri (et Tchad) Diffa 0 0 34 0<br />
Sous-totaux : 990.48 191 441.65 14.8<br />
Tableau 12. Prix du marché régional, 2003.<br />
NIGERIA<br />
BENIN BURKINA Illela Jibia Damssack<br />
Malanville Kantchari (Sokoto) (Kats<strong>in</strong>a) Mai adua (Maidugiri/Tchad) Zaria **<br />
CFA/Kg CFA/Kg CFA/Kg CFA/Kg CFA/Kg CFA/Kg CFA/Kg<br />
Janvier 189 130 405 271 285 185 -<br />
Février 220 137 444 192 277 198 188<br />
Mars 233 148 423 233 281 187 363<br />
Avril 245 150 416 308 320 182 367<br />
Mai 238 160 400 299 316 400 368<br />
Ju<strong>in</strong> 248 170 397 316 312 380 449<br />
Juillet 245 - 400 324 304 392 466<br />
Août - - - - - - 489<br />
Septembre - - - - - - 307<br />
Octobre - - - - - - 318<br />
Novembre - - - - - - 377<br />
Décembre - - - - - - 385<br />
Moyenne : 231 149 359 278 299 275 370<br />
Source : Système d’In<strong>for</strong>mation sur les Marchés Agricoles (SIMA) du NGN M<strong>in</strong>istère de l’Agriculture Aux taux de<br />
change officiels (www.oanda.com)<br />
**IAR / Samaru<br />
67
5.7 Observations supplémentaires<br />
S<strong>in</strong>gularisé de par son histoire de <strong>for</strong>te <strong>in</strong>tervention de l’état dans le secteur de<br />
l’arachide, du suivi du processus actuel (et par accroissement) de<br />
libéralisation, le Sénégal se dist<strong>in</strong>gue encore du Mali, du Niger et du Nigeria,<br />
bien que cela puisse ne pas durer encore longtemps.<br />
Déplorant les <strong>in</strong>certitudes du marché libre, les répondants au Mali ont<br />
proposé qu’un prix fixe pana-territorial de l’arachide bénéficierait aux<br />
producteurs – précisément le système dont le Sénégal tente de s’éloigner<br />
depuis la décennie passée – mais il semble que ce souhait va à contre-courant<br />
de l’histoire.<br />
Néanmo<strong>in</strong>s, étant donné le progrès du Sénégal, et l’<strong>in</strong>certitude<br />
historique de l’<strong>in</strong>tervention accrue de l’état dans le secteur de l’arachide, les<br />
quatre pays étudiés auront probablement plus en commun à l’avenir. Etant<br />
donné l’importance du commerce régional, il y a des raisons pour que des<br />
ef<strong>for</strong>ts soient entrepris au niveau des politiques pour encourager la facilitation<br />
de ce commerce - peut-être plus fiable (donc durable) au niveau du marché<br />
plus qu’au niveau <strong>in</strong>ternational.<br />
Les contra<strong>in</strong>tes à la production identifiées par des répondants au Mali<br />
soulignent la faible disponibilité de semences de qualité (améliorées) dans les<br />
secteurs de productions. Le manque d’accès au crédit à tous les niveaux a<br />
également tendance à décourager la production d’arachide.<br />
Selon l’IER, les producteurs identifient le cycle annuel des prix comme<br />
une contra<strong>in</strong>te et préféreraient avoir un prix annuel fixe, comme au Sénégal.<br />
D’autres contra<strong>in</strong>tes identifiées comprennent le mauvais état des routes des<br />
secteurs de production vers les centres de consommation et d’exportation, et<br />
les distorsions du marché causées par la rareté des acheteurs pendant certa<strong>in</strong>es<br />
périodes de l’année.<br />
Parmi les grossistes étudiés, les contra<strong>in</strong>tes majeures identifiées étaient le<br />
manque d’accès au capital, et la mauvaise condition des <strong>in</strong>frastructures<br />
routières, en particulier pendant la saison des pluies.<br />
Le profil du secteur de l’arachide au Niger est en grande partie con<strong>for</strong>me<br />
aux données du Mali en termes de structure du marché, d’écart des prix par<br />
produit et de fluctuations saisonnières des prix, bien que les fluctuations<br />
constatées soient généralement plus faibles qu’au Mali.<br />
Les paysans et les commerçants ont exprimé peu de préférence ou de<br />
connaissance des variétés améliorées, à l’exception de l’huile OLGA<br />
(préférence pour des variétés à haute teneur d’huile de l’ICRISAT), un paysan<br />
68
de Maradi préfère une variété locale plus petite (connue en Hausa sous le nom<br />
de Guia Mai Go Ga Wa), et un commerçant de Maradi préfère une autre<br />
variété locale plus petite demandée par ses acheteurs, connus en Hausa sous le<br />
nom de Kam Kodan Kwaya.<br />
Tandis que certa<strong>in</strong>s paysans <strong>in</strong>terrogés exprimaient leur réticence à<br />
stocker leur arachide, préférant si possible la vendre rapidement en dépit des<br />
bas prix prédom<strong>in</strong>ants pendant la récolte, par contre d’autres paysans (et<br />
commerçants) par contre ont mentionné que l’accès à de bonnes structures de<br />
stockage (sèches) demeurait une contra<strong>in</strong>te.<br />
Les paysans et les commerçants ont identifié comme contra<strong>in</strong>tes<br />
majeures à leurs activités de vente l’absence de comptabilité et de<br />
qualifications de base en affaires a<strong>in</strong>si que le manque d’accès à l’<strong>in</strong><strong>for</strong>mation<br />
sur le marché. Ils ont identifié l’accès limité au crédit comme étant une autre<br />
contra<strong>in</strong>te.<br />
En raison du taux de change <strong>for</strong>tement fluide et variable du Naira face au<br />
franc CFA, il est difficile de tirer des conclusions concernant le flux réel de<br />
commerce entre le Niger et le Nigeria.<br />
Seuls une surveillance accrue et précise et un échange de prix du marché<br />
et de l’<strong>in</strong><strong>for</strong>mation sur le taux de change <strong>in</strong><strong>for</strong>mel permettront d’évaluer<br />
l’étendue et le potentiel du marché régional.<br />
69
70<br />
6.0 Historique et méthodologie<br />
L’étude a commencé par la collecte d’<strong>in</strong><strong>for</strong>mation générale disponible sur les<br />
marchés de l’arachide dans chacun des quatre pays ciblés, a<strong>in</strong>si que les<br />
marchés <strong>in</strong>ternationaux. Des données de production et de commerce ont été<br />
collectées de FAOSTAT. Les données sur le marché de l’arachide de<br />
l’ICRISAT ont été rassemblées au bureau régional de Bamako auprès de Dr<br />
Bonny Ntare, et au bureau de l’ICRISAT pour le Niger auprès de Dr Jupiter<br />
Ndjeunga.<br />
D’autres contacts et idées ont été recueillis au bureau régional de<br />
l’ICRISAT à Nairobi auprès de Dr Said Silim et Dr Richard Jones, qui plus tôt<br />
(à Bamako) avaient fourni une liste de questions appropriées pour<br />
considération pendant l’étude. Les contacts commerciaux et autres<br />
<strong>in</strong><strong>for</strong>mations ont été gracieusement fournis par Dr Juan Estrada de ICRISAT<br />
Malawi. Dr Ala<strong>in</strong> Mayeux du CIRAD au Sénégal a également fourni<br />
l’historique sur l’étude du CIRAD sur le marché de l’arachide au Sénégal.<br />
Des visites prélim<strong>in</strong>aires sur le terra<strong>in</strong> ont été faites au Niger. Un <strong>for</strong>mat<br />
semi-structuré et des questionnaires ont été développés pour une étude du<br />
Niger, mis en application en juillet et août à Niamey, Dosso, Maradi et Z<strong>in</strong>der.<br />
Les résultats de cette étude sont entra<strong>in</strong> d’être compilés, pour servir de base<br />
aux travaux avancés au Mali, au Sénégal et au Nigeria.<br />
Un questionnaire de diagnostic a été envoyé aux SNRA partenaires et<br />
autres acteurs nationaux dans chacun des pays ciblés, en vue de fournir des<br />
directives sur les données commerciales et de marché pour appuyer l’étude de<br />
marché par pays, au Sénégal, Mali et au Nigeria - et, dans le cas du Niger,<br />
fournir la triangulation des données sur le marché La seule réponse au<br />
questionnaire reçue des SNRA partenaires et autres acteurs concernés a été<br />
celle de IAR-Samaru, Nigeria.<br />
Une liste de contacts commerciaux en Europe a été compilée, et<br />
hiérarchisée selon les statistiques commerciales récentes. Des contacts ont été<br />
pris avec c<strong>in</strong>q sociétés commerciales européennes clés qui font l’achat et le<br />
commerce de l’arachide importée. Trois de ces sociétés ont été <strong>in</strong>terviewées<br />
aux Pays-Bas et d’autres entrevues ont été programmées pour le mois de<br />
septembre au Royaume-Uni.
Afrique de l’Ouest<br />
Niger<br />
Une étude de marché au Niger a été mise en place en juillet et août à Niamey,<br />
Dosso, Maradi et Z<strong>in</strong>der, comprenant des entrevues structurées et semistructurées<br />
avec des paysans, des commerçants et autres acteurs du secteur<br />
privé, ONG et structures gouvernementales. Les résultats de l’étude sont en<br />
cours de compilation. Un questionnaire a été envoyé au partenaire national<br />
SNRA, l’INRAN, en vue de la triangulation de l’étude de cas du marché du<br />
pays.<br />
Sénégal<br />
Un questionnaire de diagnostic a été envoyé à notre partenaire national SNRA,<br />
à l’ISRA/CNRA, à UNIS et au CIRAD, en vue de fournir des directives sur les<br />
données commerciales et de marché pour appuyer l’étude de marché par pays,<br />
le cas du Sénégal. Une étude très utile et applicable au secteur de l’arachide au<br />
Sénégal, avec une analyse approfondie des <strong>in</strong><strong>for</strong>mations sur les prix, a été<br />
récemment publiée sous la <strong>for</strong>me de thèse de Ph.D. par Dr James Gray de<br />
l’université du Vermont, Etats-Unis (Gray 2002). L’auteur a été contacté pour<br />
mettre à jour les résultats de l’étude. Des entrevues ont été conduites avec Dr<br />
Oumar Chiekh Ba, Directeur du bureau de l’ISRA (BAME), et Dr Ala<strong>in</strong><br />
Mayeux du CIRAD, qui a déjà conduit une étude de recherche approfondie<br />
sur le marché européen de l’arachide de confiserie (ARB) d’orig<strong>in</strong>e<br />
sénégalaise. Une visite de suivi du Bass<strong>in</strong> arachidier (pendant la récolte) et à<br />
Dakar a été faite en novembre-décembre 2003.<br />
Mali<br />
Un questionnaire de diagnostic a été envoyé à notre partenaire national du<br />
SNRA, IER/CRRA en vue de fournir des directives sur les données<br />
commerciales et de marché pour appuyer l’étude de marché par pays, le cas<br />
du Mali. Les documentations de référence sur le secteur de l’arachide au Mali<br />
y compris une étude du pays faite en 1998 par le M<strong>in</strong>istère de l’Agriculture, et<br />
une étude de suivi du secteur de l’arachide au Mali par O Kodio de l’IER. Cet<br />
appui de collaboration de l’étude du marché par l’IER a été très utile aux<br />
71
objectifs de l’étude. Une visite de suivi a été effectuée au Mali en novembre<br />
2003.<br />
Nigeria<br />
Le progrès de l’étude du marché au Nigeria a été compromis à cause de la<br />
démission <strong>in</strong>opportune de Dr Joshoua de Premier Seed Company, qui était le<br />
mieux placé pour <strong>in</strong>struire l’étude concernant la production et le commerce<br />
de l’arachide au Nigeria. Un profil du pays pour le marché nigérian d’arachide<br />
a été par la suite développé avec l’appui collaboratif de IAR-Samaru, pour le<br />
marché de Zaria. L’<strong>in</strong><strong>for</strong>mation du marché comprenant les résultats f<strong>in</strong>anciers<br />
et les cycles régionaux des prix de l’arachide pour plusieurs autres marchés<br />
nigérians a été obtenue au cours de l’étude de marché du Niger.<br />
Europe<br />
Les Pays-Bas et le Royaume-Uni ont été identifiés comme les pays les plus<br />
significatifs dans le commerce européen d’arachide, car ils sont de lo<strong>in</strong> les plus<br />
grands importateurs – représentant respectivement 35 % et 15 %, des<br />
importations d’arachide décortiquées vers les 27 pays européens en 2001<br />
(respectivement 225.265 et 101.895 TM sur un total de 638.699 TM<br />
importées).<br />
Les Pays-Bas sont également de lo<strong>in</strong> le plus grand exportateur en Europe,<br />
représentant plus de 76 % des exportations européennes d’arachide<br />
décortiquées en 2001 (43.303 sur 56.951 TM exportées). Comme cela est le<br />
cas pour beaucoup de produits, le port de Rotterdam est l’épicentre des<br />
échanges d’arachide en l’Europe.<br />
Des entrevues ont été conduites avec les représentants de commerce de<br />
deux des plus grandes sociétés européennes importatrices d’arachide, M.<br />
Menno van der Pijll de Aldebaran Commodities B.V., et M. Anton Hendriks<br />
de Bohemia Nut Company B.V, toutes deux basées à Rotterdam. Chacune de<br />
ces compagnies a un chiffre d’affaires annuel de 25-30.000 TM d’arachide par an.<br />
Une <strong>in</strong>terview a été également conduite avec M. Paulo Bello, Directeur<br />
des achats de Nut Company (Arnhem, Pays-Bas), identifié comme le plus<br />
grand utilisateur européen d’arachide, avec un chiffre d’affaires annuel de plus<br />
de 100.000 TM. Selon un <strong>in</strong><strong>for</strong>mateur, Nut Company rachète les entreprises<br />
européennes d’arachide depuis la dernière décennie, dans une tendance<br />
européenne du marché de l’arachide décrite dans les détails à la section 4.2.<br />
72
Ces entrevues <strong>in</strong>itiales étaient très <strong>in</strong>structives, faisant la lumière sur le<br />
climat actuel du commerce et en donnant diverses perspectives quant à la<br />
façon dont les producteurs ouest africa<strong>in</strong>s pourraient mieux se situer pour<br />
négocier un profil amélioré dans le commerce <strong>in</strong>ternational d’arachide.<br />
Des contacts ont été entrepris, et des entrevues ont été demandées avec<br />
de grandes sociétés britanniques d’importation comme Barrow Lane et<br />
Ballard. Monsieur Richard Kettlewell, un consultant de Fair Trade company<br />
Tw<strong>in</strong> Trad<strong>in</strong>g, et un courtier d’arachide ayant de longues années d’expérience<br />
de l’Afrique de l’Ouest, ont gracieusement consenti à un entretien long et très<br />
détaillé en septembre 2003, ce qui a arrondi les contours des marchés<br />
européens et mondiaux. Monsieur Kettlewell a en outre donné des suggestions<br />
utiles et très <strong>in</strong><strong>for</strong>matives quant aux stratégies potentielles du marché pour les<br />
producteurs ouest africa<strong>in</strong>s d’arachide.<br />
73
Appendices<br />
75
Annexe 1 : Analyse statistique du commerce mondial d’arachide<br />
Tableau 13. Huit meilleurs pays exportateurs d’arachide coque, 1992 - 2001.<br />
Année<br />
Arachide coque Moyenne<br />
Exportations - Qté (TM) 1992 1993 1994 1995 1996 1997 1998 1999 2000 2001 annuelle<br />
Monde 127,675 153,262 163,101 141,432 128,962 154,455 150,681 170,390 192,726 231,447 161,413<br />
Ch<strong>in</strong>e 33,340 38,598 67,744 37,021 50,485 46,371 66,284 54,625 69,091 85,598 54,916<br />
Etats-Unis<br />
d’Amérique 63,751 56,394 33,468 44,565 29,885 41,865 28,194 22,743 24,295 14,065 35,923<br />
Gambie - - - 45 - - - 17,578 25,818 25,818 17,315<br />
Inde 257 6,439 2,226 3,071 4,227 8,830 6,386 14,504 20,333 44,657 11,093<br />
Israël 7,853 11,111 10,933 9,861 9,681 8,493 9,951 8,314 7,448 8,000 9,165<br />
Afrique du Sud 97 200 5,111 7,774 7,374 7,666 6,757 8,592 10,666 17,189 7,143<br />
Pays-Bas 5,514 17,053 11,856 7,211 4,150 3,061 1,430 1,506 1,255 458 5,349<br />
Brésil 3,618 3,331 3,553 2,569 1,180 241 882 2,619 645 1,546 2,018<br />
Données : FAOSTAT<br />
77
Tableau 14. Douze meilleurs pays exportateurs d’arachide décortiquée, 1992 - 2001<br />
78<br />
Année<br />
Moyenne<br />
1992 1993 1994 1995 1996 1997 1998 1999 2000 2001 annuelle<br />
Monde 957,023 1,041,670 1,164,072 1,282,840 1,198,298 1,122,828 1,019,945 1,029,636 1,167,786 1,078,148 1,106,225<br />
Ch<strong>in</strong>e 270,266 277,308 413,191 351,983 300,583 125,103 148,577 286,419 330,881 407,856 291,217<br />
Etats-Unis<br />
d’Amérique 291,466 191,760 140,226 246,815 180,817 197,806 155,497 160,928 211,604 125,670 190,259<br />
Argent<strong>in</strong>e 134,479 119,314 104,432 165,097 197,967 179,224 300,148 208,910 212,402 159,717 178,169<br />
Inde 4,086 86,843 48,897 115,837 144,399 236,300 51,877 143,605 116,732 68,156 101,673<br />
Vietnam 62,824 105,000 119,200 115,000 127,000 86,428 87,000 55,500 76,200 78,163 91,232<br />
Pays-Bas 57,486 100,879 146,742 108,820 81,499 90,739 70,813 54,660 52,870 43,303 80,781<br />
Afrique du Sud 15,719 20,900 44,493 19,073 27,774 43,657 21,227 13,536 17,873 23,603 24,786<br />
Nicaragua 2,789 5,403 13,532 19,974 19,034 22,088 15,198 12,801 44,797 41,410 19,703<br />
Gambie 9,263 20,000 17,600 28,414 23,000 28,414 28,400 0 0 24,000 17,909<br />
S<strong>in</strong>gapour 24,301 22,637 26,857 19,939 19,068 13,759 13,685 10,672 4,496 2,935 15,835<br />
Ch<strong>in</strong>e,<br />
Hong Kong<br />
SAR 24,232 23,808 12,075 7,973 1,884 2,492 4,692 9,790 696 154 8,780<br />
France 12,496 9,960 12,702 18,755 8,422 4,448 2,205 1,881 1,543 2,845 7,526<br />
Sénégal 11,912 2,808 6,549 6,617 20,000 5,723 5,290 7,415 2,794 2,786 7,189<br />
Données : FAOSTAT
Tableau 15. Importations européennes d’arachide coque – Profil sur une décennie (1992-2001)<br />
Année<br />
1992 1993 1994 1995 1996 1997 1998 1999 2000 2001<br />
Europe 97,374 99,225 118,262 142,558 98,013 107,256 107,919 94,174 103,905 107,565<br />
Al Albanie - - - - 146 51 201 66 10 1<br />
Autriche 2,322 2,453 2,437 936 1,901 930 2,390 2,249 1,695 1,290<br />
Bíelorussie - - - - - - 62 48 292 253<br />
Belgique-Luxembourg 764 1,550 1,112 38,949 894 1,775 3,261 3,861 - -<br />
Belgique - - - - - - - - 2,906 3,482<br />
Bulgarie 7 248 31 290 35 372 536 - - -<br />
Croatie 4 48 352 452 276 256 307 269 352 460<br />
République Tchèque 1,476 1,186 2,264 1,799 1,550 981 833 1,319 1,232<br />
Danemark 58 14 110 99 259 519 159 197 510 448<br />
Estonie - 18 112 40 164 77 265 281 295 135<br />
F<strong>in</strong>lande 530 5 64 1 53 34 91 397 70 37<br />
France 6,154 5,674 5,493 4,782 3,303 5,019 4,302 4,888 4,941 7,738<br />
Allemagne 21,707 20,425 20,447 13,433 14,321 19,265 18,560 16,605 14,946 10,614<br />
Grèce 585 835 1,586 1,327 1,377 1,806 1,360 1,125 1,021 1,242<br />
Hongrie 2,133 2,752 3,399 4,373 2,711 2,432 2,259 2,018 2,182 1,936<br />
Iceland 5 3 2 1 3 - 1 1 0 -<br />
Irelande 244 209 86 157 31 123 87 124 78 183<br />
Italie 15,526 15,662 19,999 22,336 18,331 19,608 20,814 16,959 20,027 21,094<br />
Lettonie - 2 6 171 24 205 118 251 238 114<br />
Lituanie - - 141 78 120 107 30 58 9 69<br />
Luxembourg - - - - - - - 369 2,779 2,215<br />
Suite<br />
79
Suite de la page précédente<br />
80<br />
Année<br />
1992 1993 1994 1995 1996 1997 1998 1999 2000 2001<br />
EurMacédo<strong>in</strong>e,<br />
Ex République de<br />
Yougoslavie - 40 35 467 42 - - 339 720 2,000<br />
Malte 364 238 267 486 262 230 287 - 201 324<br />
Moldavie, République de - - 55 1 - 90 78 - 0 42<br />
Pays-Bas 13,849 12,361 17,392 13,278 12,066 8,696 10,940 12,346 8,597 6,979<br />
Norvège 70 64 248 236 163 265 221 146 128 278<br />
Polande 5,115 5,876 4,806 5,893 6,468 7,013 5,092 3,860 3,993 4,466<br />
Portugal 6,492 4,827 6,137 3,318 4,476 4,541 5,444 2,621 4,066 4,586<br />
Roumanie 174 429 712 4,436 877 582 1,804 459 839 1,733<br />
Fédération de Russie 368 523 - - 2,405 4,275 1,653 1,757 792 2,340<br />
Sierbie et Monténégro 164 - - - 107 98 105 105 49 34<br />
Slovaquie - 792 607 751 1,321 1,239 1,548 1,508 2,361 2,361<br />
Slovénie 191 418 140 103 132 95 110 5 1,892 125<br />
Espagne 13,558 14,089 20,604 15,752 15,856 16,975 15,605 11,935 14,338 13,102<br />
Suède 43 41 48 69 87 73 160 131 86 78<br />
Suisse 4,029 3,467 4,339 3,767 2,702 3,696 2,818 3,487 2,372 2,213<br />
Ukra<strong>in</strong>e - - 100 46 86 98 103 98 546 1,759<br />
Royaume-Uni 2,918 4,686 6,209 4,266 5,215 5,161 6,167 4,778 9,255 12,602<br />
Données : FAOSTAT
Tableau 16. Importations européennes d’arachide décortiquée – Profil sur une décennie (1992-2001)<br />
Année<br />
1992 1993 1994 1995 1996 1997 1998 1999 2000 2001<br />
Europe 503,662 472,919 601,371 570,196 583,575 614,204 623,635 534,868 576,745 638,699<br />
Albanie - - - - 145 169 199 264 202 1<br />
Autriche 3,537 3,222 3,309 1,251 1,034 910 858 774 1,015 803<br />
Bielorussie - - - - - - 938 1,125 2,000 1,542<br />
Belgique (2000-2001) - - - - - - - - 4,848 6,148<br />
Belgique-Luxembourg 3,551 3,402 4,082 8,957 5,017 5,052 6,105 4,782 - -<br />
(-1999)<br />
Bosnie et Herzégov<strong>in</strong>e 65 90 35 40 230 100 155 320 80 150<br />
Bulgarie 22 1,118 225 1,366 494 1,653 4,760 3,000 1,800 1,800<br />
Croatie 711 595 638 711 750 293 462 1,123 1,140 914<br />
Tchécoslovaquie 4,763 - - - - - - - - -<br />
République Tchèque - 3,656 3,070 2,739 14,906 16,763 14,397 9,500 10,952 10,528<br />
Danemark 1,734 2,937 2,746 2,939 3,042 3,304 3,314 1,514 1,908 3,875<br />
Estonie - 33 42 47 220 233 200 304 1,172 579<br />
F<strong>in</strong>lande 1,350 1,635 2,495 1,784 2,035 1,814 2,315 2,066 2,415 2,004<br />
France 67,889 27,989 52,910 66,097 50,000 32,714 53,013 25,466 25,702 22,691<br />
Allemagne 81,766 85,826 77,851 64,281 67,581 83,205 78,827 80,373 92,616 57,803<br />
Grèce 8,643 8,635 10,803 13,885 14,633 13,837 13,935 12,565 12,936 12,602<br />
Hongrie 2,582 1,544 1,896 2,336 2,729 3,718 4,607 4,912 5,645 5,509<br />
Iceland 8 7 13 7 7 5 6 5 5 5<br />
Irelande 356 680 641 365 405 416 390 478 177 592<br />
Italie 7,026 7,655 9,122 11,581 9,660 14,144 13,517 14,438 16,087 16,183<br />
Latvia - 80 405 386 592 882 1,483 1,312 1,374 1,257<br />
Lithuanie - - 682 1,272 2,091 2,759 2,946 2,010 777 2,538<br />
Suite<br />
81
Suite de la page précédente<br />
82<br />
Année<br />
1992 1993 1994 1995 1996 1997 1998 1999 2000 2001<br />
Luxembourg - - 1,735 - - - - - 3 1<br />
Macédo<strong>in</strong>e,<br />
Ex République<br />
de Yougoslavie 896 1,541 286 1,658 1,627 1,272 1,272 4,173 3,936 3,485<br />
Malte 285 293 45 255 285 344 324 152 272 246<br />
République de Moldavie - - - 260 269 279 248 258 325 543<br />
Pays-Bas 165,094 180,771 251,263 212,600 194,718 203,333 182,935 140,549 161,296 225,265<br />
Norvège 4,335 3,912 3,620 3,747 3,410 3,608 3,523 5,677 3,533 3,824<br />
Polande 3,901 4,538 12,858 13,034 14,210 18,031 19,384 17,684 18,330 19,797<br />
Portugal 2,073 1,827 1,932 1,593 1,868 1,713 1,553 1,302 1,569 1,535<br />
Roumanie 828 604 939 1,800 4,258 2,583 3,769 2,992 5,313 4,268<br />
Fédération de Russie 238 1,365 34,074 28,222 33,692 44,636 37,608 46,610 56,479 78,872<br />
Serbie et Monténégro 1,461 315 1,826 2,350 2,967 790 1,803 1,200<br />
Slovaquie 972 1,859 2,115 2,564 2,148 2,514 2,595 2,726 2,726<br />
Slovénie 33 14 46 61 126 157 141 270 2,458 80<br />
Espagne 14,069 15,449 15,869 19,003 31,301 20,641 21,454 19,212 21,924 25,901<br />
Suède 3,026 2,456 2,893 2,767 2,481 1,956 2,586 2,241 1,949 2,466<br />
Suisse 7,915 357 470 526 750 652 1,105 747 1,427 935<br />
Ukra<strong>in</strong>e - 900 1,610 3,700 6,400 10,000 15,550 10,200 14,968 18,136<br />
Royaume-Uni 115,505 108,816 100,907 98,496 108,218 118,530 124,275 113,085 95,582 101,895<br />
Données: FAOSTAT
Tableau 17. Exportations européennes d’arachide décortiquée – Profil sur une décennie (1992-2001)<br />
Année<br />
1992 1993 1994 1995 1996 1997 1998 1999 2000 2001<br />
Europe 80,332 118,720 175,395 144,960 102,193 105,340 86,569 68,687 62,662 56,951<br />
Autriche 519 365 139 65 58 55 45 22 53 107<br />
Bielorussie - - - - - - 7 95 19 22<br />
Belgique - - - - - - - - 488 2,350<br />
Belgique-Luxembourg 73 129 462 4,041 1,927 369 1,191 653 - -<br />
Bulgarie - 226 388 154 1,728 134 83 80 40 40<br />
Croatie 61 1 7 27 10 21 14 10 5 6<br />
République Tchèque - 61 141 59 46 470 325 384 752 461<br />
Danemark 32 86 80 62 119 71 51 94 46 39<br />
Estonie - - - - - 74 96 - 191 42<br />
F<strong>in</strong>lande 54 15 22 16 8 26 87 57 74 58<br />
France 12,496 9,960 12,702 18,755 8,422 4,448 2,205 1,881 1,543 2,845<br />
Allemagne 5,078 3,777 8,515 8,877 4,253 4,073 4,701 4,707 2,493 2,154<br />
Grèce 48 146 110 1,281 1,437 1,238 2,343 3,206 1,500 1,675<br />
Hongrie 785 321 1 23 - - - 81 - -<br />
Irelande 9 - 5 2 - 1 9 - - -<br />
Italie 581 177 764 105 77 104 381 481 6 822<br />
Lettonie - - 3 - - 30 62 134 441 47<br />
Lithuanie - - 163 307 31 164 98 106 179 250<br />
Macédo<strong>in</strong>e,<br />
Ex République de<br />
Yougoslavie 7 - - 13 12 - - 18 104 4<br />
Pays-Bas 57,486 100,879 146,742 108,820 81,499 90,739 70,813 54,660 35 43,303<br />
Suite<br />
83
Suite de la page précédente<br />
84<br />
Année<br />
1992 1993 1994 1995 1996 1997 1998 1999 2000 2001<br />
Eur<br />
Norvège 79 11 11 17 40 130 43 47 52,870 69<br />
Polande 235 48 131 291 33 175 173 175 157 340<br />
Portugal - - - 1 - 1 19 1 211 34<br />
Roumanie - 4 - - 28 - 3 - 22 22<br />
Fédération de Russie - - 751 397 513 140 128 12 211 39<br />
Serbie et Monténégro - - - - 50 23 5 20 - -<br />
Slovaquie - 45 46 28 24 2 49 254 23 -<br />
Slovénie - 12 - 1 24 59 59 - 48 -<br />
Espagne 24 71 28 129 37 93 950 150 291 1,882<br />
Suède 186 11 43 33 10 34 78 96 202 18<br />
Suisse - - - - 21 6 99 - 70 6<br />
Royaume-Uni 2,579 2,375 4,141 1,456 1,786 2,660 2,452 1,263 587 316<br />
Données : FAOSTAT
Tableau 18. Exportations africa<strong>in</strong>es d’arachide coque, 1992-2001<br />
Année<br />
1992 1993 1994 1995 1996 1997 1998 1999 2000 2001<br />
Afrique 3,965 7,673 12,054 13,357 10,533 24,772 19,666 33,217 46,957 52,579<br />
Botswana - 22 20 - - - - - - 1<br />
Burk<strong>in</strong>a Faso - - - 2 8 41 470 241 1,046 400<br />
Cameroun - 19 16 70 45 1 4 4 1 4<br />
Côte d’Ivoire - - - 10 3 1 11 54 309 309<br />
Egypte 1,431 5,315 3,106 3,440 2,469 3,994 5,616 1,499 2,308 2,725<br />
Gambie - - - 45 - - - 17,578 25,818 25,818<br />
Ghana - - - - 104 46 6 6 968 149<br />
Kenya 5 317 1 5 45 8 8<br />
Jamahiriya Arabe Libyenne - - - - - - 1,143 1,122 1,286 1,286<br />
Madagascar 25 64 22 156 90 137 103 92 162 94<br />
Malawi - - - 1,000 - - - - - -<br />
Mauritanie 3 - - - - - - - - -<br />
Maurice 1 - - - - - - - - 14<br />
Maroc - 115 - - - - - - - -<br />
Namibie - - - - - - - - 1 -<br />
Niger - - 12 234 366 537 215 1,010 546 357<br />
Nigeria - - - 20 10 10 31 31 44 44<br />
Sénégal 1 3 - - - 56 - 6 - 159<br />
Afrique du Sud 97 200 5,111 7,774 7,374 7,666 6,757 8,592 10,666 17,189<br />
Soudan 500 430 460 - - 11,936 4,129 1,201 2,452 2,452<br />
Souaziland - - - - - 250 45 85 153 108<br />
République Unie de Tanzanie1,000 - - - - 66 1,025 527 1,108 1,454<br />
Togo - - 12 - - - - 5 - -<br />
Tunisie - 343 2,907 342 - - - - - -<br />
Ouganda 84 625 191 139 30 1 36 167 5 -<br />
Zambie 756 50 - - - 30 20 989 77 9<br />
Zimbabwe 62 170 196 121 34 - 10 9 - -<br />
85<br />
Données : FAOSTAT
Tableau 19. Exportations africa<strong>in</strong>es d’arachide décortiquée, 1992-2001<br />
Année<br />
1992 1993 1994 1995 1996 1997 1998 1999 2000 2001<br />
86<br />
Afrique 56,549 83,729 101,432 84,455 89,667 129,825 138,603 56,772 73,281 102,015<br />
Botswana 2 - - 15 5 67 21 21 2 1<br />
Burk<strong>in</strong>a Faso 500 400 400 327 400 400 187 978 813 813<br />
Burundi - - - - - - - - 5 5<br />
Cameroun 200 201 31 128 128 431 157 254 1,398 418<br />
République Centrafrica<strong>in</strong>e - - 781 879 191 500 500 500 500 500<br />
Côte d’Ivoire - - - 773 473 3 5 703 837 837<br />
Egypte 2,303 7,044 4,229 6,278 3,088 7,149 9,196 2,917 1,076 1,301<br />
Ethiopie - - - 70 - 80 69 4 30 35<br />
Gambie 9,263 20,000 17,600 28,414 23,000 28,414 28,400 - - 24,000<br />
Ghana - - - - 96 - - 37 230 28<br />
Gu<strong>in</strong>ée-Bissau 436 - 400 60 420 420 430 430 430 430<br />
Kenya 116 232 246 101 68 26 250 444 157 157<br />
Jamahiriya Arabe Libyenne 1,200 7,600 4,400 5,220 4,500 8,200 8,200 8,200 21,300 21,300<br />
Madagascar 50 78 147 128 86 503 386 32 377 98<br />
Malawi - - 1,000 111 970 2,628 4,335 1,300 210 825<br />
Mali 5,000 6,300 7,800 7,000 3,200 4,600 3,200 3,800 3,000 3,000<br />
Maurice 2 - - - - - 13 11 10 24<br />
Maroc 35 160 - - - 18 - - - -<br />
Mozambique 300 300 300 700 300 300 310 300 300 300<br />
Namibie - - - - - - - - - 37<br />
Niger - - - 96 1,248 2,131 4,131 785 1,023 251<br />
Nigeria 100 140 250 201 367 1,074 5,142 96 - -<br />
Sénégal 11,912 2,808 6,549 6,617 20,000 5,723 5,290 7,415 2,794 2,786<br />
Suite
Suite de la page précédente<br />
Année<br />
1992 1993 1994 1995 1996 1997 1998 1999 2000 2001<br />
Afrique du Sud 15,719 20,900 44,493 19,073 27,774 43,657 21,227 13,536 17,873 23,603<br />
Soudan 2,650 14,432 6,213 4,642 2,176 14,782 21,224 5,000 10,028 17,250<br />
Souaziland - - - - - 3,056 10,667 7,443 6,854 2,490<br />
République Unie de<br />
Tanzanie 6,000 - - 170 510 695 231 848 367 973<br />
Togo - - 6 62 45 44 44 23 196 221<br />
Tunisie - 115 - 118 - - - - 2 -<br />
Ouganda - - 224 252 5 11 47 150 10 -<br />
Zambie 28 50 45 57 8 337 460 113 185 332<br />
Zimbabwe 733 2,969 6,318 2,963 609 4,576 14,481 1,433 3,273 -<br />
Données : FAOSTAT<br />
87
Annexe 2 : Liste de prix des échantillons, Aldebaran Commodities, Rotterdam<br />
88<br />
Tableau 20. En vente le 17 à partir de décembre 2002 (suivant disponibilité et confirmation f<strong>in</strong>ale)<br />
Quantité Prix en $EU Condition<br />
Marchandises disponibles sur la base FOT de Rotterdam<br />
ARGENTINE<br />
1 Argent<strong>in</strong>e Runner count 40/50, récolte de 2002 36.000 kgs U$ 800,00 Fot Rotterdam<br />
2 Argent<strong>in</strong>e Runner count 40/50, récolte de 2002, blanchie 25.000 kgs U$ 960,00 Fot Rotterdam<br />
4 Argent<strong>in</strong>e Runner count 38/42, récolte de 2002, blanchie 18.000 kgs U$ 960,00 Fot Rotterdam<br />
BRESIL<br />
4 Brasilian Runner count 40/50, récolte de 2002 36.000 kgs U$ 780,00 Fot Rotterdam<br />
5 Brasilian Runner count 40/50, récolte de 2002, blanchie 18.000 kgs U$ 940,00 Fot Rotterdam<br />
6 Brasilian Runner count 38/42, récolte de 2002 36.000 kgs U$ 800,00 Fot Rotterdam<br />
7 Brasilian Runner count 38/42, récolte de 2002, blanchie 36.000 kgs U$ 960,00 Fot Rotterdam<br />
CHINE<br />
8 Ch<strong>in</strong>ese Virg<strong>in</strong>ia Shandong count 24/28, récolte de 2002 18.000 kgs U$ 800,00 Fot Rotterdam<br />
9 Ch<strong>in</strong>ese Virg<strong>in</strong>ia Shandong count 28/32, récolte de 2002 18.000 kgs U$ 780,00 Fot Rotterdam<br />
10 Ch<strong>in</strong>ese Virg<strong>in</strong>ia Shandong count 38/42, récolte de 2002 25.000 kgs U$ 670,00 Fot Rotterdam<br />
11 Ch<strong>in</strong>ese Hsuji type count 40/50, récolte de 2001 36.000 kgs U$ 765,00 Fot Rotterdam<br />
ETATS-UNIS<br />
12 Usa Medium Runner count 40/50, récolte de 2001 40.000 kgs U$ 900,00 Fot Rotterdam<br />
13 Usa jumbo Runner count 38/42, récolte de 2001 40.000 kgs U$ 950,00 Fot Rotterdam<br />
14 Usa Medium Runner count 40/50, récolte de 2001, blanchie 20.000 kgs U$ 1.070,00 Fot Rotterdam<br />
15 Usa Jumbo Runner count 38/42, récolte de 2001, blanchie 40.000 kgs U$ 1.125,00 Fot Rotterdam<br />
Suite
Suite de la page précédente<br />
Quantité Prix en $EU Condition<br />
AFRIQUE DU SUD<br />
La récolte 2001 et 2002 a été vendue en totalité.<br />
SOUDAN<br />
16 Soudanese Ash<strong>for</strong>d count 50/60 p.oz., récolte de 2000/2001 Vendue Fot Rotterdam<br />
17 Soudanese Ash<strong>for</strong>d count 70/80 p.oz., récolte de 2000/2001 Vendue Fot Rotterdam<br />
Marchandises disponibles sur la base C+F/CIF Rotterdam<br />
18 Argent<strong>in</strong>e Runner count 40/50, récolte de 2002 U$ 770,00 Décembre 2002/Janvier 2003<br />
19 Argent<strong>in</strong>e Runner count 40/50, récolte de 2002, blanchie U$ 930,00 Décembre 2002/Janvier 2003<br />
20 Argent<strong>in</strong>e Runner count 38/42, récolte de 2002 U$ 780,00 Décembre 2002/Janvier 2003<br />
21 Argent<strong>in</strong>e Runner count 38/42, récolte de 2002, blanchie U$ 940,00 Décembre 2002/Janvier 2003<br />
22 Brasilian Runner count 40/50, récolte de 2002 U$ 770,00 Décembre 2002/Janvier 2003<br />
23 Brasilian Runner count 38/42, récolte de 2002 U$ 780,00 Décembre 2002/Janvier 2003<br />
24 Usa Medium Runner count 40/50, récolte de 2001 U$ 900,00 Décembre 2002/Janvier 2003<br />
25 Usa Jumbo Runner count 38/42, récolte de 2001 Vendue<br />
89
Annexe 3 : Politiques commerciales nationales<br />
actuelles du commerce d’arachide (2003)<br />
Tableau 21.<br />
Pays Produit Description Unité Actuel<br />
Argent<strong>in</strong>e Arachides Taxe à l’exportation % du prix à la frontière 4 %<br />
Argent<strong>in</strong>e Tourteaux Remise à l’exportation % 3 %<br />
Argent<strong>in</strong>e Huile d’arachide Remise à l’exportation % 2 %<br />
Union<br />
européenne<br />
Huile d’arachide Taxe à l’importation % 6 %<br />
Union Huile d’arachide Subvention d’importation % 10 %<br />
européenne pour l’huile du Sénégal<br />
Ch<strong>in</strong>e Arachide fraîche Taxe à l’importation % 10 %<br />
Ch<strong>in</strong>e Arachide traitée Taxe à l’importation % 30 %<br />
Ch<strong>in</strong>e Arachides Taxe à la valeur ajoutée % 17 %<br />
Ch<strong>in</strong>e Tourteaux Taxe % 5 %<br />
Ch<strong>in</strong>e Huile d’arachide Taxe % 10 %<br />
Ch<strong>in</strong>e Huile d’arachide<br />
& tourteaux<br />
Taxe à la valeur ajoutée % 17 %<br />
Inde Arachides Taxe % 45 %<br />
Inde Tourteaux Taxe % 45 %<br />
Inde Huile d’arachide Taxe sur l’huile raff<strong>in</strong>ée % 85 %<br />
Canada Arachides Taxe % 0 %<br />
Mexique Arachides Taxe % 0 %<br />
Sénégal Arachides Taxe % 5 %<br />
Sénégal Arachides Taxe sur le traitement % 20 %<br />
Sénégal Tourteaux Taxe % 0 %<br />
Sénégal Huile d’arachide Taxe sur l’huile raff<strong>in</strong>ée % 20 %<br />
Nigeria Arachides Taxe % 0 %<br />
Nigeria Tourteaux Taxe % 0 %<br />
Nigeria Huile d’arachide<br />
– taxe sur<br />
l’huile raf<strong>in</strong>ée<br />
Taxe % 0 %<br />
Afrique du Sud Arachides Taxe % 0 %<br />
Afrique du Sud Arachides Taxe sur le traitement de tourteaux % 6 %<br />
Afrique du Sud Tourteaux Taxe % 0 %<br />
Afrique du Sud Huile d’arachide Taxe sur l’huile raff<strong>in</strong>ée % 20 %<br />
90<br />
Suite
Suite de la page précédente<br />
Pays Produit Description Unité Actuel<br />
Malawi Arachides Taxe % 5 %<br />
Malawi Arachides Taxe sur le traitement pour la<br />
consommation<br />
% 25 %<br />
Malawi Tourteaux Taxe % 0 %<br />
Malawi Huile d’arachide Taxe sur l’huile raff<strong>in</strong>ée % 20 %<br />
Gambie Arachides Taxe % 0 %<br />
Gambie Tourteaux Taxe % 0 %<br />
Gambie Huile d’arachide Taxe sur l’huile raff<strong>in</strong>ée % 0 %<br />
Etats-Unis – arachide exonorée de taxes<br />
Etats-Unis Arachides<br />
décortiquées<br />
Taxes hors-quota 132%<br />
Etats-Unis Arachides coques Taxes hors-quota 164%<br />
Etats-Unis Arachides Importation hors-taxes<br />
en provenance du Mexique<br />
1,000 TM 4.15<br />
Arachide des Etats-Unis vers le Mexique taxes sur-quota<br />
Etats-Unis Arachides décortiquées (prix port 652$/TM) % 99%<br />
Etats-Unis Arachides coques (prix port 284$/TM) % 150%<br />
Arachide des Etats-Unis<br />
Programme GATT d’importations d’arachide américa<strong>in</strong>e<br />
(sur base d’arachide coque)<br />
Etats-Unis Arachides – Argent<strong>in</strong>e 1,000 TM 43.9<br />
Etats-Unis Arachides – Mexique 1,000 TM 4.2<br />
Etats-Unis Arachides – Autres 1,000 TM 9<br />
Etats-Unis Arachides – Total TRQ 1,000 TM 57.1<br />
Etats-Unis Arachides – Prix local ciblé $/lb 0.2475<br />
Etats-Unis Arachides – Prix local du producteur au calibrage $/lb 0.234<br />
Etats-Unis Arachides – Paiement local fixe (ple<strong>in</strong>ement couplé) $/lb 0.018<br />
Arachide des Etats-Unis<br />
Taux de prêt local à mesurer sur une échelle de 1.1<br />
pour la moyenne annuelle<br />
$/lb 0.1775<br />
Etats-Unis Tourteaux Taxe % 0%<br />
Etats-Unis Huile d’arachide Taxe % 0%<br />
De : Begh<strong>in</strong>, John C., N. Diop, H. Matthey, and M. Sewadeh 2003.<br />
91
Annexe 4 : Importations d’arachide américa<strong>in</strong>e sous<br />
l’AGOA, 2002<br />
Tableau 22. Importations américa<strong>in</strong>es pour la consommation en douanes d’une<br />
valeur de $8 12022040 HT (arachide non grillée ou non cuite, décortiquée, sujette à<br />
rajout. Note 2 des Etats-Unis à Ch.12) .<br />
2000 2001 2002 2003<br />
Changement<br />
de pourcentage<br />
—milliers de dollars— Pourcentage Janvier-Juillet YTD2002-<br />
Orig<strong>in</strong>e total US$ ‘000 YTD2003<br />
Toutes $35,962.8 $41,925.1 $35,114.5 100.0 % $35,114.5 $5,301.8 –84.9 %<br />
orig<strong>in</strong>es<br />
Argent<strong>in</strong>e $30,429.7 $37,132.2 $29,927.4 85.2 % $29,927.4 $4,665.0 –84.4 %<br />
Nicaragua $3,012.9 $2,269.2 $4,003.8 11.4 % $4,003.8 $636.9 –84.1 %<br />
République $2,363.1 $2,485.5 $893.9 2.5 % $893.9 $0.0 –100.0 %<br />
d’Afrique<br />
du Sud<br />
Gambie $0.0 $28.2 $217.7 0.6 % $217.7 $0.0 –100.0 %<br />
Brésil $0.0 $0.0 $51.5 0.1 % $51.5 $0.0 –100.0 %<br />
Italie $0.0 $0.0 $20.1 0.1 % $20.1 $0.0 –100.0 %<br />
Australie $157.1 $0.0 $0.0 0.0 % $0.0 $0.0<br />
Zambie $0.0 $0.0 $0.0 0.0 % $0.0 $0.0<br />
Arabie Saoudite $0.0 $0.0 $0.0 0.0 % $0.0 $0.0<br />
Mexique $0.0 $0.0 $0.0 0.0 % $0.0 $0.0<br />
Pays-Bas $0.0 $0.0 $0.0 0.0 % $0.0 $0.0<br />
Malawi $0.0 $0.0 $0.0 0.0 % $0.0 $0.0<br />
El Salvador $0.0 $0.0 $0.0 0.0 % $0.0 $0.0<br />
Ethiopie $0.0 $10.0 $0.0 0.0 % $0.0 $0.0<br />
92
Annexe 5 : Aspects qualités des arachides dans le<br />
commerce<br />
De : FAO http://www.fao.org/<strong>in</strong>pho/compend/text/Ch21sec1_5.htm<br />
Conditions d’exportation et garantie de la qualité<br />
Conditions d’exportation<br />
Les attributs de qualité déf<strong>in</strong>is pour les produits f<strong>in</strong>aux d’arachide changent<br />
selon les pays développés et ceux en voie de développement. Dans les pays<br />
développés, l’arachide est pr<strong>in</strong>cipalement utilisée pour faire de la pâte<br />
d’arachide et consommée grillée ou en confiseries. Cependant, dans plusieurs<br />
pays en voie de développement, elle en est pr<strong>in</strong>cipalement trans<strong>for</strong>mée pour<br />
son huile. La plupart des pays en voie de développement n’ont pas accordé<br />
beaucoup d’attention à la qualité. Ils sont toutefois obligés de répondre aux<br />
normes de qualité fixées par les pays importateurs pour le commerce des<br />
gra<strong>in</strong>es et tourteaux d’arachide. Par exemple, les directives générales sur la<br />
qualité des gousses et des gra<strong>in</strong>es d’arachide <strong>for</strong>mulées par le Natural<br />
Resources Institute of the United K<strong>in</strong>gdom M<strong>in</strong>istry <strong>for</strong> Overseas Development<br />
(NRI) (Institut des ressources naturelles du M<strong>in</strong>istère pour le développement<br />
outre-mer) du Royaume-Uni sont :<br />
couleur et type, taille, texture, propreté, gousse non endommagée et<br />
absence de gousse vide pour l’arachide coque et ;<br />
calibrage pour la taille et le comptage, <strong>for</strong>me, facile à blanchir, couleur du<br />
tégument et conditions, résistance à la casse, teneur en humidité, propreté,<br />
teneur en huile et far<strong>in</strong>e pour la gra<strong>in</strong>e.<br />
Les directives de qualité spécifient que les lots d’arachide doivent être<br />
exempts de contam<strong>in</strong>ation par l’aflatox<strong>in</strong>e. C’est la plus importante<br />
considération pour l’exportation aujourd’hui. Les aflatox<strong>in</strong>es sont des<br />
métabolites toxiques produits par certa<strong>in</strong>s champignons du groupe Aspergillus<br />
flavus. Les utilisateurs peuvent demander des attributs et des exigences<br />
supplémentaires et des spécifications techniques saillantes. Une grande us<strong>in</strong>e<br />
de trans<strong>for</strong>mation d’arachide base ses achats sur six différents paramètres :<br />
taille/catégorie : pour les tailles moyennes du type runner entre 83 mm et<br />
71 mm, les mailles laissent passer 155 à 170 gra<strong>in</strong>es 100 g-1 ;<br />
aflatox<strong>in</strong>e : c<strong>in</strong>q parts par billion au maximum, cependant, récemment<br />
l’Union européenne a modifié les limites de l’Aflatox<strong>in</strong>e B à 2-μg kg 1 -1 pour<br />
la consommation de l’arachide par les hommes ;<br />
93
94<br />
teneur en humidité : entre 6 et 8 % (déterm<strong>in</strong>ation à l’aide d’un four à air<br />
d’échantillon de sol à 130°C pendant 2 h) ;<br />
qualité de l’huile : le taux d’acide dans l’huile pressée à froid à partir des<br />
gra<strong>in</strong>es ne doit pas dépasser 1,5, lorsque la valeur de la peroxydase doit<br />
normalement être zéro et ne doit pas dépasser 1,0 mille équivalents kg -1 .<br />
comestibilité : l’arachide doit être exemptée d’organismes pathogéniques<br />
(exp. Salmonella, Escherichia coli) et aussi d’<strong>in</strong>festation par les <strong>in</strong>sectes,<br />
vivants ou morts et d’œufs vivants ;<br />
il y a d’autres conditions se rapportant à l’odeur et au goût, aux casses, aux<br />
gra<strong>in</strong>es endommagées et aux gra<strong>in</strong>es non décortiquées, aux corps étrangers<br />
et aux arachides décolorées/moisies.<br />
L’<strong>in</strong>spection et la déviation des lots contam<strong>in</strong>és par l’aflatox<strong>in</strong>e<br />
Pour s’assurer que l’arachide utilisée pour la consommation contient mo<strong>in</strong>s de<br />
20 ppb d’aflatox<strong>in</strong>e, diverses agences dans les pays en voie de développement,<br />
par exemple IOPEA en Inde et l’AGC en Afrique, règlementent la qualité de<br />
l’arachide et des sous-produits d’arachide dest<strong>in</strong>és à l’exportation.<br />
Accord AGC avec la FAO<br />
À la 18ème session du Intergovernmental Group on Oilseeds, Oil and Fats<br />
(Groupe <strong>in</strong>ter-gouvernemental sur les oléag<strong>in</strong>eux, les huiles et les corps gras)<br />
de la FAO du 20 au 24 février 1984 à Rome, l’AGC faisait partie de la<br />
délégation qui a discuté des modifications proposées aux directives de la CEE<br />
concernant des limites de tolérance des substances <strong>in</strong>désirables<br />
(particulièrement l’aflatox<strong>in</strong>e B1 ) dans les aliments pour bétail. Après une<br />
discussion détaillée, le groupe a f<strong>in</strong>alement déclaré que « toutes les mesures<br />
réglementaires législatives dans ce doma<strong>in</strong>e devraient nécessairement être<br />
basées sur les données qui peuvent être vérifiées par des moyens fiables, af<strong>in</strong><br />
d’éviter tout préjudice <strong>in</strong>juste aux parties concernées et à la liberté de<br />
standardisation des normes <strong>in</strong>ternationales pour que le Comité conjo<strong>in</strong>t FAO/<br />
OMS du « Codex Alimentarius » puisse fixer les limites d’aflatox<strong>in</strong>e qui sont<br />
<strong>in</strong>ternationalement reconnues, uni<strong>for</strong>mes et raisonnables. Considérant<br />
l’importance des aflatox<strong>in</strong>es, plusieurs pays et la FAO (le Comité Codex<br />
Alimentarius) ont fixé les limites de tolérance pour l’arachide et ses extraits.<br />
L’Inde et les Etats-Unis d’Amérique ont fixé la limite de tolérance à 20 μg kg-1 pour la gra<strong>in</strong>e dest<strong>in</strong>ée à la consommation huma<strong>in</strong>e. À partir de l’année 2000,<br />
l’Union européenne a <strong>for</strong>mulé les limites suivantes d’aflatox<strong>in</strong>e pour les<br />
différentes catégories d’arachides (Tableau 23).
Tableau 23. Limites de tolérance d’aflatox<strong>in</strong>es fixées par l’Union européenne.<br />
Limite de tolérance (μg kg -1 )<br />
Objectifs B 1 B 1 + G 1 + B 2 + G 2<br />
Arachide pour la consommation directe 2 4<br />
Arachide dest<strong>in</strong>ée à la trans<strong>for</strong>mation 5 10<br />
Lait et produits laitiers 0.05 -<br />
Les pr<strong>in</strong>cipaux attributs pour l’exportation d’arachide sont le comptage<br />
des morceaux se rapportant au nombre de gra<strong>in</strong>es par once, aux aflatox<strong>in</strong>es et<br />
aux caractéristiques physiques telles que les casses et les mélanges. La taille de<br />
la gra<strong>in</strong>e déf<strong>in</strong>ie par le comptage des morceaux est cruciale pour déterm<strong>in</strong>er la<br />
valeur des produits. À ce jour, il n’y a eu aucune limite pour les résidus de<br />
pesticide dans la gra<strong>in</strong>e et le tourteau. L’<strong>in</strong>térêt croissant pour une nourriture<br />
sa<strong>in</strong>e a lancé le concept de l’agriculture biologique dans les pays en voie de<br />
développement. La préférence va vers l’arachide cultivée sans pesticides ni<br />
engrais synthétiques.<br />
Limites d’aflatox<strong>in</strong>e fixées par les pays importateurs<br />
Plusieurs pays importateurs d’arachide ont fixé des limites aux taux<br />
d’aflatox<strong>in</strong>es permis dans les arachides et les sous-produits d’arachide<br />
(Tableau 24). Les pays qui dépendent de l’exportation de produits<br />
susceptibles d’être contam<strong>in</strong>és à l’aflatox<strong>in</strong>e comme l’arachide par exemple<br />
sont obligés d’établir des limites d’exportation pour satisfaire les exigences des<br />
importateurs. Ceci mène à une perte économique si les exigences sont<br />
<strong>in</strong>utilement strictes. Là où un aliment local est également un article<br />
d’exportation, l’exportation des aliments les plus sa<strong>in</strong>s peut mener à la<br />
consommation locale de plus de nourritures contam<strong>in</strong>ées. En partie, ceci<br />
augmente le risque de toxicité sur la population <strong>in</strong>digène.<br />
Préférences du consommateur<br />
La qualité de l’arachide et la préférence des consommateurs peuvent être<br />
jugées sur les paramètres suivants :<br />
Goût : le goût de l’arachide grillée joue un rôle important dans son<br />
approbation par les consommateurs et autres utilisateurs. Le goût joue<br />
également un rôle important dans l’acceptation des produits à base d’arachide<br />
95
Tableau 24. Niveaux maximum possibles d’aflatox<strong>in</strong>e dans l’arachide importée<br />
comme aliment pour les hommes et pour la consommation par le bétail et la volaille.<br />
tels que la pâte d’arachide. Les échantillons de plusieurs génotypes à haut<br />
rendement ont prouvé que la qualité de leur goût doit être améliorée. Une<br />
méthode d’évaluation de la qualité de cuisson des arachides en les bouillant<br />
dans leur coque a été standardisée à l’ICRISAT (ICRISAT, Rapport 1990).<br />
Plus de 300 composants ont été détectés dans l’arachide grillée. Les sucres<br />
contenus dans l’arachide jouent également un rôle important comme<br />
précurseurs de goût dans la production d’arachide grillée. A<strong>in</strong>si il est<br />
important de standardiser l’essai employé pour évaluer l’acceptation de<br />
l’arachide grillée en effectuant une évaluation sensorielle et en appliquant les<br />
résultats à la présence ou à l’absence des divers composants volatiles et les<br />
concentrations dans lesquelles ils sont présents. Les études <strong>in</strong>diquent que la<br />
concentration d’hexanal est l’un des huit composants qui donne un goût<br />
réprehensible à l’arachide, ce qui a été corrélée par un panel professionnel<br />
d’évaluation du goût. La caractérisation du facteur goût par chromatographie<br />
en phase gazeuse permettrait aux sélectionneurs d’identifier les cultivars qui<br />
ont un bon profil en ce qui concerne le goût pour des développements futurs<br />
(Ahmed et Young, 1982).<br />
Texture : craquants et croustillants, d’importants attributs de texture qui sont<br />
des qualités sensorielles et souhaitables dans l’arachide. Une nourriture<br />
croustillante est ferme (raide) et se casse facilement une fois dé<strong>for</strong>mée en<br />
émettant un bruit craquant/cassant. Basée sur une étude des consommateurs,<br />
la croustillance a été rapportée comme étant le seul paramètre de texture et le<br />
96<br />
Niveau maximum permis (ng g -1 ), 1995<br />
Pays Type d’aflatox<strong>in</strong>e Aliments Aliments bétail<br />
Belgique B 1 5 20<br />
France B 1 1 20<br />
Allemagne B 1 2 20<br />
Irelande B 1 5 20<br />
Italie B 1 5 20<br />
Pays-Bas B 1 0 20<br />
Suède B 1 , B 2 , G 1 , G 2 5 10<br />
Royaume-Uni B 1 , B 2 , G 1 , G 2 4 20<br />
USA B 1 , B 2 , G 1 , G 2 20 20<br />
Source : Freeman et al. 1999, ICRISAT
plus versatile. Un certa<strong>in</strong> nombre d’<strong>in</strong>struments ont été développés pour<br />
mesurer les propriétés mécaniques des gousses, qui peuvent être liés à la<br />
texture des gra<strong>in</strong>s.<br />
Qualité sensorielle : la <strong>for</strong>ce et le travail mécaniques ont habituellement une<br />
<strong>for</strong>te corrélation <strong>in</strong>verse avec les po<strong>in</strong>ts sensoriels croustillant et craquant.<br />
L’évaluation sensorielle de la texture dans la nourriture appartient au doma<strong>in</strong>e<br />
de la psychologie connue sous le nom de psychophysique. La psychophysique<br />
concerne directement la corrélation entre une expérience sensorielle et des<br />
mesures physiques. La classification des essais sensoriels est faite à l’aide de<br />
deux mesures : i.) affective et ii.) analytique. Les essais affectifs sont utilisés<br />
pour évaluer la préférence et/ou l’acceptation des produits. Cependant, cette<br />
méthode ne peut pas fournir un rapport proportionnel entre les po<strong>in</strong>ts<br />
sensoriels et les mesures physiques. Les essais analytiques sont utilisés pour la<br />
quantification des caractéristiques sensorielles. Lors de l’évaluation de qualité<br />
de la texture de l’arachide, le membre du jury sensoriel peut mordre ou<br />
mâcher les gra<strong>in</strong>s d’arachide. La différence entre les propriétés physiques de<br />
l’arachide fraîche, blanchiment par dépelliculage des gra<strong>in</strong>es et grillée a été<br />
mieux dist<strong>in</strong>guée par un essai de compression (Vivar et Brennan, 1980).<br />
Quand l’arachide est exposée à un environnement à <strong>for</strong>te humidité relative,<br />
elle absorbe l’humidité et devient trempée, les consommateurs n’aiment pas<br />
de tels produits.<br />
Couleur : La couleur des gra<strong>in</strong>s d’arachide fraîche est attribuée au testa et à<br />
l’huile. Ce sont les tann<strong>in</strong>s et les composants de type catéchol qui donnent la<br />
couleur au testa. La couleur des cotylédons est due pr<strong>in</strong>cipalement à la<br />
couleur de l’huile présente dans les cellules des cotylédons. Les colorants de<br />
carotenoïde présents dans l’huile sont la â-carotène et la luté<strong>in</strong>e. La<br />
concentration maximum de ces colorants se produit dans les gra<strong>in</strong>es non<br />
mûres, par exemple, 60 μg du â-carotène et 138 μg de luté<strong>in</strong>e par litre d’huile<br />
et dim<strong>in</strong>ue à mesure que l’arachide arrive à la maturité. Le consommateur<br />
préfère une huile d’arachide légèrement colorée. La couleur caractéristique de<br />
l’arachide grillée est pr<strong>in</strong>cipalement due aux réactions des sucres am<strong>in</strong>osacides<br />
suivies de la production des melan<strong>in</strong>es. La caramélisation des sucres<br />
peut contribuer à la coloration brune de l’arachide grillée. Les consommateurs<br />
rejettent les arachides grillées qui sont molles ou trempées quoiqu’elles<br />
exhibent une couleur attrayante et un bon goût (Hodge, 1953). L’arachide<br />
<strong>in</strong>dienne est très populaire sur le marché <strong>in</strong>ternational pour utilisation à table,<br />
97
grâce à sa saveur naturelle, un goût de noisettes et une texture croustillante et<br />
qu’elle a également une durée de conservation relativement plus longue. Par<br />
conséquent, avec le goût grandissant des consommateurs à travers le monde<br />
pour une nourriture biologique au goût naturel, l’arachide <strong>in</strong>dienne a une<br />
meilleure perspective d’exportation. La consommation d’arachide en gra<strong>in</strong>es<br />
et dans la fabrication de la pâte d’arachide est basée sur l’utilisation de gra<strong>in</strong>es<br />
d’arachides grillées. La durée de torréfaction a une <strong>in</strong>fluence significative sur<br />
la puissance de l’odeur et du goût. Les arachides fraîches et grillées devraient<br />
être exemptes de corps étrangers, non altérées par des substances toxiques ou<br />
nocives telles que les pesticides et les micro-organismes. La Food and Drug<br />
Adm<strong>in</strong>istration (l’Adm<strong>in</strong>istration de l’alimentation et des médicaments)<br />
(1969) a publié des directives pour les fabricants de nourriture qui produisent<br />
des aliments y compris l’arachide et les sous-produits d’arachide. Les<br />
« méthodes officielles de l’AOAC » donnent des méthodes (36.020 à 36.024)<br />
pour la déterm<strong>in</strong>ation des impuretés dans les produits de consommation.<br />
98
Annexe 6 : Aflatox<strong>in</strong>e chez l’arachide<br />
Les aflatox<strong>in</strong>es sont les substances toxiques, cancérigènes, tératogéniques et<br />
immunosuppressives qui sont produites quand les contra<strong>in</strong>tes toxigènes de<br />
l’Aspergillus flavus L<strong>in</strong>k. ex Fries et A. parasiticus Speare se développent sur<br />
l’arachide, le maïs, le coton, le piment et beaucoup d’autres produits agricoles.<br />
On signale que les analyses de sang ont prouvé que des pourcentages très<br />
élevés de la population de plusieurs pays en Asie et en Afrique ont été exposés<br />
aux aflatox<strong>in</strong>es. Le maïs et l’arachide sont importants dans le régime<br />
alimentaire des populations en Asie et en Afrique et sont susceptibles d’être<br />
les pr<strong>in</strong>cipales sources de ces tox<strong>in</strong>es. Les aflatox<strong>in</strong>es B 1 et G 1 sont<br />
généralement les <strong>for</strong>mes produites sur l’arachide. Elles sont <strong>for</strong>tement<br />
toxiques sur le bétail et sont impliquées dans les maladies huma<strong>in</strong>es.<br />
L’aflatox<strong>in</strong>e M 1 (AFM1) est un métabolite important de l’aflatox<strong>in</strong>e B 1<br />
présente dans le lait des animaux qui ont consommés des aliments contam<strong>in</strong>és<br />
par l’aflatox<strong>in</strong>e B 1 (Polan et al., 1974). Les niveaux relativement élevés du<br />
carc<strong>in</strong>ome hepato-cellulaire primaire peuvent refléter les <strong>in</strong>teractions entre<br />
les hépatites B et C (qui sont dues à la déficience en proté<strong>in</strong>es chez les<br />
enfants) et l’aflatox<strong>in</strong>e. Il n’est donc pas étonnant que la contam<strong>in</strong>ation<br />
d’aflatox<strong>in</strong>e soit le problème de qualité le plus important dans beaucoup de<br />
produits dans le monde entier.<br />
L’<strong>in</strong>fection de l’arachide par Aspergillus se produit dans les conditions<br />
avant et post-récolte. L’<strong>in</strong>fection avant la récolte par A. flavus et par<br />
conséquent la contam<strong>in</strong>ation d’aflatox<strong>in</strong>e est plus importante dans les zones<br />
semi-arides, en particulier quand la sécheresse <strong>in</strong>tervient en f<strong>in</strong> de saison<br />
(Waliyar et al., 1994). Il y a également des preuves que les dégâts causés sur<br />
l’arachide par des parasites du sol tels que les termites augmentent la<br />
contam<strong>in</strong>ation d’aflatox<strong>in</strong>e. Les conditions post-récolte sont également<br />
importantes. Les conditions favorables à l’<strong>in</strong>fection pendant la récolte et le<br />
stockage peuvent entra<strong>in</strong>er un développement rapide de champignons et une<br />
production plus élevée de la tox<strong>in</strong>e (Mehan et al., 1991). Les études en<br />
Afrique ont montré que l’arachide est souvent stockée sous <strong>for</strong>me de gousses,<br />
dans ce cas, les <strong>in</strong>sectes peuvent facilement endommager les gousses et<br />
faciliter la pénétration des champignons.<br />
Limites d’aflatox<strong>in</strong>e<br />
Plusieurs pays importateurs ont fixé des limites aux niveaux d’aflatox<strong>in</strong>es<br />
permis dans l’arachide et les produits à base d’arachide. Quelques pays<br />
99
comme Cuba, la Malaisie et le Portugal ont une limite de tolérance zéro.<br />
L’Union européenne a fixé une limite de 2 μg kg -1 pour B 1 et les aflatox<strong>in</strong>es<br />
totales 4 μg kg -1 . Tandis que la plupart des autres pays ont fixé la limite<br />
pratique de 10 à 30 μg kg -1 , y compris l’Australie (15 μg kg -1 ), le Canada<br />
(15 μg kg -1 ), l’Inde (30 μg kg -1 ) et les Etats-Unis (20 μg kg -1 ).<br />
Selon la Food and Drug Adm<strong>in</strong>istration des Etats-Unis, le niveau<br />
d’aflatox<strong>in</strong>e M 1 dans le lait ne devrait pas dépasser 0.5 μg kg -1 mais le niveau<br />
est fixé à 0.05 μg kg -1 dans la majorité des pays européens et du Codex<br />
Alimentarius. En Autriche et en Suisse, le niveau maximum est réduit à 0.01<br />
μg kg -1 pour la nourriture pour bébés. Cela explique la différence des niveaux<br />
de tolérance entre les pays et beaucoup n’ont aucune limite légale pour<br />
l’aflatox<strong>in</strong>e M 1 dans le lait et les produits laitiers.<br />
Reférénces<br />
Waliyar F, Ba A, Hamma Hassan, Bonkoungou S and Bosc JP. 1994. Sources of<br />
resistance to Aspergillus flavus and aflatox<strong>in</strong> contam<strong>in</strong>ation <strong>in</strong> groundnut genotypes <strong>in</strong><br />
<strong>West</strong> <strong>Africa</strong>. JA No 1366. Plant disease 78, 7:704-708.<br />
Waliyar F, Reddy SV, Subramanyam K, Reddy TY, Ramadevi K, Craufurd PQ and<br />
Wheeler TR. 2003. Importance of mycotox<strong>in</strong>s <strong>in</strong> food and feed <strong>in</strong> India. Aspects of<br />
Applied Biology 68:147-154.<br />
100
Annexe 7 : l’Organisation mondiale de la santé sur<br />
les mycotox<strong>in</strong>es<br />
De : http://www.<strong>in</strong>chem.org/documents/ehc/ehc/ehc011.htm<br />
CRITÈRES DE SANTÉ ENVIRONNEMENTAUX 11 : MYCOTOXINES<br />
PROGRAMME INTERNATIONAL SUR LA SECURITE CHIMIQUE<br />
Publié sous le patronage conjo<strong>in</strong>t du<br />
Programme des Nations Unies pour l’environnement,<br />
et l’Organisation mondiale de la santé<br />
World Health Organization<br />
Geneva, 1979<br />
ISBN 92 4 154071 0<br />
(c) World Health Organization 1979<br />
MYCOTOXINES<br />
Sources et apparition<br />
Les aflatox<strong>in</strong>es sont produites par certa<strong>in</strong>es contra<strong>in</strong>tes d’Aspergillus flavus et<br />
Aspergillus parasiticus. Ces champignons sont omniprésents et le potentiel de<br />
contam<strong>in</strong>ation des produits alimentaires et des aliments pour bétail est très<br />
important. L’apparition et l’importance de la contam<strong>in</strong>ation par l’aflatox<strong>in</strong>e<br />
changent selon les facteurs géographiques et saisonniers, et également selon<br />
les conditions dans lesquelles un produit est cultivé, récolté et stocké. Les<br />
cultures en zones tropicales et subtropicales sont plus sujettes à la<br />
contam<strong>in</strong>ation que celles des régions tempérées, puisque les conditions<br />
optimales pour la <strong>for</strong>mation de tox<strong>in</strong>e sont répandues dans les zones à <strong>for</strong>tes<br />
humidité et température. Les champignons tox<strong>in</strong>ogènes peuvent <strong>in</strong>fecter les<br />
récoltes au stade de développement par suite d’attaques d’<strong>in</strong>sectes ou autres<br />
dégâts et peuvent produire des tox<strong>in</strong>es avant la récolte, ou pendant la récolte<br />
et le stockage.<br />
Les structures chimiques des aflatox<strong>in</strong>es ont été élucidées et des<br />
techniques analytiques sont disponibles pour leur identification et<br />
déterm<strong>in</strong>ation dans les produits alimentaires et les tissus du corps huma<strong>in</strong> à<br />
µg/kg et à un niveau <strong>in</strong>férieur. Quatre aflatox<strong>in</strong>es (B1 , G1 , B2 , G2 ) se<br />
101
produisant souvent simultanément, ont été détectées dans les aliments<br />
d’orig<strong>in</strong>e végétale comme le maïs, l’arachide, les arbres à noix ansi que<br />
beaucoup d’autres produits alimentaires et aliments.<br />
Chez les animaux, les aflatox<strong>in</strong>es <strong>in</strong>gérées peuvent se dégrader par<br />
métabolisation. L’aflatox<strong>in</strong>e B 1 peut être convertie en aflatox<strong>in</strong>e M 1 qui peut<br />
apparaître dans le lait. La concentration de l’aflatox<strong>in</strong>e M 1 dans le lait de<br />
vaches est environ 300 fois <strong>in</strong>férieure à la concentration d’aflatox<strong>in</strong>e B 1<br />
consommée dans l’alimentation. Chez certa<strong>in</strong>s animaux d’expérimentation,<br />
seule une petite quantité d’aflatox<strong>in</strong>e adm<strong>in</strong>istrée a été retrouvée dans les<br />
tissus, 24 h après <strong>in</strong>jection.<br />
Dans des études sur des porcs, des résidus d’aflatox<strong>in</strong>e ont été détectés<br />
dans le foie, le re<strong>in</strong> et les tissus de muscles d’animaux auxquels des aflatox<strong>in</strong>es<br />
ont été adm<strong>in</strong>istrées dans l’alimentation pendant plusieurs mois. Aucune<br />
publication n’est disponible sur les résidus d’aflatox<strong>in</strong>e dans les tissus de ces<br />
animaux abattus.<br />
L’utilisation des variétés résistantes de semences et de pesticides et des<br />
procédés soignés de séchage et de stockage peuvent réduire l’<strong>in</strong>festation<br />
fongique et dim<strong>in</strong>uer a<strong>in</strong>si la contam<strong>in</strong>ation des aliments par les aflatox<strong>in</strong>es.<br />
La tox<strong>in</strong>e n’est pas élim<strong>in</strong>ée des produits alimentaires ou des aliments pour les<br />
animaux par la cuisson ord<strong>in</strong>aire ou par des techniques de trans<strong>for</strong>mation et<br />
comme les procédés pré et post-récolte n’assurent pas une protection totale<br />
contre la contam<strong>in</strong>ation d’aflatox<strong>in</strong>e, des techniques de décontam<strong>in</strong>ation ont<br />
été développées. La tox<strong>in</strong>e est généralement concentrée dans une petite<br />
proportion de semences qui sont souvent de couleurs différentes.<br />
L’élim<strong>in</strong>ation des semences décolorées par calibrage peut réduire de<br />
manière significative les niveaux d’aflatox<strong>in</strong>e de certa<strong>in</strong>es cultures comme<br />
l’arachide. L’<strong>in</strong>spection visuelle de la croissance de moisissure avant la<br />
trans<strong>for</strong>mation peut être la première technique de criblage mais les<br />
champignons tox<strong>in</strong>ogènes peuvent être présents sans la présence notable<br />
d’aflatox<strong>in</strong>es et vice versa. La distribution d’aflatox<strong>in</strong>e dans un produit<br />
contam<strong>in</strong>é et non trans<strong>for</strong>mé étant <strong>in</strong>égale, un échantillonnage adéquat est<br />
essentiel pour une surveillance efficace. Les aflatox<strong>in</strong>es pouvant être<br />
chimiquement détruites <strong>in</strong> vitro par plusieurs agents oxydants et l’alcalis, le<br />
peroxyde d’hydrogène et l’ammoniaque sont actuellement employés pour la<br />
décontam<strong>in</strong>ation chimique des aliments pour les animaux.<br />
102
Effets et expositions associées<br />
Des <strong>in</strong>festations d’aflatoxicose chez les animaux de la ferme ont été<br />
rapportées dans plusieurs secteurs à travers le monde. Le foie est<br />
pr<strong>in</strong>cipalement affecté dans de telles <strong>in</strong>festations et également dans des<br />
études expérimentales sur des animaux, y compris des primates non huma<strong>in</strong>s.<br />
Les lésions aiguës du foie sont caractérisées par la nécrose des hepatocytes et<br />
de la prolifération biliaire, et les manifestations chroniques peuvent <strong>in</strong>clure la<br />
fibrose. Un niveau d’alimentation d’aflatox<strong>in</strong>e aussi bas que 300 μg/kg peut<br />
<strong>in</strong>duire l’aflatoxicose chronique chez les porcs en 3-4 mois.<br />
L’aflatox<strong>in</strong>e B 1 est un carc<strong>in</strong>ogène du foie chez près de 8 espèces y<br />
compris chez les primates non huma<strong>in</strong>s. Des rapports dose-réaction ont été<br />
établis dans des études sur les rats et la truite arc-en-ciel, avec une <strong>in</strong>cidence<br />
de tumeur estimée à 10 % pouvant se produire aux niveaux d’alimentation<br />
d’aflatox<strong>in</strong>e B 1 de 1 μg/kg, et 0.1 μg/kg, respectivement. Dans certa<strong>in</strong>es<br />
études, des carc<strong>in</strong>omas du colon et des re<strong>in</strong>s chez les rats traités avec des<br />
aflatox<strong>in</strong>es ont été observés. L’aflatox<strong>in</strong>e B 1 cause des aberrations<br />
chromosomiques et la rupture d’ADN des cellules de plantes et d’animaux, et,<br />
après l’activation microsomique, des mutations de gène dans plusieurs<br />
systèmes d’essai bactériens. A <strong>for</strong>tes doses, elle peut être tératogénique.<br />
La toxicité et la cancérogénicité aiguës des aflatox<strong>in</strong>es sont plus élevées<br />
chez les rats mâles que chez les femelles ; la participation hormonale peut être<br />
responsable de cette différence liée au sexe. Le statut alimentaire chez les<br />
animaux, en particulier en ce qui concerne les lipotropes, les proté<strong>in</strong>es, la<br />
vitam<strong>in</strong>e A et les lipides (y compris les acides gras cyclopropénoïdes), peuvent<br />
modifier l’expression de la toxicité aiguë ou la cancérogénicité ou les deux.<br />
Il y a peu d’<strong>in</strong><strong>for</strong>mation sur l’association de l’hépatoxicité aiguë chez<br />
l’homme à l’exposition aux aflatox<strong>in</strong>es mais des cas des dégâts aigus sur le foie<br />
ont été rencontrés et qui pourraient probablement être attribués à<br />
l’aflatoxicose aiguë. Une manifestation récente d’hépatite aiguë dans les<br />
districts adjacents de deux états vois<strong>in</strong>s au nord-ouest de l’Inde, a affecté<br />
plusieurs centa<strong>in</strong>es de personnes par suite d’<strong>in</strong>gestion de maïs <strong>for</strong>tement<br />
contam<strong>in</strong>é, dont quelques échantillons contena<strong>in</strong>t des niveaux d’aflatox<strong>in</strong>e sur<br />
une échelle de mg/kg, le niveau le plus élevé rapporté étant de 15 mg/kg.<br />
Le cancer du foie est plus fréquent dans certa<strong>in</strong>es régions d’Afrique et<br />
d’Asie du sud-est que dans d’autres parties du monde et, quand l’<strong>in</strong><strong>for</strong>mation<br />
épidémiologique locale est prise en compte a<strong>in</strong>si que les données sur les<br />
animaux d’expérimentation, il s’avère que l’exposition accrue aux aflatox<strong>in</strong>es<br />
103
peut augmenter le risque de cancer primaire du foie. Les données rassemblées<br />
du Kenya, de Mozambique, du Souaziland et de Thaïlande, montrent une<br />
corrélation positive entre la prise diététique quotidienne d’aflatox<strong>in</strong>e (sur une<br />
échelle de 3.5 à 222.4 ng/kg du poids corporel par jour) et le taux brut<br />
d’<strong>in</strong>cidence de cancer primaire du foie (s’étendant sur 1.2 à 13.0 cas par 100<br />
000 personnes par an). Il y a également des preuves d’une participation<br />
essentielle des fonctions vitales sur l’étiologie de la maladie.<br />
Compte tenu des preuves sur les effets, en particulier les effets<br />
cancérigènes des aflatox<strong>in</strong>es chez plusieurs espèces animales, et en raison de<br />
l’association entre les niveaux d’exposition à l’aflatox<strong>in</strong>e et l’<strong>in</strong>cidence<br />
huma<strong>in</strong>e du cancer du foie observé dans certa<strong>in</strong>es régions du monde,<br />
l’exposition aux aflatox<strong>in</strong>es devrait être ma<strong>in</strong>tenue au niveau le plus bas<br />
possible. Les niveaux de tolérance pour les produits alimentaires établis dans<br />
plusieurs pays devraient être assimilés comme des outils de gestion prévus<br />
pour faciliter l’exécution des programmes de gestion d’aflatox<strong>in</strong>e, non comme<br />
des limites d’exposition qui assureront nécessairement une protection<br />
sanitaire.<br />
104
Annexe 8 : Acheteurs et <strong>in</strong>termédiaires européens<br />
d’arachide<br />
UK<br />
Abacus Trad<strong>in</strong>g Co. Ltd<br />
International trader <strong>in</strong> peanuts<br />
1278 High Road, Whetstone<br />
London N20 9HH<br />
Tel: +44 (0)20 8343 9900<br />
Fax : +44(0)20 8343 9227<br />
Email: abacus@nuts.netkonect.co.uk<br />
Afrika Produkte (UK) Ltd<br />
Broker of edible nuts, seeds and<br />
pulses<br />
12/14 Moor Lane, Crosby<br />
Liverpool L23 2UE<br />
Tel: +44 (0)151 9313221<br />
Fax: +44 (0)151 9315491<br />
Email: afrikapr@bt<strong>in</strong>ternet.com<br />
Barrow Lane & Ballard Ltd<br />
International distributors of peanuts,<br />
tree nuts<br />
and dates (bulk packed/processed)<br />
52/54 Southwark Street<br />
London SE1 1UN<br />
Tel: +44 (0) 20 7357 8775<br />
Fax: +44 (0) 20 7357 8905<br />
Email: BLB@barrow-lane.co.uk<br />
Birdsong Peanuts<br />
Peanut sheller<br />
P O Box 1400, 612 Madison Avenue<br />
Suffolk, Virg<strong>in</strong>ia 23434 USA<br />
Tel: +1 (804) 5393456<br />
Fax: +1 (804) 5397360<br />
Email: <strong>in</strong>fo@birdsong-peanuts.com<br />
Bond Commodities Ltd<br />
Import range of edible nuts <strong>for</strong><br />
further manufacture<br />
New Loom House, 101 Back<br />
Church Lane<br />
London E1 1LU<br />
Tel: +44(0)20 7488 1949<br />
Fax: +44(0)20 7488 1953<br />
Email:<br />
<strong>in</strong>fo@bondcommodities.demon.co.uk<br />
Canon Garth Limited<br />
Traders of edible nuts<br />
Alexander House, 31-39 London<br />
Road<br />
Sevenoaks, Kent TN13 1JY<br />
Tel: +44 (0)1732 743434<br />
Fax: +44 (0)1732 743444<br />
Email: cgl@ctcs.demon.co.uk<br />
Carrex International Ltd<br />
Import/export of edible nuts and<br />
dried fruit<br />
Hasl<strong>in</strong>gton Hall, Hasl<strong>in</strong>gton<br />
Crewe, Cheshire CW1 5RX<br />
Tel: +44 (0)1270 588722<br />
Fax: +44 (0)1270 255050<br />
Email: <strong>in</strong>fo@carrex<strong>in</strong>t.co.uk<br />
Website: www.carrex<strong>in</strong>t.co.uk<br />
105
CJ Wildbird Foods Ltd<br />
Manufacturers of wildbird food<br />
The Rea, Upton Magna<br />
NR. Shrewsbury, Shropshire SY4<br />
4UB<br />
Tel: +44 (0)1743 709545<br />
Fax: +44 (0)1743 709504<br />
Email: <strong>in</strong>fo@birdfood.co.uk<br />
Website: www.birdfood.co.uk<br />
Community Foods Ltd<br />
Micross, Brent Terrace<br />
London NW2 1LT<br />
Tel: +44 (0)20 84509411<br />
Fax: +44 (0)20 82081803<br />
Percy Dalton’s Famous Peanut Co<br />
Ltd<br />
Description: Trader and<br />
manufacturer of<br />
peanut, nut and dried fruit products.<br />
Old Ford Works, Dace Road<br />
London E3 2PE<br />
Tel: +44 (0)20 89859241<br />
Fax: +44 (0)20 89863028<br />
Email: enquiries@percydaltons.com<br />
Website: www.percydaltons.com<br />
Demos Ciclitira Ltd<br />
International traders <strong>in</strong> peanuts<br />
and nuts.<br />
Capitol House, 60-62 Leman Street<br />
London E1 8EU<br />
Tel: +44 (0)20 7626 1121<br />
Fax: +44 (0)20 7702 0560<br />
106<br />
F Duerr & Sons Ltd<br />
Peanut butter manufacturer<br />
Prestage Street, Old Traf<strong>for</strong>d<br />
Manchester M16 9LH<br />
Tel: +44 (0)1612 262251<br />
Fax: +44 (0)1612 263058<br />
Email: <strong>in</strong>fo@duerrs.co.uk<br />
Website: www.duerrs.co.uk<br />
Greenangle Ltd<br />
Importation and distribution of nuts.<br />
L<strong>in</strong>ton House, 164-180 Union<br />
Street<br />
London SE1 0LH<br />
Tel: +44 (0)20 7928 2428<br />
Fax: +44 (0)20 7928 9997<br />
Email: greenangle@mail.com<br />
Imperial Snack Foods Ltd<br />
Eastern flavoured snack food<br />
products<br />
Unit 5, Culwell Trad<strong>in</strong>g Estate,<br />
Woden Rd.<br />
Wolverhampton, <strong>West</strong> Midlands<br />
W10 0PG<br />
Tel: +44 (0)1902 351104<br />
Fax: +44 (0)1902 351375<br />
Email: impsnacks@aol.com<br />
Website:<br />
www.imperialsnackfoods.co.uk<br />
J & J B Traders Ltd<br />
Commodity trader<br />
Hamilton House, 1 Temple Avenue,<br />
Victoria Embankment<br />
London EC4Y 0HA<br />
Tel: +44 (0)20 73532123<br />
Fax: +44 (0)20 75838823<br />
Email: jjbtl@bt<strong>in</strong>ternet.com
Richard Kettlewell<br />
Broker <strong>in</strong> <strong>Groundnut</strong> and<br />
Consultant on <strong>Groundnut</strong> Trade<br />
Email: RGWK@aol.com<br />
Markbeech Products Ltd<br />
Importers, processors and<br />
distributors of<br />
groundnuts, treenuts, coconut and<br />
dried fruits<br />
Station Road, Rowley Regis<br />
<strong>West</strong> Midlands B65 0LJ<br />
Tel: +44 (0)1215 613366<br />
Fax: +44 (0)1215 592429<br />
Email: enquiries@markbeech.co.uk<br />
Website: www.markbeech.co.uk<br />
Meridian Foods Ltd<br />
Producer of speciality oils, peanut<br />
and speciality<br />
nut butters.<br />
Corwen, Denbeighshire LL21 9RJ<br />
Tel: +44 (0)1490 413151<br />
Fax: +44 (0)1490 412032<br />
Email: <strong>in</strong>fo@meridianfoods.co.uk<br />
Website: www.meridianfoods.co.uk<br />
Murcott (UK) Ltd<br />
The Arnold Bus<strong>in</strong>ess Park,<br />
Branbridges Rd.<br />
East Peckham Kent TN12 5LG<br />
Tel: +44 (0)1622 872929<br />
Fax: +44 (0)1622 873221<br />
Nestle (UK) Ltd<br />
Food and confectionery<br />
manufacturers.<br />
St George’s House<br />
Croydon Surrey CR9 1NR<br />
Tel: +44 (0)20 86675257<br />
Fax: +44 (0)20 86675413<br />
Website: www.nestle.co.uk<br />
Pacific Foods Ltd<br />
Trader<br />
2nd Floor, 10 M<strong>in</strong>ories, London<br />
EC3N 1BJ<br />
Tel: +44 (0)20 7702 1939<br />
Fax: +44 (0)20 7702 9597<br />
Email: <strong>in</strong>fo@pacificfoods.co.uk<br />
The Paragon Food Co Ltd<br />
Import<strong>in</strong>g, pack<strong>in</strong>g and distribution<br />
of peanuts and nuts<br />
1 <strong>West</strong>borough Road<br />
<strong>West</strong>cliff On Sea, Essex SS0 9DR<br />
Tel: +44 (0)1702 390999<br />
Fax: +44 (0)1702 344377<br />
Email: <strong>in</strong>fo@paragonfoods.com<br />
Website: www.paragonfoods.com<br />
George Payne & Co Ltd<br />
Confectionery manufacturers.<br />
P O Box 113, Croydon Surrey CR9<br />
4BU<br />
Tel: +44 (0)20 86887744<br />
Fax: +44 (0)20 86860082<br />
Email: <strong>in</strong>fo@paynes.co.uk<br />
107
Premier Fruit & Nut Ltd<br />
Premier House, 325 Streatham High<br />
Road<br />
London SW16 3NT<br />
Tel: +44 (0)20 86798226<br />
Fax: +44 (0)20 86798823<br />
Readifoods Ltd<br />
Packers and blenders of dried fruit<br />
and nut mixes<br />
Station Road, Heck<strong>in</strong>gton<br />
Slea<strong>for</strong>d L<strong>in</strong>colnshire NG34 9JH<br />
Tel: +44 (0)1529 461551<br />
Fax: +44 (0)1529 461454<br />
Email: Readifoods@bt<strong>in</strong>ternet.com<br />
Website: www.Readifoods.com<br />
Southwaves Ltd<br />
Edible nut traders<br />
18 Broad Rob<strong>in</strong><br />
Gilligham, Dorset SP8 4PJ<br />
Tel: +44 (0)1747 822088<br />
Fax: +44 (0)1747 822838<br />
Email: southwvs@aol.com<br />
Sunscoop Products Ltd<br />
Peanut and nut processor.<br />
Units K1/K3, Coedcae Lane<br />
Industrial<br />
Estate, Pontyclun, Mid. Glamorgan<br />
South Wales CF72 9HG<br />
Tel: +44 (0)1443 229229<br />
Fax: +44 (0)1443 228883<br />
Email: nuts@sunscoop.co.uk<br />
108<br />
Sun Valley Ltd<br />
Processors and packers of peanuts<br />
and nut products.<br />
Georgia Avenue, Bromborough<br />
Wirral L62 3RD<br />
Tel: +44 (0)151 3347788<br />
Fax: +44 (0)151 3347789<br />
Email: <strong>in</strong>fo@sun-valley.co.uk<br />
Website: www.sun-valley.co.uk<br />
R S T<strong>in</strong>sley (Liverpool) Ltd<br />
Peanut and nut broker<br />
Cunard Build<strong>in</strong>g - 2nd Floor,<br />
Water Street<br />
Liverpool L3 1DS<br />
Tel: +44 (0)151 2360797<br />
Fax: +44 (0)151 2364556<br />
Email: rst<strong>in</strong>ut@aol.com<br />
Website:<br />
www.rst<strong>in</strong>sleynutbrokers.com<br />
Trigon Snacks Ltd<br />
Manufacturer of snack nuts.<br />
Atherton Road, A<strong>in</strong>tree<br />
Liverpool L9 7AQ<br />
Tel: +44 (0)151 5238700<br />
Fax: +44 (0)151 5215370<br />
Email: enquiries@trigon-snacks.com<br />
TRS Wholesale Co Ltd<br />
Wholesalers of ethnic foods and<br />
distributors of<br />
nuts, lentils, rice and spices.<br />
Southbridge Way, The Green<br />
Southall, Middlesex UB2 4BY<br />
Tel: +44 (0)20 85713252<br />
Fax: +44 (0)20 85741716<br />
Email: mail@trs.co.uk
Tw<strong>in</strong> Trad<strong>in</strong>g Ltd.<br />
Third Floor, 1 Curta<strong>in</strong> Road<br />
London EC2A 3LT<br />
Tel: +44 (0) 20 7375 1221<br />
Fax: +44 (0) 20 7375 1337<br />
Email: <strong>in</strong>fo@tw<strong>in</strong>.org.uk<br />
Website: www.tw<strong>in</strong>.org.uk<br />
United Biscuits Food Division/KP<br />
Manufacturer of savoury snack nut<br />
products.<br />
Eastwood Trad<strong>in</strong>g Estate, Fitzwilliam<br />
Rd.<br />
Rotherham, South Yorkshire S65<br />
1TD<br />
Tel: +44 (0)1709 828101<br />
Fax: +44 (0)1709 835912<br />
Website: www.kpnuts.com<br />
Voicevale Ltd<br />
Supplier and distributor of nuts and<br />
dried fruit globally<br />
Dove House, Arcadia Avenue<br />
London N3 2JU<br />
Tel: +44(0)20 8371 3600<br />
Fax:+44(0)20 8371 0208<br />
Website: www.voicevale.com<br />
Netherlands<br />
Aldebaran Commodities B.V.<br />
Maasstraat 17, NL-3001 KB<br />
Rotterdam<br />
Tel: +31-(0)10-436-4900<br />
Fax: +31-(0)10-436-4865<br />
Email: jpvelzen@aldebaran.nl<br />
Alimenta Commodities B.V.,<br />
Golden Peanut Co. LLC<br />
Verkaade 9, NL-3016 Rotterdam<br />
Tel: +31-(0)10-404 4600<br />
Fax: +31-(0)10-411 1319<br />
Bohemia Nut Company B.V.<br />
<strong>West</strong>erstraat 46, NL-3016<br />
Rotterdam<br />
Tel: ++31-(0)412 6099<br />
Fax: ++31-(0)10-412-91 09<br />
Email: <strong>in</strong>fo@bohemianutcomp.nl<br />
F.C. Elfferich Trad<strong>in</strong>g B.V.<br />
Hooipolderweg 8, NL-2635 AZ Den<br />
Hoom<br />
Tel: ++31-15-2511-660<br />
Fax: ++31-214 22 00<br />
Email: elfferich@elfferich.etrade.nl<br />
Handelsveem B.V.<br />
Parmentierple<strong>in</strong> 1, NL-3088 GN<br />
Rotterdam<br />
Tel: ++31-(0)10-487 95 46<br />
Fax: ++31-(0)10-487 95 50<br />
Email:<br />
P.Kommene@NL.Ste<strong>in</strong>weg.com<br />
Jas Trad<strong>in</strong>g B.V.<br />
Haspelslaan 11, NL-1181<br />
AmsTelveen<br />
Tel: ++31-(0)20-643-64 12<br />
Fax: ++31-(0)20-643-21 27<br />
Email: <strong>in</strong>fo@jastrad<strong>in</strong>g.nl<br />
109
The Nut Company B.V.<br />
Bedrijvenpark Ijsseloord 2<br />
Meander 601 6825 ME Arnhem<br />
Tel: ++31 (0) 26 384 0156<br />
Fax: ++31 (0) 26 384 0151<br />
Email: p.bello@thenutcompany.com<br />
Olam Europe B.V.<br />
P.O. Box 29051, NL-3001 GB<br />
Rotterdam<br />
Tel: ++31-10-404 4014<br />
Fax: ++31-10-4044010<br />
Email: rene@olameurope.com<br />
Van Maurik<br />
International peanut broker<br />
“Gravenlust”, Buizenwerf 207, 3063<br />
AE Rotterdam<br />
Tel: +31 (10) 4110716<br />
Fax: +31 (10) 4144170<br />
Email: rikma@wxs.nl<br />
Vebero Eastwood Upgrad<strong>in</strong>g<br />
Blanch<strong>in</strong>g B.V.<br />
Rederijweg 30, NL-4960 Oosterhout<br />
Tel: ++31-(0)162 437 777<br />
Fax: ++31-(0)162-437 711<br />
Email: <strong>in</strong>fo@vebero-eastwood.nl<br />
Germany<br />
H.D. Cotterell<br />
Ellerholzdamm 29-35, D-20457<br />
Hamburg<br />
Tel: ++49-(0)40-3178 7535<br />
Fax: ++49-(0)40-3179 0816<br />
Email: M.Lembke@cotterell.de<br />
110<br />
CSTS Internationale Spedition<br />
Grüner Deich 110, 20097 Hamburg<br />
Tel: ++49-(0)40-23 69 800<br />
Fax: ++49-(0)40-23 19 78<br />
Email: csts@csts.cargol<strong>in</strong>k.de<br />
Eichholtz + Cons. Gmbh<br />
Müggenburger Strasse 7-15, 20539<br />
Hamburg<br />
Tel: +49-(0)40-780946-0<br />
Fax: ++49-(0)40-780946-21<br />
Email: R.Kraupner@Eichholtz.de<br />
Felix The Nut Company Gmbh &<br />
Co. Kg<br />
B<strong>in</strong>nerheide 28, D-58239<br />
Tel: ++49-(0)2304-472 13<br />
Fax: ++49-(0)2304-472 40<br />
Email: burkhard.feldhaus@felix.de<br />
Ernst-Georg Göck Fruchtagentur<br />
GmbH<br />
Elbchaussee 84, D-22763 Hamburg<br />
Tel: ++49-(0)40-32 56 520<br />
Fax: ++49-(0)40-32 65 76<br />
Email: egg@eggoeck.de<br />
Max Kiene GmbH<br />
Oberhafenstraße 1, D-20097<br />
Hamburg<br />
Tel: ++49-(0)40-30 96 550<br />
Fax: ++49-(0)40-30 96 55 20<br />
Email: maxkiene@maxkiene.de<br />
Kunz Consult<strong>in</strong>g<br />
Tannenweg 11, D-59939 Olsberg<br />
Tel: ++49-(0)2962-841 66<br />
Fax: ++49-(0)2962-843 64
The Lorenz Bahlsen Snack-World<br />
GmbH & Co.<br />
Siemensstrasse 10, D-63263 Neu-<br />
Isenburg<br />
Tel: ++49-(0)6102-293 112<br />
Fax: ++49-(0)6102-293 151<br />
Email: Alfred.<br />
Pawlowski@LBSnacks.com<br />
Nuts Consult and Public Relations<br />
Basaltweg 60, D-22395 Hamburg<br />
Tel: ++49-(0)40-602 47 49<br />
Fax: ++49-(0)40-602 97 14<br />
Omnitrade Handelsgesellschaft<br />
Mbh<br />
Große Straße 2, D-22926<br />
Ahrensburg<br />
Tel: ++49-(0)4102-88 620<br />
Fax: ++49-(0)4102-886 288<br />
Email: <strong>in</strong>fo@omnitrade-hamburg.de<br />
Primex Trad<strong>in</strong>g GmbH<br />
Holzbrücke 7, 20450 Hamburg<br />
Tel: ++49-(0)40-36 90 580<br />
Fax: ++49-(0)40-36 90 58 58<br />
Email: primex.hamburg@tonl<strong>in</strong>e.de<br />
Peter Riege<br />
Alter Elbdeich 23, D-21217<br />
Seevetal<br />
Tel: ++49-(0)40-769 21 60<br />
Fax: ++49-(0)6102-293 151<br />
Email: peter.riege@t-onl<strong>in</strong>e.de<br />
Ludger Wehry GmbH<br />
Lärchenweg 5, D-49413 D<strong>in</strong>klage<br />
Tel: ++49-(0)4443-96 320<br />
Fax: ++49-(0)4443-963 220<br />
WEJ GmbH<br />
Stenzelr<strong>in</strong>g 14b, D-21107 Hamburg<br />
Tel: ++49-(0)40-7527 0929<br />
Fax: ++49-(0)40-7527 0920<br />
Email: lothar.boers@wej.de<br />
Switzerland<br />
Alimenta S.A., Golden Peanut<br />
Co.LLC<br />
154 Route de Suisse, CH 1290<br />
Versoix-Génève<br />
Tel: ++41-22-7750 200<br />
Fax: ++41-22-7750 292<br />
Email: tfrangie@alimenta.ch<br />
111
Annexe 9 : Liste d’adresses des Etats-Unis (American<br />
Peanut Council)<br />
From:http://www.peanutsusa.com/<br />
<strong>in</strong>dex.cfm?fuseaction=home.page&pid=9<br />
Index:<br />
Equipment Manufacturers<br />
(Blanchers)<br />
Peanut Butter Process<strong>in</strong>g Equipment<br />
Manufacturers<br />
Roast<strong>in</strong>g Equipment Suppliers<br />
US Peanut Butter Supplier List<br />
US Peanut Processors<br />
US Blanchers<br />
US Broker List<br />
US Shellers<br />
US Manufacturers<br />
Equipment Manufactur<strong>in</strong>g<br />
(Blanchers)<br />
Ashton Food Mach<strong>in</strong>ery Co., Inc.<br />
Neumunz Division<br />
1455 MCCarter Highway<br />
Newark, NJ 07104<br />
USA<br />
Phone: (201) 483-8518<br />
Fax: (201) 483-2756/0200<br />
Blaw-knox Food And Chemical<br />
Equipment Company<br />
P.O. Box 1041<br />
Buffalo, NY 14240<br />
USA<br />
Phone: (716) 895-2100<br />
Fax: (716) 895-8263<br />
112<br />
Krispy Kist Company<br />
120 S. Halsted Street<br />
Dept. 9P<br />
Chicago, IL 60661<br />
USA<br />
Phone: (312) 733-0900<br />
Fax: (312) 733-3508<br />
Wolver<strong>in</strong>e Proctor & Schwartz, Inc.<br />
251 Gibraltar Road<br />
Horsham, PA 19044<br />
USA<br />
Phone: (215) 443-5200<br />
Fax: (215) 443-5206<br />
Website: www.wolver<strong>in</strong>eproctor.com<br />
Peanut Butter Process<strong>in</strong>g<br />
Equipment Manufacturers<br />
Ashton Food Mach<strong>in</strong>ery Company,<br />
Inc.<br />
Neumunz Division<br />
1455 McCarter Highway<br />
Newark, NJ 07104<br />
USA<br />
Phone: (973) 483-8518<br />
Fax: (973) 483-2756/0200<br />
Cantrell International<br />
Division of A.C. Horn<br />
1269 Majesty<br />
Dallas, TX 75247<br />
USA<br />
Phone: (800) 657-6155<br />
Fax: (214) 630-0130
Krispy Kist Company<br />
120 S. Halsted Street<br />
Department 9P<br />
Chicago, IL 60661<br />
USA<br />
Phone: (312) 733-0900<br />
Fax: (312) 733-3508<br />
Union Standard Equipment<br />
Company<br />
801-825 E. 141st Street<br />
Bronx, NY 10454<br />
USA<br />
Phone: (718) 585-0200<br />
Fax: (718) 993-2650<br />
Urschel Laboratories, Inc.<br />
2503 Calumet Road<br />
Valparaiso, IN 46383<br />
USA<br />
Phone: (219) 464-4811<br />
Fax: (219) 462-3879<br />
Wolver<strong>in</strong>e Proctor & Schwartz, Inc.<br />
251 Gibraltar Road<br />
Horsham, PA 19044<br />
USA<br />
Phone: (800) PROCTOR<br />
Fax: (215) 443-5206<br />
Website: www.wolver<strong>in</strong>eproctor.com<br />
Roast<strong>in</strong>g Equipment Suppliers<br />
Ashton Food Mach<strong>in</strong>ery Company, Inc.<br />
Neumunz Division<br />
1455 McCarter Highway<br />
Newark, NJ 07104<br />
USA<br />
Phone: 973-483-8518<br />
Fax: 973-483-2756<br />
contact: Mr. Peter Isler<br />
Blaw-Knox Food and Chemical<br />
Equip. Co.<br />
P.O. Box 1041<br />
Buffalo, NY 14240<br />
USA<br />
Phone: 716-895-2100<br />
contact: Mr. J.P. Newell<br />
Cantrell International<br />
1269 Majesty<br />
Dallas, TX 75247<br />
USA<br />
Phone: 214-630-3311<br />
Fax: 214-630-0130<br />
Heat & Control, Inc.<br />
2111 Cabot Blvd.<br />
Hayward, CA 94545<br />
USA<br />
Phone: (510) 259-0500<br />
Contact: Mr. Don Giles<br />
Krispy Kist Company<br />
120 S. Halsted Street<br />
Dept. 9P<br />
Chicago, IL 60661<br />
USA<br />
Phone: 312-733-0900<br />
Fax: 312-733-3508<br />
113
Specialties Appliance Corp.<br />
715 South 25th Avenue<br />
Bellwood, IL 60104<br />
USA<br />
Phone: 708-544-6500<br />
Fax: 708-544-6505<br />
Contact: Mr. Keith Smith<br />
Wolver<strong>in</strong>e Proctor & Schwartz, Inc.<br />
251 Gibraltar Road<br />
Horsham, PA 19044<br />
USA<br />
Phone: 215-443-5200<br />
Fax: 215-443-5206<br />
Website: www.wolver<strong>in</strong>eproctor.com<br />
Contact: Mr. Chuck Kovacs<br />
Used & Rebuilt Equipment<br />
Dealer:<br />
Madison Equipment Company<br />
2950 <strong>West</strong> Carroll<br />
Chicago, IL 60612<br />
USA<br />
Phone: 312-533-5800<br />
Fax: 312-533-5820<br />
Union Standard Equipment Co.<br />
801-825 E. 141st. Street<br />
Bronx, NY 10454<br />
USA<br />
Phone: 718-585-0200<br />
Fax: 718-993-2650<br />
email: salesla@unionstandard.com<br />
114<br />
US Peanut Butter Supplier List<br />
Cargill Peanut Products<br />
P.O. Box 272<br />
North Ma<strong>in</strong> Street<br />
Dawson, GA 31742<br />
Tel: (912) 995-2111<br />
Fax: (912) 995-3268<br />
Contact: Mike Boyd<br />
*Private Label Processor<br />
The Carriage House Companies, Inc.<br />
196 Newton Street<br />
Fredonia, NY 14063<br />
Tel: (716) 673-1000<br />
Fax: (716) 679-7702<br />
Contact: Mike Hackbarth<br />
*Private Label Processor<br />
Con-agra Grocery Products<br />
3353 Michelson Drive<br />
MS 1-A55<br />
Irv<strong>in</strong>e, CA 92612-0650<br />
USA<br />
Tel: (949) 437-1172<br />
Fax: (949) 437-3339<br />
Contact: Bob Fortmeier<br />
*Maker of Peter Pan Brand<br />
George Wash<strong>in</strong>gton Carver Food<br />
Products, Inc.<br />
420 Williamson Avenue<br />
Peanut Product Division<br />
Opelika, AL 36804<br />
Tel: (334) 741-4100<br />
Fax: (334) 741-4117<br />
Email: gwcfoodprod@msn.com<br />
Contact: R.J. Lewis<br />
*Private Label Processor
J.m. Smucker Company<br />
One Strawberry Lane<br />
P.O. Box 280 Orrville, OH 44667-<br />
0280<br />
Tel: (330) 682-3000<br />
Fax: (330) 684-3115<br />
Website: www.smucker.com<br />
Contact: Gary Rasor<br />
*Maker of Jif and private label<br />
processor<br />
Once Aga<strong>in</strong> Nut Butter, Inc.<br />
12 South State Street<br />
P.O. Box 429 Nunda, NY 14517<br />
Tel: (716) 468-2535<br />
Fax: (716) 468-5995<br />
Contact: Jeremy Thaler<br />
*Private Label Processor<br />
Tara Foods<br />
1900 Cowles Avenue<br />
Albany, GA 31705-1514<br />
Tel: (229) 431-1330<br />
Fax: (229) 439-1458<br />
Contact: Roger Templeton<br />
1014 V<strong>in</strong>e Street<br />
C<strong>in</strong>c<strong>in</strong>nati, OH 45202<br />
Tel: (513) 762-1236<br />
Fax: (513) 762-1342<br />
Contact: Mary Egnor<br />
*Private Label Processor<br />
Unilever Bestfood<br />
Export Division<br />
800 Sylvan Ave<br />
Englewood Cliffs, NJ 07632<br />
USA<br />
Tel: (201) 894-4943<br />
Fax: (201) 894-2702<br />
Contact: Walter Taylor<br />
Universal Blanchers<br />
800 Commerce Drive<br />
Suite 201<br />
Peachtree City, GA 30269<br />
Tel: (770) 487-1230<br />
Fax:(770) 487-3828<br />
Website:<br />
www.universalblanchers.com<br />
Contact: Kev<strong>in</strong> Ga<strong>in</strong>es<br />
Email:<br />
mmckee@universalblanchers.com<br />
US Peanut Processors<br />
Ferrara Pan Candy Company<br />
7301 W. Harrison Street<br />
Forest Park, IL 60130-2083<br />
Tel: (708) 366-0500<br />
Fax: (708) 366-5921<br />
Contact: James S. Buffardi<br />
John B. Sanfilippo & Son, Inc.<br />
2299 Busse Road<br />
Elk Grove Village, IL 60007-0057<br />
Tel: (847) 593-2300<br />
Fax: (847) 593-9608<br />
Website: www.fishernuts.com<br />
Contact: Mike Valent<strong>in</strong>e<br />
Kroger Foods<br />
1014 V<strong>in</strong>e Street<br />
C<strong>in</strong>c<strong>in</strong>nati, OH 45202<br />
Tel: (513) 762-1236<br />
Fax: (513) 762-1342<br />
Contact: Mary Egnor<br />
115
L<strong>in</strong>coln Snacks Company<br />
4 High Ridge Park<br />
Stam<strong>for</strong>d, CT 06905<br />
Tel: (203) 329-4545<br />
Fax: (203) 329-4555<br />
Website: www.l<strong>in</strong>colnsnacks.com<br />
Contact: R. Scott Kirk<br />
Morven Partners, L.p.<br />
P.O. Box 465<br />
Edenton, NC 27932<br />
Tel: (252) 482-2193<br />
Fax: (252) 482-7857<br />
Contact: Hal Burns<br />
Nature Kist Snacks<br />
6909-D Positas Rd.<br />
Livermore, CA 94550<br />
Tel: (925) 606-4200<br />
Fax: (925) 606-7183<br />
Contact: Ron Moz<strong>in</strong>go<br />
Peanut Processors, Inc.<br />
P.O. Box 160<br />
Dubl<strong>in</strong>, NC 28332-0160<br />
Tel: (910) 862-2136<br />
Fax: (910) 862-8076<br />
Contact: Lyn Shaw<br />
Website:<br />
www.peanutprocessors.com<br />
Tom’s Foods, Inc.<br />
900 8th Street<br />
P.O. Box 60<br />
Columbus, GA 31994-0001<br />
Tel: (706) 323-2721<br />
Fax: (706) 596-9772<br />
Contact: Ben Smith<br />
116<br />
Universal Blanchers<br />
800 Commerce Drive<br />
Suite 201<br />
Peachtree City, GA 30269<br />
Tel: (770) 487-1230<br />
Fax:(770) 487-3828<br />
Contact: Kev<strong>in</strong> Ga<strong>in</strong>es<br />
Email:<br />
mmckee@universalblanchers.com<br />
Website: www.universalblanchers.com<br />
US Blanchers<br />
Tidewater Blanch<strong>in</strong>g Corp.<br />
160 County Street<br />
P.O. Box 219<br />
Suffolk, VA 23439-0219<br />
Telephone: (434) 384-7098<br />
Fax: (434) 384-9528<br />
Contact: Jerry D. Canaday<br />
Universal Blanchers<br />
800 Commerce Drive<br />
Suite 201<br />
Peachtree City, GA 30269<br />
Tel: (770) 487-1230<br />
Fax:(770) 487-3828<br />
Contact: Kev<strong>in</strong> Ga<strong>in</strong>es<br />
Email:<br />
mmckee@universalblanchers.com<br />
Website: www.universalblanchers.com
The Cl<strong>in</strong>t Williams Company<br />
Hwy. 199 East (Shipp<strong>in</strong>g)<br />
P.O. Box 310<br />
Madill, OK 73446<br />
Tel: (580) 795-5555<br />
Plant Tel: (580) 795-7368<br />
Fax: (580) 795-5802<br />
Plant Fax: (580) 795-7518<br />
Contact: Alan Ortloff<br />
US Broker List<br />
Ba-com Commodities, Inc.<br />
3500 Virg<strong>in</strong>ia Beach Blvd.<br />
Little Neck Towers<br />
Suite 211<br />
Virg<strong>in</strong>ia Beach, VA 23452<br />
Tel: (757) 631-8775<br />
Fax: (757) 430-3428<br />
Contact: David Bacon<br />
Charles R. Hood Brokerage Co.,<br />
Inc.<br />
P.O. Box 13948<br />
1282 Timberlane Commons, Suite C<br />
Tallahassee, FL 32317<br />
Tel: (850) 668-4996<br />
Fax: (850) 668-3608<br />
E-mail: hoodcr@aol.com<br />
Charles R. Hood, President<br />
Hofler Brokerage, Inc.<br />
124 Clay Street<br />
P.O. Box 1603<br />
Suffolk, VA 23439-1603<br />
Tel: (757) 539-0291<br />
Fax: (757) 539-3291<br />
Thomas Hofler, President<br />
International Service Group<br />
22 Ramsey Street<br />
Suite B<br />
Roswell, GA 30075<br />
(770) 518-0988<br />
(770) 518-0299<br />
Contact: Robert N. Kopec, President<br />
J. R. James Brokerage Company, Inc<br />
P.O. Box 1801<br />
Tel: (912) 888-7395<br />
1208 N. Madison Street<br />
Fax: (912) 888-3738<br />
Albany, GA 31702<br />
Email: i-jrjame@bellsouth.net<br />
Contact: Robert S. Johnson<br />
Lovatt And Rush<strong>in</strong>g, Inc.<br />
6075 The Corners Parkway<br />
Suite 110<br />
Norcross, GA 30092<br />
Tel: (770) 446-1113<br />
Fax: (770) 446-7056<br />
George I. Lovatt<br />
Mazur And Hockman, Inc.<br />
P.O. Box 991<br />
1501 Third Avenue<br />
Albany, GA 31702<br />
Tel: (229) 883-3456<br />
Fax: (229) 883-3525<br />
E-mail: eatpnuts@surfsouth.com<br />
Richard Barnhill<br />
117
O’connor and Company, Inc.<br />
P.O. Box 1679<br />
314 W. Wash<strong>in</strong>gton Street<br />
Suffolk, VA 23439-1679<br />
Tel: (757) 539-0296<br />
Fax: (757) 539-9074<br />
Thomas J. O’Connor, III, President<br />
R.b. Wolff & Company, Inc.<br />
3 Cotesworth Place<br />
Savannah, GA 31411-2876<br />
Tel: (912) 598-0022<br />
Fax: (253) 595-4240<br />
E-mail: ru medium@aol.com<br />
Ronald B. Wolff, President<br />
Sgl International Llc<br />
P.O. Box 720124<br />
6065 Roswell Road<br />
Suite 730 Atlanta, GA 30358-2124<br />
Tel: (404) 252-6887<br />
Fax: (404) 256-4097<br />
Sid Levy, President<br />
US Shellers<br />
Anderson’s Peanuts<br />
A Division of Alabama Farmers<br />
Cooperative, Inc.<br />
603 South Maloy Street<br />
P.O. Drawer 810<br />
Opp, AL 36467-0810<br />
Tel: (334) 493-4591<br />
Fax: (334) 493-7767<br />
Export Contact: John Reed, Sales<br />
Manager<br />
Runner-shelled<br />
118<br />
Birdsong Peanuts<br />
612 Madison Avenue (23434)<br />
P.O. Box 1400<br />
Suffolk, VA 23439<br />
Tel: (757) 539-3456<br />
Fax: (757) 539-7360<br />
E-mail: dperry@ birdsongpeanuts.com<br />
Export Contacts: Warren Birdsong,<br />
Vice President<br />
David Birdsong, Sales Representative<br />
Runner-shelled, Spanish-shelled,<br />
Virg<strong>in</strong>ia-shelled and <strong>in</strong>shell<br />
Borden Peanut Company, Inc.<br />
P.O. Box 28<br />
620 East Lime Street<br />
Portales, NM 88130<br />
Tel: (505) 536-8545<br />
Fax: (505) 359-0072<br />
Export Contact: Bill Owen, Vice<br />
President/General Manager<br />
Valencia-shelled and <strong>in</strong>shell
Golden Peanut Company<br />
Suite 400<br />
100 North Po<strong>in</strong>t Center East<br />
Tel: (770) 752-8200<br />
Fax: (770) 752-8306<br />
Alpharetta, GA 30022<br />
Website: www.goldenpeanut.com<br />
Export Contacts: Alexandre<br />
Izmirlian, Vice President,<br />
International Sales<br />
Jean-Paul Bodourian, Vice-President,<br />
Export Sales<br />
Runner-shelled, Spanish-shelled,<br />
Virg<strong>in</strong>ia-shelled and <strong>in</strong>shell, blanched<br />
peanuts<br />
Export Contacts <strong>for</strong> Specialty<br />
Products:<br />
Bruce Kotz, Manager, Specialty<br />
Products<br />
Processed peanuts, peanut butter,<br />
flour, oil<br />
Lee County Peanut Company, Inc.<br />
136 South Caldwell<br />
Gidd<strong>in</strong>gs, TX 78942<br />
Tel: (979) 542-3453<br />
Fax: (979) 542-0991<br />
Website: www.alphal.net/~lcpnuts<br />
Export Contact: Jonathan Socha,<br />
President<br />
Spanish-shelled<br />
McCleskey Mills, Inc. P.o.<br />
Box 98<br />
Highway 118 <strong>West</strong><br />
Smithville, GA 31787<br />
Tel: (229) 846-2003<br />
Fax: (229) 846-4805<br />
Export Contact: Jerry M. Chandler,<br />
President<br />
Runner-shelled<br />
Morven Partners, L.p.<br />
Edenton Division<br />
P.O. Box 465<br />
Edenton, NC 27932<br />
Tel: (252) 482-2193<br />
Fax: (252) 482-7857<br />
Export Contact: Hal Burns, Vice<br />
President, In-shell Group<br />
Runner-shelled, Virg<strong>in</strong>ia-shelled and<br />
<strong>in</strong>shell, blanched peanuts, processed<br />
peanuts <strong>in</strong>clud<strong>in</strong>g salted <strong>in</strong>shell<br />
Reeves Peanut Company<br />
340 East Broad Street<br />
P.O. Box 565<br />
Eufaula, AL 36072-0565<br />
Tel: (334) 687-2756<br />
Fax: (334) 687-9126<br />
Website: www.mr-macs-peanuts.com<br />
Export Contact: Ben C. Reeves,<br />
President<br />
Runner-shelled<br />
119
Sessions Company, Inc.<br />
P.O. Box 31-1310<br />
801 N. Ma<strong>in</strong> Street (36330)<br />
Enterprise, AL 36331-1310<br />
Tel: (334) 393-0200<br />
Fax: (334) 393-0240<br />
E-mail: pnutsouth @aol.com<br />
Website: www.peanutsouth.com<br />
Export Contact: William T. Ventress,<br />
Jr., President<br />
Shelled peanuts<br />
Severn Peanut Company, Inc.<br />
P.O. Box 710<br />
Severn, NC 27877<br />
Tel: (252) 585-0838<br />
Fax: (252) 585-1718<br />
Export Contact: Carl Gray, Jr.,<br />
Secretary-Treasurer, Sales<br />
Virg<strong>in</strong>ia-shelled and <strong>in</strong>shell<br />
Tom’s Foods, Inc.<br />
900 8TH Street<br />
P.O. Box 60<br />
Columbus, GA 31994-0001<br />
Tel: (706) 323-2721<br />
Fax: (706) 596-9772<br />
Export Contact: Ben Smith,<br />
Manager, Peanut Operations<br />
Runner-shelled<br />
120<br />
Wilco Peanut Company<br />
P.O. Drawer B<br />
Highway 281 North (Physical)<br />
Pleasanton, TX 78064-0060<br />
Tel: (830) 569-3808<br />
Fax: (830) 569-2743<br />
Export Contact: Byron Warnken,<br />
President<br />
Runner-shelled, Spanish-shelled<br />
Cl<strong>in</strong>t Williams Company<br />
A Division of Texoma Peanut<br />
Company<br />
433 East Ma<strong>in</strong> Street<br />
P.O. Box 310<br />
Madill, OK 73446-0310<br />
Tel: (580) 795-5555<br />
Plant Tel: (580) 795-7368<br />
Fax: (580) 795-5802<br />
Plant Fax: (580) 795-7518<br />
Export Contact: Jim Bull, Operations<br />
Coord<strong>in</strong>ator & Sales Manager<br />
Runner-shelled, Spanish-shelled,<br />
Virg<strong>in</strong>ia-shelled and <strong>in</strong>shell, Valenciashelled<br />
and <strong>in</strong>shell, blanched peanuts<br />
US Manufacturers<br />
The Carriage House Companies, Inc.<br />
196 Newton Street<br />
Fredonia, NY 14063<br />
Tel: (716) 673-1000<br />
Fax: (716) 679-7702<br />
Mark M. Miller, Director of<br />
Purchas<strong>in</strong>g
Ferrara Pan Candy Company<br />
7301 W. Harrison Street<br />
Forest Park, IL 60130-2083<br />
Tel: (708) 366-0500<br />
Fax: (708) 366-5921<br />
James S. Buffardi, Secretary/Chief<br />
F<strong>in</strong>ancial Officer<br />
Hershey Foods Corporation<br />
P.O. Box 810<br />
100 Crystal A Drive<br />
Hershey, PA 17033<br />
Tel: (717) 534-6675<br />
Fax: (717) 534-7754<br />
Dick Barnoski, Manager, Nut<br />
Procurement<br />
Con-agra Grocery Products<br />
3353 Michelson Drive<br />
MS 1-A55<br />
Irv<strong>in</strong>e, CA 92612-0650<br />
USA<br />
Tel: (949) 437-1172<br />
Fax: (949) 437-3339<br />
Contact: Bob Fortmeier<br />
*Maker of Peter Pan Brand<br />
J.m. Smucker Company<br />
Corporate Headquarters of H.B.<br />
Dev<strong>in</strong>ey Co., Inc.<br />
One Strawberry Lane<br />
P.O. Box 280<br />
Orrville, OH 44667-0280<br />
Tel: (330) 682-3000<br />
Fax: (330) 684-3115<br />
Website: www.smucker.com<br />
Gary Rasor, Director, Corporate<br />
Purchas<strong>in</strong>g<br />
John B. Sanfilippo & Son, Inc.<br />
2299 Busse Road<br />
Elk Grove Village, IL 60007-0057<br />
Tel: (847) 593-2300<br />
Fax: (847) 593-9608<br />
Website: www.fishernuts.com<br />
Mike Valent<strong>in</strong>e<br />
Kraft Foods Inc. Snacks Division<br />
200 DeForest Avenue<br />
P.O. Box 1944<br />
East Hanover, NJ 07936-1944<br />
Tel: (973) 501-4788<br />
Fax: (973) 503-2399<br />
Website: www.nabisco.com<br />
Doug Smyth<br />
Masteroods USA<br />
P. O. Box 3289<br />
1209 <strong>West</strong> Oakridge Drive<br />
Tel: (229) 434-4807<br />
Fax: (229) 434-4812<br />
Albany, GA 31706-3289<br />
Website: www.m-ms.com<br />
Charles Ivy, Commodity Purchas<strong>in</strong>g<br />
Manager<br />
Nestle USA<br />
Chocolate & Confections Division<br />
800 North Brand Boulevard<br />
6th Floor<br />
Glendale, CA 91203<br />
Tel: (818) 549-5033<br />
Fax: (818) 543-7952<br />
Website: www.nestle.com<br />
Charles Stelmokas, Vice President,<br />
Supply Cha<strong>in</strong><br />
121
Tara Foods<br />
A Division of the Kroger Company<br />
1900 Cowles Avenue<br />
Albany, GA 31705-1514<br />
Tel: (229) 431-1330<br />
Fax: (229) 439-1458<br />
Richard Barnhill, General Manager<br />
Tom’s Foods, Inc.<br />
900 8th Street<br />
P.O. Box 60<br />
Columbus, GA 31994-0001<br />
Tel: (706) 323-2721<br />
122
Référence: BR Ntare, F Waliyar, M Ramouch, E Masters et J Ndjeunga, éds. 2005.<br />
Opportunités Commerciales de l’Arachide en Afrique de l’Ouest. CFC Document<br />
Technique du FCPB N° 39. PO Box 74656, 1070 BR Amsterdam, The Netherlands:<br />
Fonds Commun pour les Produits de Base; et Patancheru, Inde: Institut <strong>in</strong>ternational<br />
de recherche sur les cultures des zones tropicales semi-arides. 252 pp.