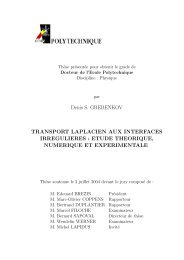
14multiplication. The variation of A Ep obtained from thecalculated values of E + M and E− Mis plotted in Fig.11. Below100eV injection <strong>en</strong>ergy, A Ep is almost constant andclose to 0.5. Beyond 100eV, A Ep <strong>de</strong>creases very slowly:over the <strong>en</strong>tire probed <strong>en</strong>ergy range, the value of A Epranges from 0.25 to 0.5. Note that, if minority-spin pri-For the evaluation of A p (ε), we use Eqs.(31) and (32).Fig.12(a) shows the variation of A p (ε) for three values ofthe mean <strong>en</strong>ergy E M :0.15eV, 0.45eV and 0.9eV, whichcorrespond to three differ<strong>en</strong>t values of the injection <strong>en</strong>ergy.The positions of the two barrier heights are indicatedby vertical dotted lines. It is clear that for smallvalues of the mean <strong>en</strong>ergy E M , A p (ε) maybeconsi<strong>de</strong>redas constant and equal to unity for both contributionsto the transmission, above φ SC . and above φ Ox .But for higher values of E M , A p (ε) cannot be tak<strong>en</strong> asequal to 1 above φ SC . As a consequ<strong>en</strong>ce, the spin <strong>de</strong>p<strong>en</strong>d<strong>en</strong>ttransmission should t<strong>en</strong>d to <strong>de</strong>crease. The plot of(ε/EM A p (ε) − 2A Ep)f (ε) for the same three values ofE M(Fig.12(b)) clearly shows that, the spin-<strong>de</strong>p<strong>en</strong>d<strong>en</strong>ttransmission above φ SC should ev<strong>en</strong> become negativewh<strong>en</strong> E M increases.FIG. 11: Variation of A Ep =(E + M − E− M )/(E+ M + E− M), thespin-asymmetry of the electron mean-<strong>en</strong>ergy and of the ratio(E + M + E− M)/2EM with injection <strong>en</strong>ergy E0. These quantitiesare obtained from the variation of E M , E + M and E− M whichhave be<strong>en</strong> in<strong>de</strong>p<strong>en</strong>d<strong>en</strong>tly calculated as <strong><strong>de</strong>s</strong>cribed in Sec.III.A.2using respectively λ(ε), λ + and λ − for the variation of theelectron mean-free-path versus <strong>en</strong>ergy.mary electrons had, in average, one more collision thanmajority-spin primary electrons, the spin-asymmetry ofthe primary electron mean <strong>en</strong>ergy would be equal to 2/3.FIG. 12: Variation with electron <strong>en</strong>ergy (a) of A p(ε), thespin[asymmetry of]the electron distribution, and (b) ofA p(ε) εE M− 2A Ep f(ε) the argum<strong>en</strong>t of the integral in theexpression of ΔT [Eqs.(29 and (B2]. Three calculated curvesare shown corresponding to three differ<strong>en</strong>t values of the electronmean <strong>en</strong>ergy E M (0.15eV, 0.45eV, and 0.9eV) at themetal/oxi<strong>de</strong> interface. The two vertical dotted lines indicatethe positions of the two barrier heights φ SC and φ Ox.
15∗ Electronic address: Yves.Lassailly@polytechnique.edu1 J. Unguris, D. T. Pierce, A. Galejs, and R. J. Celotta,Physical Review Letters 49, 72 (1982).2 E. Kisker, W. Gudat, and K. Schro<strong>de</strong>r, Solid State Communications44, 591 (1982).3 H. Hopster, R. Raue, E. Kisker, G. Guntherodt, andM. Campagna, Physical Review Letters 50, 70 (1983).4 D. R. P<strong>en</strong>n, S. P. Apell, and S. M. Girvin, Physical ReviewB 32, 7753 (1985).5 D. P. Pappas, K. P. Kamper, B. P. Miller, H. Hopster,D. E. Fowler, C. R. Brundle, A. C. Luntz, and Z. X. Sh<strong>en</strong>,Physical Review Letters 66, 504 (1991).6 M. Getzlaff, J. Bansmann, and G. Schonh<strong>en</strong>se, Solid StateCommunications 87, 467 (1993).7 G. Schonh<strong>en</strong>se and H. C. Siegmann, Annal<strong>en</strong> Der Physik2, 465 (1993).8 E. Vescovo, C. Carbone, U. Alkemper, O. Ra<strong>de</strong>r,T. Kachel, W. Gudat, and W. Eberhardt, Physical ReviewB 52, 13497 (1995).9 Y. Lassailly, H. J. Drouhin, A. J. Van<strong>de</strong>rsluijs, G. Lampel,and C. Marliere, Physical Review B 50, 13054 (1994).10 A. van <strong>de</strong>r Sluijs, Ph.D. thesis, Ecole Polytechnique (1996).11 J. C. Grobli, D. Guarisco, S. Frank, and F. Meier, PhysicalReview B 51, 2945 (1995).12 H. J. Drouhin, A. J. van<strong>de</strong>rSluijs, Y. Lassailly, andG. Lampel, Journal Of Applied Physics 79, 4734 (1996).13 D. Oberli, R. Burgermeister, S. Ries<strong>en</strong>, W. Weber, andH. C. Siegmann, Physical Review Letters 81, 4228 (1998).14 C. Cacho, Y. Lassailly, H. J. Drouhin, G. Lampel, andJ. Peretti, Physical Review Letters 88, 066601 (2002).15 D. J. Monsma, J. C. Lod<strong>de</strong>r, T. J. A. Popma, and B. Di<strong>en</strong>y,Physical Review Letters 74, 5260 (1995).16 T. Kinno, K. Tanaka, and K. Mizushima, Physical ReviewB 56, R4391 (1997).17 P. N. First, J. A. Bonetti, D. K. Guthrie, L. E. Harrell,and S. S. P. Parkin, Journal Of Applied Physics 81, 5533(1997).18 A. Filipe, H. J. Drouhin, G. Lampel, Y. Lassailly, J. Nagle,J. Peretti, V. I. Safarov, and A. Schuhl, Physical ReviewLetters 80, 2425 (1998).19 W. H. Rip<strong>par</strong>d and R. A. Buhrman, Applied Physics Letters75, 1001 (1999).20 S. van Dijk<strong>en</strong>, X. Jiang, and S. S. P. Parkin, AppliedPhysics Letters 83, 951 (2003).21 X. Jiang, S. van Dijk<strong>en</strong>, R. Wang, and S. S. P. Parkin,Physical Review B 69, 014413 (2004).22 N. Rougemaille, H.-J. Drouhin, G. Lampel, Y. Lassailly,J. Peretti, T. Wirth, and A. Schuhl, AIP Confer<strong>en</strong>ce Proceedings675, 1001 (2003).23 A. Filipe and A. Schuhl, Journal Of Applied Physics 81,4359 (1997).24 A. Filipe, Ph.D. thesis, Ecole Polytechnique (1997).25 D. Lamine, Ph.D. thesis, Ecole Polytechnique (2007).26 As discussed in Refs.24 − 25, the oxi<strong>de</strong> layer formed onGaAs is most probably Ga 2O 3. The value of the oxi<strong>de</strong>band gap measured on our samples is of about 4.6eV (seeRef.25). This is com<strong>par</strong>able with the values betwe<strong>en</strong> 4eVand 5.2eV that can be found in the literature for the bandgap of various gallium oxi<strong><strong>de</strong>s</strong> : see for instance, M. Passlak,E. F. Schubert, W. S. Hobson, M. Hong, N. Moriya,S. N. G. Chu, K. Konstadinidis, J. P. Mannaerts, M. L.Schnoes, and G. J. Zydzik, J. Appl. Phys. 77, 686 (1995);Z. Ji, J. Du, J. Fan, and W. Wang, Optical Materials 28,415 (2006).27 M. P. Seah and C. P. Hunt, Surface And Interface Analysis5, 33 (1983).28 It is sometimes consi<strong>de</strong>red that the primary and secondaryelectron distributions have id<strong>en</strong>tical shapes. This wouldonly be the case if all the electrons had the same number ofcollisions along the transport whatever their final emerging<strong>en</strong>ergy (like in a thermalized electron distribution). Thisis not the case here and we consi<strong>de</strong>r that the number ofcollisions n that an electron un<strong>de</strong>rgoes during the transportacross the metal layer <strong>de</strong>p<strong>en</strong>ds on its exit <strong>en</strong>ergy ε.This assumption seems reasonable since, for instance, itis clear that electrons transmitted at the injection <strong>en</strong>ergyE 0 (i.e. with no <strong>en</strong>ergy loss) had no collision while electronstransmitted with an <strong>en</strong>ergy very close to the barrierheight have certainly suffered in average many collisions.Th<strong>en</strong>, according to the <strong>en</strong>ergy relaxation equation that wehave used [Eq.(5)], we obtain n (ε) =Ln (E 0/ε) /Ln (2).Consequ<strong>en</strong>tly, at <strong>en</strong>ergy ε, the ratio of the total number ofelectrons (primaries and secondaries together) to the numberof primary electrons is F (ε) /f p (ε) =2 n(ε) = E 0/ε.29 In the configuration of the pres<strong>en</strong>t experim<strong>en</strong>t, we can onlymeasure the transmission asymmetry related to the primaryelectron polarization. Therefore, the polarization ofthe secondary electrons can not be evid<strong>en</strong>ced since its ori<strong>en</strong>tationis <strong>de</strong>termined by that of the magnetic layer magnetizationand not by the primary electron polarization.To evid<strong>en</strong>ce the spin-filtering of secondary electrons oneshould either use a spin-valve structure or measure the polarizationof the transmitted electrons.
- Page 3 and 4:
RésuméDRISS LAMINEEffet de filtre
- Page 5 and 6:
AbstractDRISS LAMINESpin filter eff
- Page 7 and 8:
RemerciementsRemerciementsJ’ai r
- Page 9 and 10:
Table des matièresTABLE DES MATIER
- Page 11 and 12:
Table des matières4.A. Notion de r
- Page 13 and 14:
PréambuleChapitre IPréambuleL’u
- Page 15 and 16:
PréambuleRougemaille03 : Rougemail
- Page 17 and 18:
Chapitre II - Concepts généraux a
- Page 19 and 20:
Chapitre II - Concepts généraux a
- Page 21:
Chapitre II - Concepts généraux a
- Page 24 and 25:
Chapitre II - Concepts généraux a
- Page 26 and 27:
Chapitre II - Concepts généraux a
- Page 28 and 29:
Chapitre II - Concepts généraux a
- Page 30 and 31:
Chapitre II - Concepts généraux a
- Page 32 and 33:
Chapitre II - Concepts généraux a
- Page 34 and 35:
Chapitre II - Concepts généraux a
- Page 36 and 37:
Chapitre II - Concepts généraux a
- Page 38 and 39:
Chapitre II - Concepts généraux a
- Page 40 and 41:
Chapitre II - Concepts généraux a
- Page 42 and 43:
Chapitre II - Concepts généraux a
- Page 44 and 45:
Chapitre II - Concepts généraux a
- Page 46 and 47:
Chapitre II - Concepts généraux a
- Page 48 and 49:
Chapitre II - Concepts généraux a
- Page 50 and 51:
Chapitre III - Réalisation et cara
- Page 52 and 53:
Chapitre III - Réalisation et cara
- Page 54 and 55:
Chapitre III - Réalisation et cara
- Page 56 and 57:
Chapitre III - Réalisation et cara
- Page 58 and 59:
Chapitre III - Réalisation et cara
- Page 60 and 61:
Chapitre III - Réalisation et cara
- Page 62 and 63:
Chapitre III - Réalisation et cara
- Page 64 and 65:
Chapitre III - Réalisation et cara
- Page 66 and 67:
Chapitre III - Réalisation et cara
- Page 68 and 69:
Chapitre III - Réalisation et cara
- Page 70 and 71:
Chapitre III - Réalisation et cara
- Page 72 and 73:
Chapitre III - Réalisation et cara
- Page 74 and 75:
Chapitre III - Réalisation et cara
- Page 76 and 77:
Chapitre III - Réalisation et cara
- Page 78 and 79:
Chapitre IV - Réalisation d’un t
- Page 80 and 81:
Chapitre IV - Réalisation d’un t
- Page 82 and 83:
Chapitre IV - Réalisation d’un t
- Page 84 and 85:
Chapitre IV - Réalisation d’un t
- Page 86 and 87:
Chapitre IV - Réalisation d’un t
- Page 88 and 89:
Chapitre IV - Réalisation d’un t
- Page 90 and 91:
Chapitre IV - Réalisation d’un t
- Page 92 and 93:
Chapitre IV - Réalisation d’un t
- Page 94 and 95:
Chapitre IV - Réalisation d’un t
- Page 96 and 97:
Chapitre IV - Réalisation d’un t
- Page 98 and 99:
Chapitre IV - Réalisation d’un t
- Page 100 and 101:
Chapitre IV - Réalisation d’un t
- Page 102 and 103:
Chapitre IV - Réalisation d’un t
- Page 104 and 105:
Chapitre IV - Réalisation d’un t
- Page 106 and 107:
Chapitre IV - Réalisation d’un t
- Page 108 and 109:
Chapitre IV - Réalisation d’un t
- Page 110 and 111:
Chapitre IV - Réalisation d’un t
- Page 112 and 113:
Chapitre IV - Réalisation d’un t
- Page 114 and 115:
Chapitre IV - Réalisation d’un t
- Page 116 and 117:
Chapitre IV - Réalisation d’un t
- Page 118 and 119:
Chapitre IV - Réalisation d’un t
- Page 120 and 121:
Chapitre IV - Réalisation d’un t
- Page 122 and 123:
Chapitre V - Modélisation du trans
- Page 124 and 125:
Chapitre V - Modélisation du trans
- Page 126 and 127:
Chapitre V - Modélisation du trans
- Page 128 and 129:
Chapitre V - Modélisation du trans
- Page 130 and 131:
Chapitre V - Modélisation du trans
- Page 132 and 133:
Chapitre V - Modélisation du trans
- Page 134 and 135:
Chapitre V - Modélisation du trans
- Page 136 and 137:
Chapitre V - Modélisation du trans
- Page 138 and 139:
Chapitre V - Modélisation du trans
- Page 140 and 141:
Chapitre V - Modélisation du trans
- Page 142 and 143: Chapitre V - Modélisation du trans
- Page 144 and 145: Chapitre V - Modélisation du trans
- Page 146 and 147: Chapitre V - Modélisation du trans
- Page 148 and 149: Chapitre V - Modélisation du trans
- Page 150 and 151: Chapitre V - Modélisation du trans
- Page 152 and 153: Chapitre V - Modélisation du trans
- Page 154 and 155: Chapitre V - Modélisation du trans
- Page 156 and 157: Chapitre V - Modélisation du trans
- Page 158 and 159: Chapitre V - Modélisation du trans
- Page 160 and 161: Chapitre V - Modélisation du trans
- Page 162 and 163: Chapitre V - Modélisation du trans
- Page 164 and 165: Chapitre V - Modélisation du trans
- Page 166 and 167: Conclusion et perspectivesFig.VI.1
- Page 168 and 169: 156Conclusion et perspectives
- Page 170 and 171: BibliographieHopster83 : Hopster et
- Page 172 and 173: BibliographieWeber01 : Weber W. et
- Page 174 and 175: BibliographiePierce75 :Pierce D.T e
- Page 176 and 177: 164Bibliographie
- Page 178 and 179: 166
- Page 180 and 181: 2ing spin-polarized electrons decre
- Page 182 and 183: 4sample potential. The variations o
- Page 184 and 185: 6component v l , and an electron of
- Page 186 and 187: secondary electrons. Because of the
- Page 188 and 189: 10energy is due to the increasing p
- Page 190 and 191: 12APPENDIX A: VARIATION OF THE ELEC
- Page 194: 182


![[Diffusion-Limited Aggregation - A Model for Pattern Formation].](https://img.yumpu.com/52395246/1/190x245/diffusion-limited-aggregation-a-model-for-pattern-formation.jpg?quality=85)