Miller & Levine Biology: Foundation Edition - Pearson
Miller & Levine Biology: Foundation Edition - Pearson
Miller & Levine Biology: Foundation Edition - Pearson
Create successful ePaper yourself
Turn your PDF publications into a flip-book with our unique Google optimized e-Paper software.
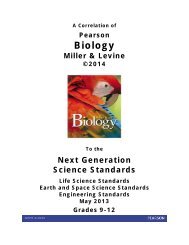
A Correlation of<strong>Miller</strong> & <strong>Levine</strong> <strong>Biology</strong>, <strong>Foundation</strong> <strong>Edition</strong>, ©2014to the Next Generation Science Standards, May 2013Grades 9-12HS-LS2 Ecosystems: Interactions, Energy, and DynamicsHS-LS2 Ecosystems: Interactions, Energy, and DynamicsStudents who demonstrate understanding can:HS-LS2-1. Use mathematical and/or computational representations to support explanations of factors that affect carryingcapacity of ecosystems at different scales. [Clarification Statement: Emphasis is on quantitative analysis and comparison of the relationships amonginterdependent factors including boundaries, resources, climate, and competition. Examples of mathematical comparisons could include graphs, charts, histograms, and populationchanges gathered from simulations or historical data sets.] [Assessment Boundary: Assessment does not include deriving mathematical equations to make comparisons.]MILLER & LEVINE BIOLOGY, <strong>Foundation</strong> <strong>Edition</strong>: The concept of carrying capacity is introduced in Lesson 5.1 (p. 111). Students learnabout factors that affect population growth, such as competition and predation, in Lesson 5.2 (pp. 112–116). Lesson 5.3 (pp. 117–119)provides a historical overview of human population growth and explains how to use age-structure diagrams to analyze population growth.Students use mathematics and computational representations to explain factors that affect carrying capacity: Students identify thegeneral trends in a graph of moose and wolf populations and the factors that affect the size of the populations (TE p. 113). Students explainhow the size of a population can continue to grow as its rate of growth decreases (Q1, p. 121). Students use a table of world populationmilestones to identify a trend in population growth (Q16, p. 124).HS-LS2-2. Use mathematical representations to support and revise explanations based on evidence about factors affectingbiodiversity and populations in ecosystems of different scales. [Clarification Statement: Examples of mathematical representations include finding theaverage, determining trends, and using graphical comparisons of multiple sets of data.] [Assessment Boundary: Assessment is limited to provided data.]MILLER & LEVINE BIOLOGY, <strong>Foundation</strong> <strong>Edition</strong>: Population size is addressed throughout Chapter 5 (pp. 108–119). The concept ofbiodiversity is addressed in Lesson 6.3 (pp. 138–142).Students use mathematics and computational representations to explain factors that affect biodiversity: Students use a graph toexplain the decline of fish populations in the North Atlantic (p. 146). Students learn how to calculate a biodiversity index (Chapter 6 DataAnalysis, Analyzing Biodiversity).HS-LS2-3. Construct and revise an explanation based on evidence for the cycling of matter and flow of energy in aerobic andanaerobic conditions. [Clarification Statement: Emphasis is on conceptual understanding of the role of aerobic and anaerobic respiration in different environments.][Assessment Boundary: Assessment does not include the specific chemical processes of either aerobic or anaerobic respiration.]MILLER & LEVINE BIOLOGY, <strong>Foundation</strong> <strong>Edition</strong>: Students are introduced to autotrophs and heterotrophs as they study therelationship between consumers and producers in Lesson 3.2 (pp. 60–61). The interdependence of these categories of organisms isreinforced in Lesson 8.1 (pp. 192–194) and Lesson 9.1 (pp. 212–215). Lesson 21.3 (pp. 509–513) provides a detailed comparison ofautotrophic protests and heterotrophic protests.Students construct an explanation based on evidence for how matter and energy are cycled in aerobic and anaerobic conditions:Students explain how whales are able to stay underwater for up to 45 minutes (Chapter Mystery, pp. 211 and 230).HS-LS2-4. Use mathematical representations to support claims for the cycling of matter and flow of energy amongorganisms in an ecosystem. [Clarification Statement: Emphasis is on using a mathematical model of stored energy in biomass to describe the transfer of energy from onetrophic level to another and that matter and energy are conserved as matter cycles and energy flows through ecosystems. Emphasis is on atoms and molecules such as carbon,oxygen, hydrogen and nitrogen being conserved as they move through an ecosystem.] [Assessment Boundary: Assessment is limited to proportional reasoning to describe the cyclingof matter and flow of energy.]MILLER & LEVINE BIOLOGY, <strong>Foundation</strong> <strong>Edition</strong>: The concept of energy transfer between organisms is introduced in Lesson 3.2 (pp.60–62). Lesson 3.3 (pp. 63–67) describes food chains and food webs. Students also learn about pyramids of energy and biomass. Cycles ofmatter are addressed in Lesson 3.4 (pp. 68–73).Students use mathematical representations to support claims for the cycling of energy and matter: Students calculate the energyavailable at each level in a pyramid of energy (Inquiry into Scientific Thinking, p. 66). Students use a food web to calculate the percentageof energy originally captured by primary producers that is available to specific consumers (Q2, p. 75). Students use a graph to explore theeffect of rainfall on plant tissue productivity (Q16 and Q17, p. 78).SE = Student <strong>Edition</strong>; TE = Teacher’s <strong>Edition</strong>; LMB = Lab Manual B 8


