Miller & Levine Biology: Foundation Edition - Pearson
Miller & Levine Biology: Foundation Edition - Pearson
Miller & Levine Biology: Foundation Edition - Pearson

You also want an ePaper? Increase the reach of your titles
YUMPU automatically turns print PDFs into web optimized ePapers that Google loves.
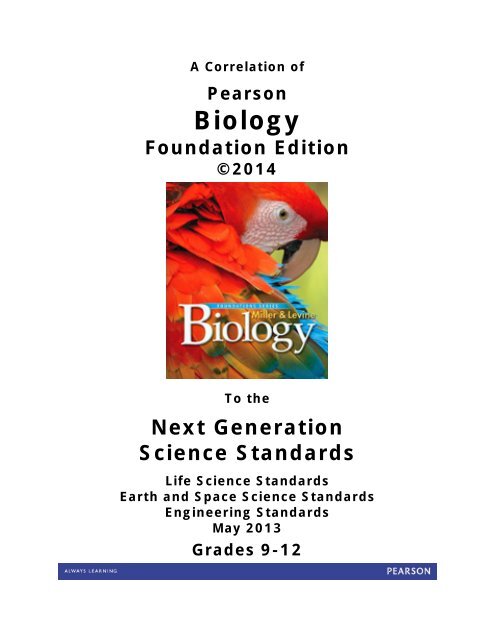
A Correlation of<strong>Pearson</strong><strong>Biology</strong><strong>Foundation</strong> <strong>Edition</strong>©2014To theNext GenerationScience StandardsLife Science StandardsEarth and Space Science StandardsEngineering StandardsMay 2013Grades 9-12
A Correlation of<strong>Miller</strong> & <strong>Levine</strong> <strong>Biology</strong>, <strong>Foundation</strong> <strong>Edition</strong>, ©2014to the Next Generation Science Standards, May 2013Grades 9-12Dear Educator,<strong>Pearson</strong> is committed to offering its complete support as classrooms transition to the new NextGeneration Science Standards.* Ready-to-use solutions for today and a forward-thinking plan fortomorrow connect teacher education and development; curriculum content and instruction; andassessment. We’ll be here every step of the way to provide the easiest possible transition to the NextGeneration Science Standards with a coherent, phased approach to implementation.The planning and development of <strong>Pearson</strong>’s <strong>Miller</strong> & <strong>Levine</strong> <strong>Biology</strong> was informed by the samefoundational research as A Framework for K–12 Science Education: Practices, Crosscutting Concepts,and Core Ideas. Specifically, our development team used Project 2061, the National Science EducationStandards (1996) developed by the National Research Council, as well as the Science Anchors Project2009 developed by the National Science Teachers Association. As a result, students make connectionsthroughout the program to concepts that cross disciplines; practice science and engineering skills; andbuild on their core science ideas.Authors Ken <strong>Miller</strong> and Joe <strong>Levine</strong> have created a bold, comprehensive on-level program to inspirestudents with both fundamental and cutting edge biology content. The authors’ unique storytellingstyle, with a greater focus on written and visual analogies, engages students in biology.Study Workbook A and Laboratory Manual A offer leveled activities for students of varyingabilities. Teachers can choose to differentiate activities within a classroom or choose an activity thatbest fits the whole class profile.<strong>Miller</strong> & <strong>Levine</strong> <strong>Biology</strong>: <strong>Foundation</strong> <strong>Edition</strong>, Study Workbook B, and Laboratory Manual B arethe options for below-level students. These items have additional embedded reading support to helpstudents master key biology concepts.<strong>Biology</strong>.com, the latest in digital instruction technology, provides a pedagogically relevant interfacefor your biology classroom. Complete Student <strong>Foundation</strong> <strong>Edition</strong> online with audio Complete Teacher’s <strong>Foundation</strong> <strong>Edition</strong> Untamed Science videos (also on DVD) Lesson review presentations Editable worksheets Test preparation, online assessments, and remediation Interactive features and simulations Chapter mysteries from the textbook Interactive study guides Virtual Labs STEM activities with worksheetsThe following document demonstrates how <strong>Miller</strong> & <strong>Levine</strong> <strong>Biology</strong>, <strong>Foundation</strong> <strong>Edition</strong>, ©2014,is compatible with the Next Generation Science Standards for Grades 9-12. Correlation references areto the Student <strong>Edition</strong>, Teacher <strong>Edition</strong>, Laboratory Manual B, and <strong>Biology</strong>.com. (See the correlationfor the on-level version of <strong>Miller</strong> & <strong>Levine</strong> <strong>Biology</strong> for additional assessment questions and strategiesthat are compatible with the Next Generation Science Standards.)*Next Generation Science Standards is a registered trademark of Achieve. Neither Achieve nor the lead states and partners that developedthe Next Generation Science Standards was involved in the production of, and does not endorse, this product.SE = Student <strong>Edition</strong>; TE = Teacher’s <strong>Edition</strong>; LMB = Lab Manual B 2
A Correlation of<strong>Miller</strong> & <strong>Levine</strong> <strong>Biology</strong>, <strong>Foundation</strong> <strong>Edition</strong>, ©2014to the Next Generation Science Standards, May 2013Grades 9-12Table of ContentsHS-LS1 From Molecules to Organisms: Structures and Processes 4HS-LS2 Ecosystems: Interactions, Energy, and Dynamics 8HS-LS3 Heredity: Inheritance and Variation of Traits 13HS-LS4 Biological Evolution: Unity and Diversity 15HS-ESS2 Earth’s Systems 19HS-ESS3 Earth and Human Activity 21HS-ETS1 Engineering Design 24SE = Student <strong>Edition</strong>; TE = Teacher’s <strong>Edition</strong>; LMB = Lab Manual B 3
A Correlation of<strong>Miller</strong> & <strong>Levine</strong> <strong>Biology</strong>, <strong>Foundation</strong> <strong>Edition</strong>, ©2014to the Next Generation Science Standards, May 2013Grades 9-12HS-LS1-5. Use a model to illustrate how photosynthesis transforms light energy into stored chemical energy. [ClarificationStatement: Emphasis is on illustrating inputs and outputs of matter and the transfer and transformation of energy in photosynthesis by plants and other photosynthesizing organisms.Examples of models could include diagrams, chemical equations, and conceptual models.] [Assessment Boundary: Assessment does not include specific biochemical steps.]MILLER & LEVINE BIOLOGY, <strong>Foundation</strong> <strong>Edition</strong>: The term photosynthesis is defined in Lesson 8.1 (p. 194). Lesson 8.2 (pp. 195–197)presents an overview of the process of photosynthesis. Lesson 8.3 (pp. 199–203) provides details about the light-dependent and lightindependentsets of reactions.Representative examples of how students use a model to illustrate the conversion of light energy into chemical energy duringphotosynthesis: Students use a visual model to determine what happens to the ATP and NADPH produced during the light-dependentreactions (TE p. 197). Students draw and label a model of a chloroplast; indicate the key events in the conversion of sunlight to chemicalenergy; and expand the model to show the location of photosystems (Q1 and Q2, p. 205). Students working in small groups construct aphysical model of photosynthesis that includes both the light-dependent and light-independent reactions (TE p. 204).HS-LS1-6. Construct and revise an explanation based on evidence for how carbon, hydrogen, and oxygen from sugarmolecules may combine with other elements to form amino acids and/or other large carbon-based molecules. [ClarificationStatement: Emphasis is on using evidence from models and simulations to support explanations.] [Assessment Boundary: Assessment does not include the details of the specificchemical reactions or identification of macromolecules.]MILLER & LEVINE BIOLOGY, <strong>Foundation</strong> <strong>Edition</strong>: Carbon compounds are introduced in Lesson 2.3 (pp. 37–41). Students learn aboutthe organelles that build proteins and the organelles that capture and store energy in Lesson 7.2 (pp. 168–169). Lesson 13.2 (pp. 311–315)provides more details about the synthesis of proteins in ribosomes. Lesson 30.2 (pp. 719–722) focuses on the nutrients in food that supplythe raw materials that are used to build and repair tissues. In Lesson 30.3 (pp. 723–728), students learn how the digestive system convertsfood into small molecules that can be used by cells in the body.HS-LS1-7. Use a model to illustrate that cellular respiration is a chemical process whereby the bonds of food molecules andoxygen molecules are broken and the bonds in new compounds are formed resulting in a net transfer of energy. [ClarificationStatement: Emphasis is on the conceptual understanding of the inputs and outputs of the process of cellular respiration.] [Assessment Boundary: Assessment should not includeidentification of the steps or specific processes involved in cellular respiration.]MILLER & LEVINE BIOLOGY, <strong>Foundation</strong> <strong>Edition</strong>: Lesson 9.1 (pp. 212–215) provides an overview of cellular respiration. Lesson 9.2(pp. 216–222) provides additional details.Students use a model to illustrate their understanding of cellular respiration: Students use paper circles to model the formation of pyruvicacid from glucose (TE p. 217). Students, who are assigned different chemical identities, arrange themselves to model what takes placeduring each stage of cellular respiration (TE p. 222). Groups of students write a screenplay that shows how energy is produced in a cell(TE p. 226).The performance expectations above were developed using the following elements from the NRC document A Framework for K-12 Science Education:Science and Engineering Practices Disciplinary Core IdeasDeveloping and Using ModelsLS1.A: Structure and FunctionModeling in 9–12 builds on K–8 experiences and•Systems of specialized cells within organisms helpprogresses to using, synthesizing, and developing models them perform the essential functions of life. (HS-LS1-1)to predict and show relationships among variablesbetween systems and their components in the natural andSE/TE: Cell Specialization (p. 182);designed worlds.•Develop and use a model based on evidence to Specialized Tissues in Plants (pp. 552–555);illustrate the relationships between systems or between Neurons (p. 743); Bones (p. 767); Musclecomponents of a system. (HS-LS1-2)Tissue (pp. 770–771); Blood (pp. 790–791)SE: Q1 and Q2 (p. 185); Q1 and Q2 (p.571); Q1 (p. 735)•Use a model based on evidence to illustrate therelationships between systems or between components ofa system. (HS-LS1-4),(HS-LS1-5),(HS-LS1-7)SE: Q1 and Q2 (p. 205); Q1 and Q2 (p.253); Q4 (p. 327)TE: Active Reading (p. 197); SummativePerformance Task (p. 204); Hands-OnLearning (p. 217); Wrap-Up Activity (p. 222);Summative Performance Task (p. 226)•All cells contain genetic information in the form of DNAmolecules. Genes are regions in the DNA that contain theinstructions that code for the formation of proteins, whichcarry out most of the work of cells. (HS-LS1-1) (Note:This Disciplinary Core Idea is also addressed by HS-LS3-1.)SE/TE: Carbon Compounds (pp. 37–41);The Structure of DNA (pp. 292–285); DNAReplication (pp. 296–299); RNA Synthesis(pp. 309–310); The Genetic Code (pp. 311–312); Translation (pp. 312–315)Crosscutting ConceptsSystems and System Models•Models (e.g., physical, mathematical, computermodels) can be used to simulate systems andinteractions—including energy, matter, and informationflows—within and between systems at different scales.(HS-LS1-2), (HS-LS1-4)SE: Build Connections (p. 174); Inquiry intoScientific Thinking (p. 238); BuildConnections (p. 244)LMB: Making a Model of a Cell (pp. 337–338)Energy and Matter•Changes of energy and matter in a system can bedescribed in terms of energy and matter flows into, outof, and within that system. (HS-LS1-5), (HS-LS1-6)SE: Light-Dependent Reactions diagram (p.200); Light-Independent Reactions diagram(p. 202); Q4 (p. 243); Chapter Mystery, Q2and Q3 (p. 208)SE = Student <strong>Edition</strong>; TE = Teacher’s <strong>Edition</strong>; LMB = Lab Manual B 5
A Correlation of<strong>Miller</strong> & <strong>Levine</strong> <strong>Biology</strong>, <strong>Foundation</strong> <strong>Edition</strong>, ©2014to the Next Generation Science Standards, May 2013Grades 9-12•The sugar molecules thus formed contain carbon,hydrogen, and oxygen: their hydrocarbon backbones areused to make amino acids and other carbon-basedmolecules that can be assembled into larger molecules(such as proteins or DNA), used for example to form newcells. (HS-LS1-6)SE/TE: Carbon Compounds (pp. 37–41)•As matter and energy flow through differentorganizational levels of living systems, chemical elementsare recombined in different ways to form differentproducts. (HS-LS1-6),(HS-LS1-7)SE/TE: Organelles That Build Proteins (pp.168–169)•As a result of these chemical reactions, energy istransferred from one system of interacting molecules toanother and release energy to the surroundingenvironment and to maintain body temperature. Cellularrespiration is a chemical process whereby the bonds offood molecules and oxygen molecules are broken andnew compounds are formed that can transport energy tomuscles. (HS-LS1-7)SE/TE: Cellular Respiration: An Overview(pp. 212–215); The Process of CellularRespiration (pp. 216–222)SE = Student <strong>Edition</strong>; TE = Teacher’s <strong>Edition</strong>; LMB = Lab Manual B 7
A Correlation of<strong>Miller</strong> & <strong>Levine</strong> <strong>Biology</strong>, <strong>Foundation</strong> <strong>Edition</strong>, ©2014to the Next Generation Science Standards, May 2013Grades 9-12HS-LS2 Ecosystems: Interactions, Energy, and DynamicsHS-LS2 Ecosystems: Interactions, Energy, and DynamicsStudents who demonstrate understanding can:HS-LS2-1. Use mathematical and/or computational representations to support explanations of factors that affect carryingcapacity of ecosystems at different scales. [Clarification Statement: Emphasis is on quantitative analysis and comparison of the relationships amonginterdependent factors including boundaries, resources, climate, and competition. Examples of mathematical comparisons could include graphs, charts, histograms, and populationchanges gathered from simulations or historical data sets.] [Assessment Boundary: Assessment does not include deriving mathematical equations to make comparisons.]MILLER & LEVINE BIOLOGY, <strong>Foundation</strong> <strong>Edition</strong>: The concept of carrying capacity is introduced in Lesson 5.1 (p. 111). Students learnabout factors that affect population growth, such as competition and predation, in Lesson 5.2 (pp. 112–116). Lesson 5.3 (pp. 117–119)provides a historical overview of human population growth and explains how to use age-structure diagrams to analyze population growth.Students use mathematics and computational representations to explain factors that affect carrying capacity: Students identify thegeneral trends in a graph of moose and wolf populations and the factors that affect the size of the populations (TE p. 113). Students explainhow the size of a population can continue to grow as its rate of growth decreases (Q1, p. 121). Students use a table of world populationmilestones to identify a trend in population growth (Q16, p. 124).HS-LS2-2. Use mathematical representations to support and revise explanations based on evidence about factors affectingbiodiversity and populations in ecosystems of different scales. [Clarification Statement: Examples of mathematical representations include finding theaverage, determining trends, and using graphical comparisons of multiple sets of data.] [Assessment Boundary: Assessment is limited to provided data.]MILLER & LEVINE BIOLOGY, <strong>Foundation</strong> <strong>Edition</strong>: Population size is addressed throughout Chapter 5 (pp. 108–119). The concept ofbiodiversity is addressed in Lesson 6.3 (pp. 138–142).Students use mathematics and computational representations to explain factors that affect biodiversity: Students use a graph toexplain the decline of fish populations in the North Atlantic (p. 146). Students learn how to calculate a biodiversity index (Chapter 6 DataAnalysis, Analyzing Biodiversity).HS-LS2-3. Construct and revise an explanation based on evidence for the cycling of matter and flow of energy in aerobic andanaerobic conditions. [Clarification Statement: Emphasis is on conceptual understanding of the role of aerobic and anaerobic respiration in different environments.][Assessment Boundary: Assessment does not include the specific chemical processes of either aerobic or anaerobic respiration.]MILLER & LEVINE BIOLOGY, <strong>Foundation</strong> <strong>Edition</strong>: Students are introduced to autotrophs and heterotrophs as they study therelationship between consumers and producers in Lesson 3.2 (pp. 60–61). The interdependence of these categories of organisms isreinforced in Lesson 8.1 (pp. 192–194) and Lesson 9.1 (pp. 212–215). Lesson 21.3 (pp. 509–513) provides a detailed comparison ofautotrophic protests and heterotrophic protests.Students construct an explanation based on evidence for how matter and energy are cycled in aerobic and anaerobic conditions:Students explain how whales are able to stay underwater for up to 45 minutes (Chapter Mystery, pp. 211 and 230).HS-LS2-4. Use mathematical representations to support claims for the cycling of matter and flow of energy amongorganisms in an ecosystem. [Clarification Statement: Emphasis is on using a mathematical model of stored energy in biomass to describe the transfer of energy from onetrophic level to another and that matter and energy are conserved as matter cycles and energy flows through ecosystems. Emphasis is on atoms and molecules such as carbon,oxygen, hydrogen and nitrogen being conserved as they move through an ecosystem.] [Assessment Boundary: Assessment is limited to proportional reasoning to describe the cyclingof matter and flow of energy.]MILLER & LEVINE BIOLOGY, <strong>Foundation</strong> <strong>Edition</strong>: The concept of energy transfer between organisms is introduced in Lesson 3.2 (pp.60–62). Lesson 3.3 (pp. 63–67) describes food chains and food webs. Students also learn about pyramids of energy and biomass. Cycles ofmatter are addressed in Lesson 3.4 (pp. 68–73).Students use mathematical representations to support claims for the cycling of energy and matter: Students calculate the energyavailable at each level in a pyramid of energy (Inquiry into Scientific Thinking, p. 66). Students use a food web to calculate the percentageof energy originally captured by primary producers that is available to specific consumers (Q2, p. 75). Students use a graph to explore theeffect of rainfall on plant tissue productivity (Q16 and Q17, p. 78).SE = Student <strong>Edition</strong>; TE = Teacher’s <strong>Edition</strong>; LMB = Lab Manual B 8
A Correlation of<strong>Miller</strong> & <strong>Levine</strong> <strong>Biology</strong>, <strong>Foundation</strong> <strong>Edition</strong>, ©2014to the Next Generation Science Standards, May 2013Grades 9-12HS-LS2-5. Develop a model to illustrate the role of photosynthesis and cellular respiration in the cycling of carbon amongthe biosphere, atmosphere, hydrosphere, and geosphere. [Clarification Statement: Examples of models could include simulations and mathematicalmodels.] [Assessment Boundary: Assessment does not include the specific chemical steps of photosynthesis and respiration.]MILLER & LEVINE BIOLOGY, <strong>Foundation</strong> <strong>Edition</strong>: The cycling of carbon between the biosphere, atmosphere, hydrosphere, andgeosphere is addressed in Lesson 3.4 (pp. 70–71). Certain aspects of the cycle are reinforced in Lesson 8.2 (pp. 196–197) and Lesson 9.1(pp. 213–214).Students develop a model to illustrate the role of photosynthesis and cellular respiration in the carbon cycle: Students design a museumexhibit about the movement of matter in ecosystems (TE p. 74).HS-LS2-6. Evaluate the claims, evidence, and reasoning that the complex interactions in ecosystems maintain relativelyconsistent numbers and types of organisms in stable conditions, but changing conditions may result in a new ecosystem.[Clarification Statement: Examples of changes in ecosystem conditions could include modest biological or physical changes, such as moderate hunting or a seasonal flood; and,extreme changes, such as volcanic eruption or sea level rise.]MILLER & LEVINE BIOLOGY, <strong>Foundation</strong> <strong>Edition</strong>: Students study community interactions in Lesson 4.2 (pp. 85–87). Students studyprimary and secondary succession in Lesson 4.3 (pp. 88–90). Students learn about different types of population growth in Lesson 5.1 (pp.108–111) and factors that limit population growth in Lesson 5.2 (pp. 112–115).Students evaluate claims, evidence, and reasoning about what happens to populations in stable and unstable conditions: Studentspredict how changes in an ecosystem will affect the population size of predators and prey (Lab Manual B, pp. 235–236). Students predicthow the removal of a predator from an ecosystem would affect its prey (Q2, p. 121).HS-LS2-7. Design, evaluate, and refine a solution for reducing the impacts of human activities on the environment andbiodiversity.* [Clarification Statement: Examples of human activities can include urbanization, building dams, and dissemination of invasive species.]MILLER & LEVINE BIOLOGY, <strong>Foundation</strong> <strong>Edition</strong>: Lesson 6.1 (pp. 128–131) provides an overview of the impact of human activities onthe environment and of sustainable development. Students learn about ways that humans can use resources wisely in Lesson 6.2 (pp. 132–137). Lesson 6.3 (pp. 138–142) discusses the value of biodiversity, threats to biodiversity, and ways to conserve biodiversity. Lesson 6.4 (pp.143–149) uses case studies to teach students ways to meet ecological challenges.Students design and evaluate solutions for reducing the impact of humans on the environment and biodiversity: Students evaluate waysto reduce dry trash (Inquiry into Scientific Thinking, p. 130). Students evaluate reintroduction of species as a way to maintain biodiversity(Lab Manual B, pp. 247–248). Students determine ways that their school can conserve water (Q4, p. 151). Groups of students pick aspecific region that is threatened by human actions; they create a Web site that describes the problem and potential solutions (TE p. 100).Students research the reduction of mussel populations in tide pools off the Pacific Coast and propose a possible solution (pp. 53a–53b).HS-LS2-8. Evaluate the evidence for the role of group behavior on individual and species’ chances to survive and reproduce.[Clarification Statement: Emphasis is on: (1) distinguishing between group and individual behavior, (2) identifying evidence supporting the outcomes of group behavior, and (3)developing logical and reasonable arguments based on evidence. Examples of group behaviors could include flocking, schooling, herding, and cooperative behaviors such as hunting,migrating, and swarming.]MILLER & LEVINE BIOLOGY, <strong>Foundation</strong> <strong>Edition</strong>: In Lesson 29.1 (p. 696), students learn that many behaviors are essential to survival.Lesson 29.2 (pp. 701–704) expands the concept to include group behaviors such as migration.Students evaluate evidence for the role of group behavior in the ability of individuals and species to survive and reproduce: Studentsevaluate evidence of how wolves behave in a pack (Chapter 29 STEM activity, Yellowstone Wolves).SE = Student <strong>Edition</strong>; TE = Teacher’s <strong>Edition</strong>; LMB = Lab Manual B 9
A Correlation of<strong>Miller</strong> & <strong>Levine</strong> <strong>Biology</strong>, <strong>Foundation</strong> <strong>Edition</strong>, ©2014to the Next Generation Science Standards, May 2013Grades 9-12The performance expectations above were developed using the following elements from the NRC document A Framework for K-12 Science Education:Science and Engineering PracticesDeveloping and Using ModelsModeling in 9–12 builds on K–8 experiences andprogresses to using, synthesizing, and developing modelsto predict and show how relationships among variablesbetween systems and their components in the natural anddesigned worlds.•Develop a model based on evidence to illustrate therelationships between systems or components of asystem. (HS-LS2-5)TE: Summative Performance Task (p. 74)Using Mathematics and Computational ThinkingMathematical and computational thinking in 9-12 buildson K-8 experiences and progresses to using algebraicthinking and analysis, a range of linear and nonlinearfunctions including trigonometric functions, exponentialsand logarithms, and computational tools for statisticalanalysis to analyze, represent, and model data. Simplecomputational simulations are created and used based onmathematical models of basic assumptions.•Use mathematical and/or computationalrepresentations of phenomena or design solutions tosupport explanations. (HS-LS2-1)SE: Q1 (p. 121); Q31 (p. 124)TE: Active Reading (p. 117)•Use mathematical representations of phenomena ordesign solutions to support and revise explanations. (HS-LS2-2)SE: Case Study #2 (p. 146)<strong>Biology</strong>.com: Chapter 6 Data Analysis,Analyzing Biodiversity•Use mathematical representations of phenomena ordesign solutions to support claims. (HS-LS2-4)SE: Inquiry into Scientific Thinking (p. 66);Q2 (p. 75); Q16 and Q17 (p. 78)Constructing Explanations and Designing SolutionsConstructing explanations and designing solutions in 9–12builds on K–8 experiences and progresses to explanationsand designs that are supported by multiple andindependent student-generated sources of evidenceconsistent with scientific ideas, principles, and theories.•Construct and revise an explanation based on validand reliable evidence obtained from a variety of sources(including students’ own investigations, models, theories,simulations, peer review) and the assumption thattheories and laws that describe the natural world operatetoday as they did in the past and will continue to do so inthe future. (HS-LS2-3)SE: Chapter 9 Mystery (pp. 211 and 230)•Design, evaluate, and refine a solution to a complexreal-world problem, based on scientific knowledge,student-generated sources of evidence, prioritized criteria,and tradeoff considerations. (HS-LS2-7)SE: Inquiry into Scientific Thinking (p. 130);Q4 (p. 151); Unit 2 Project (pp. 53a–53b)TE: Transfer Performance Task (p. 100)Disciplinary Core IdeasLS2.A: Interdependent Relationships inEcosystems•Ecosystems have carrying capacities, which are limitsto the numbers of organisms and populations they cansupport. These limits result from such factors as theavailability of living and nonliving resources and from suchchallenges such as predation, competition, and disease.Organisms would have the capacity to producepopulations of great size were it not for the fact thatenvironments and resources are finite. This fundamentaltension affects the abundance (number of individuals) ofspecies in any given ecosystem. (HS-LS2-1),(HS-LS2-2)SE/TE: Competition (pp. 85–86);Exponential Growth (pp. 109–110); LogisticGrowth (pp. 110–111); Density-DependentLimiting Factors (pp. 112–114)LS2.B: Cycles of Matter and Energy Transfer inEcosystems•Photosynthesis and cellular respiration (includinganaerobic processes) provide most of the energy for lifeprocesses. (HS-LS2-3)SE/TE: Primary Producers (pp. 60–61);Energy and Life (pp. 192–194); ChemicalEnergy and Food (p. 212)•Plants or algae form the lowest level of the food web.At each link upward in a food web, only a small fraction ofthe matter consumed at the lower level is transferredupward, to produce growth and release energy in cellularrespiration at the higher level. Given this inefficiency,there are generally fewer organisms at higher levels of afood web. Some matter reacts to release energy for lifefunctions, some matter is stored in newly madestructures, and much is discarded. The chemical elementsthat make up the molecules of organisms pass throughfood webs and into and out of the atmosphere and soil,and they are combined and recombined in different ways.At each link in an ecosystem, matter and energy areconserved. (HS-LS2-4)SE/TE: Food Chains and Food Webs (pp.63–65); Ecological Pyramids (pp. 66–67);Recycling in the Biosphere (pp. 68–69);Nutrient Cycles (pp. 70–72)•Photosynthesis and cellular respiration are importantcomponents of the carbon cycle, in which carbon isexchanged among the biosphere, atmosphere, oceans,and geosphere through chemical, physical, geological, andbiological processes. (HS-LS2-5)SE/TE: The Carbon Cycle (pp. 70–71)Crosscutting ConceptsCause and Effect•Empirical evidence is required to differentiate betweencause and correlation and make claims about specificcauses and effects. (HS-LS2-8)TE: Wrap-Up activity (p. 704)<strong>Biology</strong>.com: Chapter 29 STEM activity,Yellowstone WolvesScale, Proportion, and Quantity•The significance of a phenomenon is dependent on thescale, proportion, and quantity at which it occurs. (HS-LS2-1)TE: Active Reading (p. 118)<strong>Biology</strong>.com: Chapter 3 Data Analysis,Counting on Nature•Using the concept of orders of magnitude allows oneto understand how a model at one scale relates to amodel at another scale. (HS-LS2-2)Systems and System Models•Models (e.g., physical, mathematical, computermodels) can be used to simulate systems andinteractions—including energy, matter, and informationflows—within and between systems at different scales.(HS-LS2-5)SE: The Carbon Cycle diagram (p. 70)TE: Transfer Performance Task (p. 204)Energy and Matter•Energy cannot be created or destroyed—it only movesbetween one place and another place, between objectsand/or fields, or between systems. (HS-LS2-4)SE: Photosynthesis equation (p. 61);Consumers visual (p. 62); Pyramid of Energyfigure (p. 66)TE: Lead a Discussion (p. 66)•Energy drives the cycling of matter within and betweensystems. (HS-LS2-3)SE: Build Connections (p. 68)TE: Build Connections (p. 69)Stability and Change•Much of science deals with constructing explanationsof how things change and how they remain stable. (HS-LS2-6),(HS-LS2-7)SE: Q2 (p. 101); Q5 (p. 149); ChapterMystery (p. 154)TE: Speed Bump (p. 89); Speed Bump (p.90)<strong>Biology</strong>.com: Virtual Lab, Introduction toEcologySE = Student <strong>Edition</strong>; TE = Teacher’s <strong>Edition</strong>; LMB = Lab Manual B 10
A Correlation of<strong>Miller</strong> & <strong>Levine</strong> <strong>Biology</strong>, <strong>Foundation</strong> <strong>Edition</strong>, ©2014to the Next Generation Science Standards, May 2013Grades 9-12LMB: Saving the Golden Lion Tamarin (pp.247–248)Engaging in Argument from EvidenceEngaging in argument from evidence in 9–12 builds on K–8 experiences and progresses to using appropriate andsufficient evidence and scientific reasoning to defend andcritique claims and explanations about the natural anddesigned world(s). Arguments may also come fromcurrent scientific or historical episodes in science.•Evaluate the claims, evidence, and reasoning behindcurrently accepted explanations or solutions to determinethe merits of arguments. (HS-LS2-6)SE: Q2 (p. 121)LMB: Predator-Prey Dynamics (pp. 235–236)•Evaluate the evidence behind currently acceptedexplanations to determine the merits of arguments. (HS-LS2-8)<strong>Biology</strong>.com: Chapter 29 STEM activity-------------------------------------------------------Connections to Nature of ScienceScientific Knowledge is Open to Revision in Light ofNew Evidence•Most scientific knowledge is quite durable, but is, inprinciple, subject to change based on new evidenceand/or reinterpretation of existing evidence. (HS-LS2-2),(HS-LS2-3)SE: Chapter 3 Mystery (pp. 55 and 78);Chapter 4 Mystery (pp. 81 and 104)•Scientific argumentation is a mode of logical discourseused to clarify the strength of relationships between ideasand evidence that may result in revision of anexplanation. (HS-LS2-6),(HS-LS2-8)SE: Chapter 5 Mystery (pp. 107 and 124);Chapter 29 Mystery (pp. 695 and 708)LS2.C: Ecosystem Dynamics, Functioning, andResilience•A complex set of interactions within an ecosystem cankeep its numbers and types of organisms relativelyconstant over long periods of time under stableconditions. If a modest biological or physical disturbanceto an ecosystem occurs, it may return to its more or lessoriginal status (i.e., the ecosystem is resilient), asopposed to becoming a very different ecosystem. Extremefluctuations in conditions or the size of any population,however, can challenge the functioning of ecosystems interms of resources and habitat availability. (HS-LS2-2),(HS-LS2-6)SE/TE: Primary and Secondary Succession(pp. 88–89); Climax Communities (pp. 89–90)•Moreover, anthropogenic changes (induced by humanactivity) in the environment—including habitatdestruction, pollution, introduction of invasive species,overexploitation, and climate change—can disrupt anecosystem and threaten the survival of some species.(HS-LS2-7)SE/TE: The Effect of Human Activity (pp.128–131); Soil Erosion (pp. 132–133); WaterPollution (pp. 134–135); Air Pollution (p.136); Air Quality and Sustainability (p. 137);Altered Habitats (p. 140)LS2.D: Social Interactions and Group Behavior•Group behavior has evolved because membership canincrease the chances of survival for individuals and theirgenetic relatives. (HS-LS2-8)SE/TE: Behavioral Cycles (p. 701); SocialBehavior (p. 702); Communication (pp. 703–704)LS4.D: Biodiversity and Humans•Biodiversity is increased by the formation of newspecies (speciation) and decreased by the loss of species(extinction). (secondary to HS-LS2-7)SE/TE: The Process of Speciation (pp. 414–416); Speciation and Extinction (pp. 456–457)•Humans depend on the living world for the resourcesand other benefits provided by biodiversity. But humanactivity is also having adverse impacts on biodiversitythrough overpopulation, overexploitation, habitatdestruction, pollution, introduction of invasive species,and climate change. Thus sustaining biodiversity so thatecosystem functioning and productivity are maintained isessential to supporting and enhancing life on Earth.Sustaining biodiversity also aids humanity by preservinglandscapes of recreational or inspirational value.(secondary to HS-LS2-7) (Note: This Disciplinary CoreIdea is also addressed by HS-LS4-6.)SE/TE: The Value of Biodiversity (pp. 138–139); Threats to Biodiversity (pp. 140–141);Conserving Biodiversity (pp. 141–142);Ecology in Action (pp. 144–149)SE = Student <strong>Edition</strong>; TE = Teacher’s <strong>Edition</strong>; LMB = Lab Manual B 11
A Correlation of<strong>Miller</strong> & <strong>Levine</strong> <strong>Biology</strong>, <strong>Foundation</strong> <strong>Edition</strong>, ©2014to the Next Generation Science Standards, May 2013Grades 9-12PS3.D: Energy in Chemical Processes•The main way that solar energy is captured and storedon Earth is through the complex chemical process knownas photosynthesis. (secondary to HS-LS2-5)SE/TE: Energy From the Sun (p. 60);Photosynthesis: An Overview (pp. 195–197);The Process of Photosynthesis (pp. 199–203)ETS1.B: Developing Possible Solutions•When evaluating solutions it is important to take intoaccount a range of constraints including cost, safety,reliability and aesthetics and to consider social, culturaland environmental impacts. (secondary to HS-LS2-7)SE/TE: Case Study #1, Atmospheric Ozone(p. 145); Case Study #2, North AtlanticFisheries (p. 146); Case Study #3, ClimateChange (pp. 147–149); Unit 6 Project, ALiving Roof (pp. 477a–477b)*The performance expectations marked with an asterisk integrate traditional science content with engineering through a Practice orDisciplinary Core Idea.SE = Student <strong>Edition</strong>; TE = Teacher’s <strong>Edition</strong>; LMB = Lab Manual B 12
A Correlation of<strong>Miller</strong> & <strong>Levine</strong> <strong>Biology</strong>, <strong>Foundation</strong> <strong>Edition</strong>, ©2014to the Next Generation Science Standards, May 2013Grades 9-12HS-LS3 Heredity: Inheritance and Variation of TraitsHS-LS3 Heredity: Inheritance and Variation of TraitsStudents who demonstrate understanding can:HS-LS3-1. Ask questions to clarify relationships about the role of DNA and chromosomes in coding the instructions forcharacteristic traits passed from parents to offspring. [Assessment Boundary: Assessment does not include the phases of meiosis or the biochemicalmechanism of specific steps in the process.]MILLER & LEVINE BIOLOGY, <strong>Foundation</strong> <strong>Edition</strong>: In Lesson 7.2 (p. 165), students learn that the nucleus of a cell contains DNA. InLesson 10.2 (p. 239), students learn about the role of chromosomes in cell division. Lesson 12.1 (pp. 290–291) provides a general descriptionof the role of DNA. Lesson 12.2 (pp. 292–295) describes the structure of DNA. In Lesson 13.2 (pp. 311–312), students learn how theinstructions for characteristic traits (the genetic code) are stored in DNA.Students ask questions about the role of DNA and chromosomes in the inheritance of characteristic traits: Students make a list ofquestions about a diagram showing DNA replication (TE p. 296).HS-LS3-2. Make and defend a claim based on evidence that inheritable genetic variations may result from: (1) new geneticcombinations through meiosis, (2) viable errors occurring during replication, and/or (3) mutations caused by environmentalfactors. [Clarification Statement: Emphasis is on using data to support arguments for the way variation occurs.] [Assessment Boundary: Assessment does not include the phasesof meiosis or the biochemical mechanism of specific steps in the process.]MILLER & LEVINE BIOLOGY, <strong>Foundation</strong> <strong>Edition</strong>: Students are introduced to the process of DNA replication in Lesson 12.3 (pp. 296–299) and mutations in Lesson 13.3 (pp. 316–319). Lesson 17.1 (pp. 406–408) connects genetics to evolutionary theory. Lesson 17.2 (pp.409-413) focuses on the mechanisms by which genetic variation is introduced into populations. Students revisit the effect of mutations onevolution in Lesson 17.4 (pp. 417–419).Students make and defend claims based on evidence about the causes of inheritable genetic variations: Students defend the claim thatgenetic variation in a population is necessary for natural selection to take place (Q1, p. 422). Students predict how specific environmentalfactors might affect the natural selection of polygenic traits (TE p. 410).HS-LS3-3. Apply concepts of statistics and probability to explain the variation and distribution of expressed traits in apopulation. [Clarification Statement: Emphasis is on the use of mathematics to describe the probability of traits as it relates to genetic and environmental factors in theexpression of traits.] [Assessment Boundary: Assessment does not include Hardy-Weinberg calculations.]MILLER & LEVINE BIOLOGY, <strong>Foundation</strong> <strong>Edition</strong>: The term probability is defined in Lesson 11.2 (p. 266) in relation to genetic crosses.Exceptions to Mendel’s principles are discussed in Lesson 11.3 (pp. 271–273) as is how the environment can affect the expression of genes.Lesson 14.1 (pp. 334-337) focuses on the variation of traits in humans.Students apply concepts of statistics and probability to the variation of traits: Students use a Punnett square to show the results of atwo-factor cross and explain why the actual results do not match the expected results (Q1 and Q2, p. 281). Students use data to drawconclusions about the genotypes involved in a cross (Use Science Graphics, p. 284). Students use data to identify the genotypes ofparakeets (Chapter Mystery, p. 284)The performance expectations above were developed using the following elements from the NRC document, A Framework for K-12 Science Education:Science and Engineering Practices Disciplinary Core IdeasAsking Questions and Defining ProblemsLS1.A: Structure and FunctionAsking questions and defining problems in 9-12 builds on •All cells contain genetic information in the form of DNAK-8 experiences and progresses to formulating, refining, molecules. Genes are regions in the DNA that contain theand evaluating empirically testable questions and design instructions that code for the formation of proteins.problems using models and simulations.(secondary to HS-LS3-1) (Note: This Disciplinary Core•Ask questions that arise from examining models or a Idea is also addressed by HS-LS1-1.)theory to clarify relationships. (HS-LS3-1)TE: Build Understanding (p. 296)SE/TE: The Nucleus (p. 165); Passing Traitsto Offspring (p. 263); The Role of DNA (pp.290–291); The Genetic Code (pp. 311–312)Crosscutting ConceptsCause and Effect•Empirical evidence is required to differentiate betweencause and correlation and make claims about specificcauses and effects. (HS-LS3-1),(HS-LS3-2)SE: Q2 (p. 283); Q5 (p. 303); Use ScienceGraphics (p. 304); Inquiry into ScientificThinking (p. 325)TE: Transfer Performance Task (p. 280);Assess and Remediate, ConstructingExplanations (p. 286b)SE = Student <strong>Edition</strong>; TE = Teacher’s <strong>Edition</strong>; LMB = Lab Manual B 13
A Correlation of<strong>Miller</strong> & <strong>Levine</strong> <strong>Biology</strong>, <strong>Foundation</strong> <strong>Edition</strong>, ©2014to the Next Generation Science Standards, May 2013Grades 9-12Analyzing and Interpreting DataAnalyzing data in 9-12 builds on K-8 experiences andprogresses to introducing more detailed statisticalanalysis, the comparison of data sets for consistency, andthe use of models to generate and analyze data.•Apply concepts of statistics and probability (includingdetermining function fits to data, slope, intercept, andcorrelation coefficient for linear fits) to scientific andengineering questions and problems, using digital toolswhen feasible. (HS-LS3-3)SE: Q1 and Q2 (p. 281); Use ScienceGraphics (p. 284); Chapter Mystery (p. 284)Engaging in Argument from EvidenceEngaging in argument from evidence in 9-12 builds on K-8experiences and progresses to using appropriate andsufficient evidence and scientific reasoning to defend andcritique claims and explanations about the natural anddesigned world(s). Arguments may also come fromcurrent scientific or historical episodes in science.•Make and defend a claim based on evidence about thenatural world that reflects scientific knowledge, andstudent-generated evidence. (HS-LS3-2)SE: Constructed Response, Q1 (p. 422)TE: Active Reading (p. 410)LS3.A: Inheritance of Traits•Each chromosome consists of a single very long DNAmolecule, and each gene on the chromosome is aparticular segment of that DNA. The instructions forforming species’ characteristics are carried in DNA. Allcells in an organism have the same genetic content, butthe genes used (expressed) by the cell may be regulatedin different ways. Not all DNA codes for a protein; somesegments of DNA are involved in regulatory or structuralfunctions, and some have no as-yet known function. (HS-LS3-1)SE/TE: The Double-Helix Model (pp. 294–295); The Genetic Code (pp. 311–312); TheMolecular Basis of Heredity (p. 314);Prokaryotic Gene Regulation (pp. 320–321);Eukaryotic Gene Regulation (pp. 322–323);Genetic Control of Development (pp. 323–324)LS3.B: Variation of Traits•In sexual reproduction, chromosomes can sometimesswap sections during the process of meiosis (cell division),thereby creating new genetic combinations and thus moregenetic variation. Although DNA replication is tightlyregulated and remarkably accurate, errors do occur andresult in mutations, which are also a source of geneticvariation. Environmental factors can also cause mutationsin genes, and viable mutations are inherited. (HS-LS3-2)SE/TE: Phases of Meiosis (pp. 276–277);DNA Replication (pp. 296–299); Types ofMutations (pp. 316–318); Effects ofMutations (pp. 318–319); ChromosomalDisorders (p. 341); Sources of GeneticVariation (p. 407)•Environmental factors also affect expression of traits,and hence affect the probability of occurrences of traits ina population. Thus the variation and distribution of traitsobserved depends on both genetic and environmentalfactors. (HS-LS3-2),(HS-LS3-3)Scale, Proportion, and Quantity•Algebraic thinking is used to examine scientific dataand predict the effect of a change in one variable onanother (e.g., linear growth vs. exponential growth). (HS-LS3-3)LMB: Calculating Haploid and DiploidNumbers (pp. 263–264); Base Percentages(pp. 265–266)---------------------------------------------Connections to Nature of ScienceScience is a Human Endeavor•Technological advances have influenced the progressof science and science has influenced advances intechnology. (HS-LS3-3)SE: Representative Examples: The HumanGenome Project (pp. 344–345); Q3 (p. 347);Changing DNA (pp. 358–360); Health andMedicine (pp. 363–364)•Science and engineering are influenced by society andsociety is influenced by science and engineering. (HS-LS3-3)SE: Unit 4 Project (pp. 259a–259b); Healthand Medicine (pp. 363–364); Ethics andImpacts of Biotechnology (pp. 367–369)TE: Building Scientific Literacy, STEM (p.332a); Transfer Performance Task (p. 346);Active Reading (p. 369)SE/TE: Environmental Influences (p. 324);Genetic Advantages (p. 340)SE = Student <strong>Edition</strong>; TE = Teacher’s <strong>Edition</strong>; LMB = Lab Manual B 14
HS-LS4 Biological Evolution: Unity and DiversityA Correlation of<strong>Miller</strong> & <strong>Levine</strong> <strong>Biology</strong>, <strong>Foundation</strong> <strong>Edition</strong>, ©2014to the Next Generation Science Standards, May 2013Grades 9-12HS-LS4 Biological Evolution: Unity and DiversityStudents who demonstrate understanding can:HS-LS4-1. Communicate scientific information that common ancestry and biological evolution are supported by multiplelines of empirical evidence. [Clarification Statement: Emphasis is on a conceptual understanding of the role each line of evidence has relating to common ancestry andbiological evolution. Examples of evidence could include similarities in DNA sequences, anatomical structures, and order of appearance of structures in embryological development.]MILLER & LEVINE BIOLOGY, <strong>Foundation</strong> <strong>Edition</strong>: Lesson 16.1 (pp. 380–383) describes what Darwin observed during the voyage of theBeagle. Lesson 16.3 (pp. 388–391) presents Darwin’s argument for evolution by natural selection. In Lesson 16.4 (pp. 392–397), studentslearn about other empirical evidence that supports Darwin’s argument. Lesson 17.4 (pp. 417–419) presents the molecular evidence forevolution.Students communicate scientific information about the multiple lines of evidence for biological evolution: Students explain how DNAprovides evidence of common descent (Q16, p. 402). Students explain how fossils support Darwin’s theory of evolution (TE p. 395).HS-LS4-2. Construct an explanation based on evidence that the process of evolution primarily results from four factors: (1)the potential for a species to increase in number, (2) the heritable genetic variation of individuals in a species due tomutation and sexual reproduction, (3) competition for limited resources, and (4) the proliferation of those organisms thatare better able to survive and reproduce in the environment. [Clarification Statement: Emphasis is on using evidence to explain the influence each of thefour factors has on number of organisms, behaviors, morphology, or physiology in terms of ability to compete for limited resources and subsequent survival of individuals andadaptation of species. Examples of evidence could include mathematical models such as simple distribution graphs and proportional reasoning.] [Assessment Boundary: Assessmentdoes not include other mechanisms of evolution, such as genetic drift, gene flow through migration, and co-evolution.]MILLER & LEVINE BIOLOGY, <strong>Foundation</strong> <strong>Edition</strong>: The foundation for understanding the evidence for evolution is laid in Lesson 4.2(pp. 85–86) where the competitive exclusion principle is discussed; in Lessons 5.1 and 5.2 (pp. 108–115) where population growth and limitsto growth are discussed; and in Lesson 13.3 (pp. 316–319) where mutations are discussed. In Lesson 16.3 (pp. 388–391), students areintroduced to the concept of natural selection. In Lesson 17.2 (pp. 409–410), students learn about the impact of genetic variation on naturalselection. In the Chapter 17 Lab, Competing for Resources, students use assorted tools to simulate the competition of birds for seeds.Students construct an explanation based on evidence that evolution results primarily from four factors: Students use experimental datato explain how genetic variation is important in the survival of a species (Q8, p. 397). Students identify heritable variation as a requirementfor natural selection (TE p. 390).HS-LS4-3. Apply concepts of statistics and probability to support explanations that organisms with an advantageousheritable trait tend to increase in proportion to organisms lacking this trait. [Clarification Statement: Emphasis is on analyzing shifts in numericaldistribution of traits and using these shifts as evidence to support explanations.] [Assessment Boundary: Assessment is limited to basic statistical and graphical analysis. Assessmentdoes not include allele frequency calculations.]MILLER & LEVINE BIOLOGY, <strong>Foundation</strong> <strong>Edition</strong>: In Lesson 16.3 (pp. 388–391), students learn how advantageous traits affect survival.In Lesson 16.4 (p. 396), students learn how scientists can observe natural selection in a natural environment.Students apply concepts of statistics and probability to the relationship between advantageous traits and population size: Studentsidentify a trend in bird survival based on beak size (TE p. 397). Students use statistics to explore drug resistance as an advantageous traitfor bacteria (Inquiry into Scientific Thinking, p. 492). Students learn how the presence of mycorrhizae affect the growth and survival ofplants (Lab Manual B, pp. 287–288).HS-LS4-4. Construct an explanation based on evidence for how natural selection leads to adaptation of populations.[Clarification Statement: Emphasis is on using data to provide evidence for how specific biotic and abiotic differences in ecosystems (such as ranges of seasonal temperature, longtermclimate change, acidity, light, geographic barriers, or evolution of other organisms) contribute to a change in gene frequency over time, leading to adaptation of populations.]MILLER & LEVINE BIOLOGY, <strong>Foundation</strong> <strong>Edition</strong>: Lesson 17.1 (pp. 406–408) introduces the concepts of a gene pool and allelefrequency. In Lesson 17.2 (pp. 409–413), students learn how natural selection affects allele frequencies. In Lesson 17.3 (pp. 414–416),students learn how different types of isolation can lead to the adaptation of populations.Students construct an explanation based on evidence for how natural selection leads to adaptation of populations: Students explainhow the evolution of a vascular system affected the ability of plants to survive in various environments (Q2, p. 545). Students explain thebenefit to vines of thigmotropism (Q10, p. 599).SE = Student <strong>Edition</strong>; TE = Teacher’s <strong>Edition</strong>; LMB = Lab Manual B 15
A Correlation of<strong>Miller</strong> & <strong>Levine</strong> <strong>Biology</strong>, <strong>Foundation</strong> <strong>Edition</strong>, ©2014to the Next Generation Science Standards, May 2013Grades 9-12HS-LS4-5. Evaluate the evidence supporting claims that changes in environmental conditions may result in: (1) increases inthe number of individuals of some species, (2) the emergence of new species over time, and (3) the extinction of otherspecies. [Clarification Statement: Emphasis is on determining cause and effect relationships for how changes to the environment such as deforestation, fishing, application offertilizers, drought, flood, and the rate of change of the environment affect distribution or disappearance of traits in species.]MILLER & LEVINE BIOLOGY, <strong>Foundation</strong> <strong>Edition</strong>: In Lesson 17.3 (pp. 414–416), students learn how different types of isolation can leadto the formation of new species. Lesson 19.2 (pp. 456–457) discusses the processes that influence whether species survive or becomeextinct.Students evaluate the evidence for claims that environmental conditions may result in speciation or extinction: Students exploreevidence that climate change is causing a genetic decline in alpine chipmunks (pp. 377a–377b). Students use evidence to suggest anexplanation for the Permian mass extinction (Chapter Mystery, Q2, p. 474).HS-LS4-6. Create or revise a simulation to test a solution to mitigate adverse impacts of human activity on biodiversity.*[Clarification Statement: Emphasis is on designing solutions for a proposed problem related to threatened or endangered species, or to genetic variation of organisms for multiplespecies.]MILLER & LEVINE BIOLOGY, <strong>Foundation</strong> <strong>Edition</strong>: Lesson 6.3 (pp. 138–142) discusses the value of biodiversity, threats to biodiversity,and ways to conserve biodiversity. The Unit 2 Project, Disappearing Mussels! (pp. 53a–53b), asks students to recommend ways to preventthe decline of marine populations.The performance expectations above were developed using the following elements from the NRC document A Framework for K-12 Science Education:Science and Engineering Practices Disciplinary Core IdeasAnalyzing and Interpreting DataLS4.A: Evidence of Common Ancestry and DiversityAnalyzing data in 9–12 builds on K–8 experiences and •Genetic information provides evidence of evolution.progresses to introducing more detailed statisticalDNA sequences vary among species, but there are manyanalysis, the comparison of data sets for consistency, and overlaps; in fact, the ongoing branching that producesthe use of models to generate and analyze data.multiple lines of descent can be inferred by comparing the•Apply concepts of statistics and probability (including DNA sequences of different organisms. Such informationdetermining function fits to data, slope, intercept, and is also derivable from the similarities and differences incorrelation coefficient for linear fits) to scientific and amino acid sequences and from anatomical andengineering questions and problems, using digital tools embryological evidence. (HS-LS4-1)when feasible. (HS-LS4-3)SE: Inquiry into Scientific Thinking (p. 492)TE: Active Reading (p. 397)LMB: Mycorrhizae and Tree Height (pp. 287–288)Using Mathematics and Computational ThinkingMathematical and computational thinking in 9-12 buildson K-8 experiences and progresses to using algebraicthinking and analysis, a range of linear and nonlinearfunctions including trigonometric functions, exponentialsand logarithms, and computational tools for statisticalanalysis to analyze, represent, and model data. Simplecomputational simulations are created and used based onmathematical models of basic assumptions.•Create or revise a simulation of a phenomenon,designed device, process, or system. (HS-LS4-6)Constructing Explanations and Designing SolutionsConstructing explanations and designing solutions in 9–12builds on K–8 experiences and progresses to explanationsand designs that are supported by multiple andindependent student-generated sources of evidenceconsistent with scientific ideas, principles, and theories.•Construct an explanation based on valid and reliableevidence obtained from a variety of sources (includingstudents’ own investigations, models, theories,simulations, peer review) and the assumption thattheories and laws that describe the natural world operatetoday as they did in the past and will continue to do so inthe future. (HS-LS4-2),(HS-LS4-4)SE: Q8 (p. 397); Q2 (p. 545); Q10 (p. 599)SE/TE: Genetics and Molecular <strong>Biology</strong> (p.395); Genetics Joins Evolutionary Theory (p.406); Molecular Evolution (pp. 417–419)LS4.B: Natural Selection•Natural selection occurs only if there is both (1)variation in the genetic information between organisms ina population and (2) variation in the expression of thatgenetic information—that is, trait variation—that leads todifferences in performance among individuals. (HS-LS4-2),(HS-LS4-3)SE/TE: How Natural Selection Works (pp.409–410)•The traits that positively affect survival are more likelyto be reproduced, and thus are more common in thepopulation. (HS-LS4-3)SE/TE: Gene Pools (p. 406); NaturalSelection on Single-Gene Traits (p. 409)Crosscutting ConceptsPatterns•Different patterns may be observed at each of thescales at which a system is studied and can provideevidence for causality in explanations of phenomena. (HS-LS4-1),(HS-LS4-3)SE: Build Connections (p. 389); A Range ofPhenotypes graphs (p. 408); Use ScienceGraphics (p. 424); Q2 (p. 471)LMB: Molecular Homology in Hoxc8 (pp.275–276)Cause and Effect•Empirical evidence is required to differentiate betweencause and correlation and make claims about specificcauses and effects. (HS-LS4-2),(HS-LS4-4),(HS-LS4-5),(HS-LS4-6)SE: Build Connections (p. 394); Survival ofthe Fittest and Beak Size graph (p. 397)TE: Transfer Performance Task (p. 470)LMB: Extinctions Through Time (pp. 281–282)<strong>Biology</strong>.com: Chapter 16 STEM activity,Bird Beaks; Chapter 19 Data Analysis,Extinctions---------------------------------------------Connections to Nature of ScienceScientific Knowledge Assumes an Order andConsistency in Natural Systems•Scientific knowledge is based on the assumption thatnatural laws operate today as they did in the past andthey will continue to do so in the future. (HS-LS4-1),(HS-LS4-4)SE: An Ancient Changing Earth (pp. 384–385)SE = Student <strong>Edition</strong>; TE = Teacher’s <strong>Edition</strong>; LMB = Lab Manual B 16
A Correlation of<strong>Miller</strong> & <strong>Levine</strong> <strong>Biology</strong>, <strong>Foundation</strong> <strong>Edition</strong>, ©2014to the Next Generation Science Standards, May 2013Grades 9-12TE: Speed Bump (p. 390)Engaging in Argument from EvidenceEngaging in argument from evidence in 9-12 builds on K-8experiences and progresses to using appropriate andsufficient evidence and scientific reasoning to defend andcritique claims and explanations about the natural anddesigned world(s). Arguments may also come fromcurrent or historical episodes in science.•Evaluate the evidence behind currently acceptedexplanations or solutions to determine the merits ofarguments. (HS-LS4-5)SE: Unit 5 Project (pp. 377a–377b); ChapterMystery, Q2 (p. 474)Obtaining, Evaluating, and CommunicatingInformationObtaining, evaluating, and communicating information in9–12 builds on K–8 experiences and progresses toevaluating the validity and reliability of the claims,methods, and designs.•Communicate scientific information (e.g., aboutphenomena and/or the process of development and thedesign and performance of a proposed process or system)in multiple formats (including orally, graphically, textually,and mathematically). (HS-LS4-1)SE: Q16 (p. 402)TE: Speed Bump (p. 395)--------------------------------------------------------Connections to Nature of ScienceScience Models, Laws, Mechanisms, and TheoriesExplain Natural Phenomena•A scientific theory is a substantiated explanation ofsome aspect of the natural world, based on a body offacts that have been repeatedly confirmed throughobservation and experiment and the science communityvalidates each theory before it is accepted. If newevidence is discovered that the theory does notaccommodate, the theory is generally modified in light ofthis new evidence. (HS-LS4-1)SE: Scientific Theories (p. 11); TestingNatural Selection (p. 396); EvaluatingEvolutionary Theory (p. 397)LS4.C: Adaptation•Evolution is a consequence of the interaction of fourfactors: (1) the potential for a species to increase innumber, (2) the genetic variation of individuals in aspecies due to mutation and sexual reproduction, (3)competition for an environment’s limited supply of theresources that individuals need in order to survive andreproduce, and (4) the ensuing proliferation of thoseorganisms that are better able to survive and reproduce inthat environment. (HS-LS4-2)SE/TE: Observations Aboard the Beagle(pp. 381–383); Variation and Adaptation(p. 388); Survival of the Fittest (p. 388);Common Descent (p. 391); Sources ofGenetic Variation (p. 407)•Natural selection leads to adaptation, that is, to apopulation dominated by organisms that are anatomically,behaviorally, and physiologically well suited to survive andreproduce in a specific environment. That is, thedifferential survival and reproduction of organisms in apopulation that have an advantageous heritable trait leadsto an increase in the proportion of individuals in futuregenerations that have the trait and to a decrease in theproportion of individuals that do not. (HS-LS4-3),(HS-LS4-4)SE/TE: Evolution by Natural Selection (pp.388–390)•Adaptation also means that the distribution of traits ina population can change when conditions change. (HS-LS4-3)SE/TE: Evolution Versus Genetic Equilibrium(p. 412); Isolating Mechanisms (pp. 414–415)•Changes in the physical environment, whethernaturally occurring or human induced, have thuscontributed to the expansion of some species, theemergence of new distinct species as populations divergeunder different conditions, and the decline–andsometimes the extinction–of some species. (HS-LS4-5),(HS-LS4-6)SE/TE: Genetic Drift (p. 411); Speciation inDarwin’s Finches (pp. 415–416)•Species become extinct because they can no longersurvive and reproduce in their altered environment. Ifmembers cannot adjust to change that is too fast ordrastic, the opportunity for the species’ evolution is lost.(HS-LS4-5)SE/TE: Speciation and Extinction (pp. 456–457)SE = Student <strong>Edition</strong>; TE = Teacher’s <strong>Edition</strong>; LMB = Lab Manual B 17
A Correlation of<strong>Miller</strong> & <strong>Levine</strong> <strong>Biology</strong>, <strong>Foundation</strong> <strong>Edition</strong>, ©2014to the Next Generation Science Standards, May 2013Grades 9-12LS4.D: Biodiversity and Humans•Humans depend on the living world for the resourcesand other benefits provided by biodiversity. But humanactivity is also having adverse impacts on biodiversitythrough overpopulation, overexploitation, habitatdestruction, pollution, introduction of invasive species,and climate change. Thus sustaining biodiversity so thatecosystem functioning and productivity are maintained isessential to supporting and enhancing life on Earth.Sustaining biodiversity also aids humanity by preservinglandscapes of recreational or inspirational value. (HS-LS4-6) (Note: This Disciplinary Core Idea is also addressed byHS-LS2-7.)SE/TE: The Value of Biodiversity (pp. 138–139); Threats to Biodiversity (pp. 140–141);Conserving Biodiversity (pp. 141–142);Ecology in Action (pp. 144–149)ETS1.B: Developing Possible Solutions•When evaluating solutions, it is important to take intoaccount a range of constraints, including cost, safety,reliability, and aesthetics, and to consider social, cultural,and environmental impacts. (secondary to HS-LS4-6)SE/TE: Appendix C (pp. A-16 and A-17)•Both physical models and computers can be used invarious ways to aid in the engineering design process.Computers are useful for a variety of purposes, such asrunning simulations to test different ways of solving aproblem or to see which one is most efficient oreconomical; and in making a persuasive presentation to aclient about how a given design will meet his or herneeds. (secondary to HS-LS4-6)*The performance expectations marked with an asterisk integrate traditional science content with engineering through a Practice orDisciplinary Core Idea.SE = Student <strong>Edition</strong>; TE = Teacher’s <strong>Edition</strong>; LMB = Lab Manual B 18
HS-ESS2 Earth’s SystemsA Correlation of<strong>Miller</strong> & <strong>Levine</strong> <strong>Biology</strong>, <strong>Foundation</strong> <strong>Edition</strong>, ©2014to the Next Generation Science Standards, May 2013Grades 9-12HS-ESS2 Earth’s SystemsStudents who demonstrate understanding can:HS-ESS2-2. Analyze geoscience data to make the claim that one change to Earth’s surface can create feedbacks that causechanges to other Earth’s systems. [Clarification Statement: Examples should include climate feedbacks, such as how an increase in greenhouse gases causes a rise inglobal temperatures that melts glacial ice, which reduces the amount of sunlight reflected from Earth’s surface, increasing surface temperatures and further reducing the amount ofice. Examples could also be taken from other system interactions, such as how the loss of ground vegetation causes an increase in water runoff and soil erosion; how dammed riversincrease groundwater recharge, decrease sediment transport, and increase coastal erosion; or how the loss of wetlands causes a decrease in local humidity that further reduces thewetland extent.]MILLER & LEVINE BIOLOGY, <strong>Foundation</strong> <strong>Edition</strong>: Lesson 6.1 (pp. 128–131) discusses the effects of agriculture, development, andindustry on Earth’s surface. In Lesson 6.2 (pp. 132–137), students learn how poor management of resources can lead to desertification anddeforestation. Case Study #3 in Lesson 6.4 (pp. 147–149) addresses the causes and effects of climate change.Students analyze geoscience data about how a change to Earth’s surface can cause changes to other Earth systems: Students use a mapof desertification risk to categorize the risk of desertification in their local area (TE p. 133). Students compare data on global land-surfaceair temperature, mean global sea ice, and global sea level (p. 147).HS-ESS2-4. Use a model to describe how variations in the flow of energy into and out of Earth’s systems result in changes inclimate. [Clarification Statement: Examples of the causes of climate change differ by timescale, over 1-10 years: large volcanic eruption, ocean circulation; 10-100s of years:changes in human activity, ocean circulation, solar output; 10-100s of thousands of years: changes to Earth's orbit and the orientation of its axis; and 10-100s of millions of years:long-term changes in atmospheric composition.] [Assessment Boundary: Assessment of the results of changes in climate is limited to changes in surface temperatures, precipitationpatterns, glacial ice volumes, sea levels, and biosphere distribution.]MILLER & LEVINE BIOLOGY, <strong>Foundation</strong> <strong>Edition</strong>: Lesson 3.4 (pp. 68–70) introduces the different types of processes that are involvedin biogeochemical cycles. In Lesson 4.1 (pp. 82–84), students study some factors that affect climate, including solar output. In Lesson 4.4(pp. 91–95), students learn about additional factors that affect climate, including ocean circulation. In Lesson 6.2 (p. 133), students learnhow deforestation can affect local climates. Case Study #3 in Lesson 6.4 (pp. 147–149) provides details about the effects of human activityon climate change. Lesson 19.3 (pp. 462–464) discusses long-term changes in atmospheric composition.Students use a model to describe how variations in energy flow can result in climate change: Students do a hands-on activity to model therelationship between latitude and solar energy (TE p. 83).HS-ESS2-6. Develop a quantitative model to describe the cycling of carbon among the hydrosphere, atmosphere, geosphere,and biosphere. [Clarification Statement: Emphasis is on modeling biogeochemical cycles that include the cycling of carbon through the ocean, atmosphere, soil, and biosphere(including humans), providing the foundation for living organisms.]MILLER & LEVINE BIOLOGY, <strong>Foundation</strong> <strong>Edition</strong>: The cycling of carbon between the biosphere, atmosphere, hydrosphere, andgeosphere is addressed in Lesson 3.4 (pp. 70–71). Certain aspects of the cycle are reinforced in Lesson 8.2 (pp. 196–197) and Lesson 9.1(pp. 213–214).HS-ESS2-7. Construct an argument based on evidence about the simultaneous coevolution of Earth’s systems and life onEarth. [Clarification Statement: Emphasis is on the dynamic causes, effects, and feedbacks between the biosphere and Earth’s other systems, whereby geoscience factors controlthe evolution of life, which in turn continuously alters Earth’s surface. Examples of include how photosynthetic life altered the atmosphere through the production of oxygen, which inturn increased weathering rates and allowed for the evolution of animal life; how microbial life on land increased the formation of soil, which in turn allowed for the evolution of landplants; or how the evolution of corals created reefs that altered patterns of erosion and deposition along coastlines and provided habitats for the evolution of new life forms.][Assessment Boundary: Assessment does not include a comprehensive understanding of the mechanisms of how the biosphere interacts with all of Earth’s other systems.]MILLER & LEVINE BIOLOGY, <strong>Foundation</strong> <strong>Edition</strong>: Lesson 19.1 (pp. 454–455) explains how changes in Earth’s physical environmentaffect life on Earth and how biological forces affect Earth’s physical environment. Lesson 22.1 (pp. 529–530) provides the specific example ofhow the evolution of plants changed the environment in ways that enabled new species to evolve. In Lesson 21.3 (pp. 509–510) and Lesson21.4 (pp. 517–519), students learn about the key roles photosynthetic protists and fungi play in support of aquatic and terrestrial life forms.Students construct an argument based on evidence about the coevolution of the biosphere and Earth’s other systems: Studentsexplain how the addition of oxygen to Earth’s atmosphere affected the evolution of life (Q15, p. 474).SE = Student <strong>Edition</strong>; TE = Teacher’s <strong>Edition</strong>; LMB = Lab Manual B 19
A Correlation of<strong>Miller</strong> & <strong>Levine</strong> <strong>Biology</strong>, <strong>Foundation</strong> <strong>Edition</strong>, ©2014to the Next Generation Science Standards, May 2013Grades 9-12The performance expectations above were developed using the following elements from the NRC document A Framework for K-12 Science Education:Science and Engineering Practices Disciplinary Core IdeasDeveloping and Using ModelsESS1.B: Earth and the Solar SystemModeling in 9–12 builds on K–8 experiences and•Cyclical changes in the shape of Earth’s orbit aroundprogresses to using, synthesizing, and developing models the sun, together with changes in the tilt of the planet’sto predict and show relationships among variablesaxis of rotation, both occurring over hundreds ofbetween systems and their components in the natural and thousands of years, have altered the intensity anddesigned world(s).distribution of sunlight falling on the earth. These•Develop a model based on evidence to illustrate the phenomena cause a cycle of ice ages and other gradualrelationships between systems or between components of climate changes. (secondary to HS-ESS2-4)a system. (HS-ESS2-6)Analyzing and Interpreting DataAnalyzing data in 9–12 builds on K–8 experiences andprogresses to introducing more detailed statisticalanalysis, the comparison of data sets for consistency, andthe use of models to generate and analyze data.•Analyze data using tools, technologies, and/or models(e.g., computational, mathematical) in order to make validand reliable scientific claims or determine an optimaldesign solution. (HS-ESS2-2)SE: Case Study #3 (p. 147)TE: Active Reading (p. 133)Engaging in Argument from EvidenceEngaging in argument from evidence in 9–12 builds on K–8 experiences and progresses to using appropriate andsufficient evidence and scientific reasoning to defend andcritique claims and explanations about the natural anddesigned world(s). Arguments may also come fromcurrent scientific or historical episodes in science.•Construct an oral and written argument or counterargumentsbased on data and evidence. (HS-ESS2-7)SE: Q15 (p. 474)--------------------------------------------------------Connections to Nature of ScienceScientific Knowledge is Based on EmpiricalEvidence•Science arguments are strengthened by multiple linesof evidence supporting a single explanation. (HS-ESS2-4)SE: Inquiry into Scientific Thinking (p. 95)TE: Science Support (p. 148)LMB: Comparing Atmospheres (pp. 283–284)ESS2.A: Earth Materials and Systems•Earth’s systems, being dynamic and interacting, causefeedback effects that can increase or decrease the originalchanges. (HS-ESS2-2)SE/TE: The Mysteries of Life’s Origins (pp.462–464); Ecological Footprints (pp. 143–144)•The geological record shows that changes to globaland regional climate can be caused by interactions amongchanges in the sun’s energy output or Earth’s orbit,tectonic events, ocean circulation, volcanic activity,glaciers, vegetation, and human activities. These changescan occur on a variety of time scales from sudden (e.g.,volcanic ash clouds) to intermediate (ice ages) to verylong-term tectonic cycles. (HS-ESS2-4)SE/TE: Life on a Changing Planet (pp. 454–455); Case Study #3, Climate Change (pp.147–149)ESS2.D: Weather and Climate•The foundation for Earth’s global climate systems isthe electromagnetic radiation from the sun, as well as itsreflection, absorption, storage, and redistribution amongthe atmosphere, ocean, and land systems, and thisenergy’s re-radiation into space. (HS-ESS2-4)SE/TE: Weather and Climate (p. 82);Factors That Affect Climate (pp. 82–84)•Gradual atmospheric changes were due to plants andother organisms that captured carbon dioxide andreleased oxygen. (HS-ESS2-6),(HS-ESS2-7)SE/TE: Production of Free Oxygen (p. 464)•Changes in the atmosphere due to human activityhave increased carbon dioxide concentrations and thusaffect climate. (HS-ESS2-6),(HS-ESS2-4)SE/TE: Case Study #3, Climate Change (pp.147–149)ESS2.E: Biogeology•The many dynamic and delicate feedbacks betweenthe biosphere and other Earth systems cause a continualco-evolution of Earth’s surface and the life that exists onit. (HS-ESS2-7)SE/TE: The Mysteries of Life’s Origins (pp.462–464); Autotrophic Protists (pp. 509–510); The Ecology of Fungi (pp. 517–519)Crosscutting ConceptsCause and Effect•Empirical evidence is required to differentiate betweencause and correlation and make claims about specificcauses and effects. (HS-ESS2-4)SE: Inquiry into Scientific Thinking (p. 95)LMB: Comparing Atmospheres (pp. 283–284)Energy and Matter•The total amount of energy and matter in closedsystems is conserved. (HS-ESS2-6)SE: Comparing Photosynthesis andRespiration (p. 215)TE: Active Reading (p. 222)Stability and Change•Much of science deals with constructing explanationsof how things change and how they remain stable. (HS-ESS2-7)SE: Q7 (p. 455); Q15 (p. 523)TE: Active Reading (p. 455); Speed Bump (p.464)•Feedback (negative or positive) can stabilize ordestabilize a system. (HS-ESS2-2)SE: Case Study #1 (p. 145)LMB: Vehicle Emission Trends (pp. 245–246)----------------------------------------Connections to Engineering, Technology,and Applications of ScienceInfluence of Engineering, Technology, and Scienceon Society and the Natural World•New technologies can have deep impacts on societyand the environment, including some that were notanticipated. Analysis of costs and benefits is a criticalaspect of decisions about technology. (HS-ESS2-2)TE: Building Scientific Literacy, STEM (p.126a)SE = Student <strong>Edition</strong>; TE = Teacher’s <strong>Edition</strong>; LMB = Lab Manual B 20
HS-ESS3 Earth and Human ActivityA Correlation of<strong>Miller</strong> & <strong>Levine</strong> <strong>Biology</strong>, <strong>Foundation</strong> <strong>Edition</strong>, ©2014to the Next Generation Science Standards, May 2013Grades 9-12HS-ESS3 Earth and Human ActivityStudents who demonstrate understanding can:HS-ESS3-1. Construct an explanation based on evidence for how the availability of natural resources, occurrence of naturalhazards, and changes in climate have influenced human activity. [Clarification Statement: Examples of key natural resources include access to freshwater (such as rivers, lakes, and groundwater), regions of fertile soils such as river deltas, and high concentrations of minerals and fossil fuels. Examples of natural hazards can befrom interior processes (such as volcanic eruptions and earthquakes), surface processes (such as tsunamis, mass wasting and soil erosion), and severe weather (such as hurricanes,floods, and droughts). Examples of the results of changes in climate that can affect populations or drive mass migrations include changes to sea level, regional patterns oftemperature and precipitation, and the types of crops and livestock that can be raised.]MILLER & LEVINE BIOLOGY, <strong>Foundation</strong> <strong>Edition</strong>: Lesson 5.2 (p. 114) explains how natural disasters are a limiting factor for populationgrowth. Lesson 6.2 (pp. 133–135) discusses the importance of freshwater for humans. Lesson 24.4 (pp. 593–594) focuses on the effect ofagriculture on human civilizations.Students construct an explanation for how natural resources, natural hazards, or climate influence human activity: Students explore howthe presence or absence of trees affected the inhabitants of Easter Island (pp. 127 and 154).HS-ESS3-3. Create a computational simulation to illustrate the relationships among management of natural resources, thesustainability of human populations, and biodiversity. [Clarification Statement: Examples of factors that affect the management of natural resources includecosts of resource extraction and waste management, per-capita consumption, and the development of new technologies. Examples of factors that affect human sustainability includeagricultural efficiency, levels of conservation, and urban planning.] [Assessment Boundary: Assessment for computational simulations is limited to using provided multi-parameterprograms or constructing simplified spreadsheet calculations.]MILLER & LEVINE BIOLOGY, <strong>Foundation</strong> <strong>Edition</strong>: Chapter 6 (pp. 128–142) discusses the effect of human activity on the environment.Students create a computational simulation to illustrate the relationship between management of natural resources and biodiversity:Students use mathematical and computational tools to analyze data about the genetic decline of alpine chipmunks due to climate changecaused by human activities (pp. 377a–377b).HS-ESS3-4. Evaluate or refine a technological solution that reduces impacts of human activities on natural systems.*[Clarification Statement: Examples of data on the impacts of human activities could include the quantities and types of pollutants released, changes to biomass and species diversity,or areal changes in land surface use (such as for urban development, agriculture and livestock, or surface mining). Examples for limiting future impacts could range from local efforts(such as reducing, reusing, and recycling resources) to large-scale geoengineering design solutions (such as altering global temperatures by making large changes to the atmosphereor ocean).]MILLER & LEVINE BIOLOGY, <strong>Foundation</strong> <strong>Edition</strong>: Lessons 6.1, 6.2, and 6.3 (pp. 128–142) focus on the impact of humans on theenvironment.Students evaluate or refine a technological solution that reduces impacts of human activities on natural systems: Students evaluateways to reduce dry trash (Inquiry into Scientific Thinking, p. 130). Students design a green roof system for a building (pp. 477a–477b).HS-ESS3-5. Analyze geoscience data and the results from global climate models to make an evidence-based forecast of thecurrent rate of global or regional climate change and associated future impacts to Earth systems. [Clarification Statement: Examples ofevidence, for both data and climate model outputs, are for climate changes (such as precipitation and temperature) and their associated impacts (such as on sea level, glacial icevolumes, or atmosphere and ocean composition).] [Assessment Boundary: Assessment is limited to one example of a climate change and its associated impacts.]MILLER & LEVINE BIOLOGY, <strong>Foundation</strong> <strong>Edition</strong>: Case Study #3 in Lesson 6.4 (pp. 147–149) addresses the causes and effects ofclimate change.Students analyze geoscience data about global climate change: Students compare data on air temperature, sea ice, sea level, andgreenhouse gas emissions (pp. 147–148).HS-ESS3-6. Use a computational representation to illustrate the relationships among Earth systems and how thoserelationships are being modified due to human activity. [Clarification Statement: Examples of Earth systems to be considered are the hydrosphere,atmosphere, cryosphere, geosphere, and/or biosphere. An example of the far-reaching impacts from a human activity is how an increase in atmospheric carbon dioxide results in anincrease in photosynthetic biomass on land and an increase in ocean acidification, with resulting impacts on sea organism health and marine populations.] [Assessment Boundary:Assessment does not include running computational representations but is limited to using the published results of scientific computational models.]SE = Student <strong>Edition</strong>; TE = Teacher’s <strong>Edition</strong>; LMB = Lab Manual B 21
A Correlation of<strong>Miller</strong> & <strong>Levine</strong> <strong>Biology</strong>, <strong>Foundation</strong> <strong>Edition</strong>, ©2014to the Next Generation Science Standards, May 2013Grades 9-12MILLER & LEVINE BIOLOGY, <strong>Foundation</strong> <strong>Edition</strong>: Lesson 3.4 (pp. 68–72) describes biogeochemical cycles. Lessons 6.1, 6.2, 6.3, and6.4 (pp. 128–149) address ways humans modify Earth’s systems.Students use computational representations to illustrate relationships among Earth’s systems: Students interpret data about the effectof rainfall on plant productivity (p. 78). Students interpret data on air pollution trends (Q5, p. 137). Students compare data on land-surfaceair temperature, global sea ice, and global sea level (p. 147).The performance expectations above were developed using the following elements from the NRC document A Framework for K-12 Science Education:Science and Engineering Practices Disciplinary Core IdeasAnalyzing and Interpreting DataESS2.D: Weather and ClimateAnalyzing data in 9–12 builds on K–8 experiences and •Current models predict that, although future regionalprogresses to introducing more detailed statisticalclimate changes will be complex and varied, averageanalysis, the comparison of data sets for consistency, and global temperatures will continue to rise. The outcomesthe use of models to generate and analyze data.predicted by global climate models strongly depend on the•Analyze data using computational models in order to amounts of human-generated greenhouse gases added tomake valid and reliable scientific claims. (HS-ESS3-5) the atmosphere each year and by the ways in which thesegases are absorbed by the ocean and biosphere.(secondary to HS-ESS3-6)SE: Case Study #3 (pp. 147–149)Using Mathematics and Computational ThinkingMathematical and computational thinking in 9-12 builds onK-8 experiences and progresses to using algebraicthinking and analysis, a range of linear and nonlinearfunctions including trigonometric functions, exponentialsand logarithms, and computational tools for statisticalanalysis to analyze, represent, and model data. Simplecomputational simulations are created and used based onmathematical models of basic assumptions.•Create a computational model or simulation of aphenomenon, designed device, process, or system. (HS-ESS3-3)SE: Unit 4 Project (pp. 377a–377b)•Use a computational representation of phenomena ordesign solutions to describe and/or support claims and/orexplanations. (HS-ESS3-6)SE/TE: Greenhouse Gases (p. 136); CaseStudy #3, Climate Change (p. 148)ESS3.A: Natural Resources•Resource availability has guided the development ofhuman society. (HS-ESS3-1)SE/TE: Sustainable Development (pp. 130–131); Soil Resources (pp. 132–133);Freshwater Resources (pp. 133–135);Agriculture (pp. 593–594)ESS3.B: Natural Hazards•Natural hazards and other geologic events haveshaped the course of human history; [they] havesignificantly altered the sizes of human populations andhave driven human migrations. (HS-ESS3-1)Crosscutting ConceptsCause and Effect•Empirical evidence is required to differentiate betweencause and correlation and make claims about specificcauses and effects. (HS-ESS3-1)SE: Inquiry into Scientific Thinking (p. 116)Systems and System Models•When investigating or describing a system, theboundaries and initial conditions of the system need to bedefined and their inputs and outputs analyzed anddescribed using models. (HS-ESS3-6)TE: Speed Bump (p. 7); Active Reading (p.135)Stability and Change•Change and rates of change can be quantified andmodeled over very short or very long periods of time.Some system changes are irreversible. (HS-ESS3-3),(HS-ESS3-5)SE: Case Study #1 (p. 145); Case Study #3(pp. 147–149)•Feedback (negative or positive) can stabilize ordestabilize a system. (HS-ESS3-4)SE: Use Science Graphics (p. 78); Q5 (p.137); Case Study #3 (p. 147)Constructing Explanations and Designing SolutionsConstructing explanations and designing solutions in 9–12builds on K–8 experiences and progresses to explanationsand designs that are supported by multiple andindependent student-generated sources of evidenceconsistent with scientific knowledge, principles, andtheories.•Construct an explanation based on valid and reliableevidence obtained from a variety of sources (includingstudents’ own investigations, models, theories,simulations, peer review) and the assumption thattheories and laws that describe the natural world operatetoday as they did in the past and will continue to do so inthe future. (HS-ESS3-1)SE: Chapter 6 mystery (pp. 127 and 154)•Design or refine a solution to a complex real-worldproblem, based on scientific knowledge, studentgeneratedsources of evidence, prioritized criteria, andtradeoff considerations. (HS-ESS3-4)SE: Inquiry into Scientific Thinking (p. 130);Unit 6 Project (pp. 477a–477b)ESS3.C: Human Impacts on Earth Systems•The sustainability of human societies and thebiodiversity that supports them requires responsiblemanagement of natural resources. (HS-ESS3-3)SE/TE: Sustainable Development (pp. 130–131); Using Resources Wisely (pp. 132–137);Ecology in Action (pp. 144–149)•Scientists and engineers can make major contributionsby developing technologies that produce less pollution andwaste and that preclude ecosystem degradation. (HS-ESS3-4)SE/TE: Using Resources Wisely (pp. 132–137); Conserving Biodiversity (pp. 141–142);Ecology in Action (pp. 144–149)ESS3.D: Global Climate Change•Though the magnitudes of human impacts are greaterthan they have ever been, so too are human abilities tomodel, predict, and manage current and future impacts.(HS-ESS3-5)SE/TE: Case Study #3, Climate Change (pp.147–149)•Through computer simulations and other studies,important discoveries are still being made about how theocean, the atmosphere, and the biosphere interact andare modified in response to human activities. (HS-ESS3-6)SE: Chapter 3 Mystery (pp. 55 and 78);Chapter 5 Mystery (pp. 107 and 124)-----------------------------------------------Connections to Engineering, Technology,and Applications of ScienceInfluence of Engineering, Technology, and Scienceon Society and the Natural World•Modern civilization depends on major technologicalsystems. (HS-ESS3-1),(HS-ESS3-3)SE: The Role of Technology (p. 10)TE: Activate Prior Knowledge (p. 126)•Engineers continuously modify these technologicalsystems by applying scientific knowledge and engineeringdesign practices to increase benefits while decreasingcosts and risks. (HS-ESS3-4)TE: Active Reading (p. 149)•New technologies can have deep impacts on societyand the environment, including some that were notanticipated. (HS-ESS3-3)SE: Q4 (p. 123)TE: Building Scientific Literacy, STEM (p.126a); Wrap-Up Activity (p. 142)SE = Student <strong>Edition</strong>; TE = Teacher’s <strong>Edition</strong>; LMB = Lab Manual B 22
A Correlation of<strong>Miller</strong> & <strong>Levine</strong> <strong>Biology</strong>, <strong>Foundation</strong> <strong>Edition</strong>, ©2014to the Next Generation Science Standards, May 2013Grades 9-12----------------------------------------------Connections to Nature of ScienceScientific Investigations Use a Variety of Methods•Science investigations use diverse methods and do notalways use the same set of procedures to obtain data.(HS-ESS3-5)•New technologies advance scientific knowledge. (HS-ESS3-5)TE: Speed Bump (p. 18); Building ScientificLiteracy, STEM (p. 126a); Science Support(p. 148)Scientific Knowledge is Based on EmpiricalEvidence•Science knowledge is based on empirical evidence.(HS-ESS3-5)SE: Case Study #3 (pp. 147–149)TE: Building Scientific Literacy, Writing (p.126a)•Science arguments are strengthened by multiple linesof evidence supporting a single explanation. (HS-ESS2-5)SE/TE: Case Study #1, Atmospheric Ozone(p. 145); Case Study #3, Climate Change(pp. 147–149)ETS1.B: Developing Possible Solutions•When evaluating solutions, it is important to take intoaccount a range of constraints, including cost, safety,reliability, and aesthetics, and to consider social, cultural,and environmental impacts. (secondary HS-ESS3-4)SE/TE: Appendix C, Technology & Design(pp. A-16 and A-17)----------------------------------------------Connections to Nature of ScienceScience is a Human Endeavor•Science is a result of human endeavors, imagination,and creativity. (HS-ESS3-3)SE: Scientific Methodology (pp. 5–7)TE: Activate Prior Knowledge (p. 2)SE: Case Study #3 (pp. 147–149)*The performance expectations marked with an asterisk integrate traditional science content with engineering through a Practice orDisciplinary Core Idea.SE = Student <strong>Edition</strong>; TE = Teacher’s <strong>Edition</strong>; LMB = Lab Manual B 23
HS-ETS1 Engineering DesignA Correlation of<strong>Miller</strong> & <strong>Levine</strong> <strong>Biology</strong>, <strong>Foundation</strong> <strong>Edition</strong>, ©2014to the Next Generation Science Standards, May 2013Grades 9-12HS-ETS1 Engineering DesignStudents who demonstrate understanding can:HS-ETS1-1. Analyze a major global challenge to specify qualitative and quantitative criteria and constraints for solutionsthat account for societal needs and wants.MILLER & LEVINE BIOLOGY, <strong>Foundation</strong> <strong>Edition</strong>: In Lesson 1.2 (p. 10), students learn that technology, science, and society are closelylinked. Lesson 1.2 (p. 12) describes the relationship between science and society. In Lesson 15.4 (pp. 367–369), students explore the ethicsand impacts of biotechnology.Students specify criteria and constraints for solutions that account for societal needs and wants: In the Unit 8 Project, Body Mechanics(pp. 711a–711b), students evaluate how medical technologies can account for the needs of people living with disabilities or chronicdiseases. Students analyze how cross-pollination affects the genetics of corn populations (Chapter 17 STEM activity, Pollination orContamination). Students analyze the factors involved with replacing a heart (Chapter 33 STEM activity, The Artificial Heart of the Matter).HS-ETS1-2. Design a solution to a complex real-world problem by breaking it down into smaller, more manageable problemsthat can be solved through engineering.MILLER & LEVINE BIOLOGY, <strong>Foundation</strong> <strong>Edition</strong>: In Appendix C, Technology & Design (pp. A-16 and A-17), students learn the generalprocess for designing a solution to a problem.Students design a solution to a complex real-world problem: In the Unit 6 Project, A Living Roof (pp. 477a–477b), students design agreen roof. Students redesign product packaging to reduce solid waste (Chapter 6 STEM activity, Redesign to Reduce Waste). Studentsdesign a mosquito net to help combat malaria outbreaks (Chapter 21 STEM activity, Malaria and Fungi). Students design technology to helpprotect workers from blood-borne pathogens (Chapter 35 STEM activity, Reducing the Spread of Blood-borne Pathogens).HS-ETS1-3. Evaluate a solution to a complex real-world problem based on prioritized criteria and trade-offs that account fora range of constraints, including cost, safety, reliability, and aesthetics, as well as possible social, cultural, andenvironmental impacts.MILLER & LEVINE BIOLOGY, <strong>Foundation</strong> <strong>Edition</strong>: In Appendix C, Technology & Design (pp. A-16 and A-17), students learn to evaluateconstraints and make trade-offs.Students evaluate a solution to a complex real-world problem: In the Unit 1 Project, Harnessing the Fear of Water (pp. 1a–1b), studentsdetermine the criteria for a technological solution to a specific problem. In the Unit 4 Project, Food Fight! (pp. 259a–259b), studentsevaluate the use of GM foods as a way to increase crop yields. In the Unit 8 Project, Body Mechanics (pp. 711a–711b), students identifythe criteria and constraints for a prosthetic limb.The performance expectations above were developed using the following elements from the NRC document A Framework for K-12 Science Education:Science and Engineering PracticesAsking Questions and Defining ProblemsAsking questions and defining problems in 9–12 builds onK–8 experiences and progresses to formulating, refining,and evaluating empirically testable questions and designproblems using models and simulations.•Analyze complex real-world problems by specifyingcriteria and constraints for successful solutions.(HS-ETS1-1)SE: Unit 8 Project (pp. 711a–711b)<strong>Biology</strong>.com: Chapter 17 STEM activity;Chapter 33 STEM activityDisciplinary Core IdeasETS1.A: Defining and Delimiting EngineeringProblems•Criteria and constraints also include satisfying anyrequirements set by society, such as taking issues of riskmitigation into account, and they should be quantified tothe extent possible and stated in such a way that one cantell if a given design meets them. (HS-ETS1-1)SE/TE: Science and Society (p. 12); Ethicsand Impacts of Biotechnology (pp. 367–369)•Humanity faces major global challenges today, such asthe need for supplies of clean water and food or forenergy sources that minimize pollution, which can beaddressed through engineering. These global challengesalso may have manifestations in local communities. (HS-ETS1-1)SE/TE: Using Resources Wisely (pp. 132–137)Connections to Engineering, Technology,and Applications of ScienceInfluence of Science, Engineering, and Technologyon Society and the Natural World•New technologies can have deep impacts on societyand the environment, including some that were notanticipated. Analysis of costs and benefits is a criticalaspect of decisions about technology. (HS-ETS1-1) (HS-ETS1-3)SE: Building Scientific Literacy, STEM (p.101)<strong>Biology</strong>.com: Chapter 14 STEM activity,Human Genomes and Medicine; Chapter 15STEM activity, Recombinant DNA inGenetically Modified Organisms; Chapter 31STEM activity, Technology and PhysicalDisabilitiesSE = Student <strong>Edition</strong>; TE = Teacher’s <strong>Edition</strong>; LMB = Lab Manual B 24
A Correlation of<strong>Miller</strong> & <strong>Levine</strong> <strong>Biology</strong>, <strong>Foundation</strong> <strong>Edition</strong>, ©2014to the Next Generation Science Standards, May 2013Grades 9-12Constructing Explanations and Designing SolutionsConstructing explanations and designing solutions in 9–12builds on K–8 experiences and progresses to explanationsand designs that are supported by multiple andindependent student-generated sources of evidenceconsistent with scientific ideas, principles and theories.•Design a solution to a complex real-world problem,based on scientific knowledge, student-generated sourcesof evidence, prioritized criteria, and tradeoffconsiderations. (HS-ETS1-2)SE: Unit 6 Project (pp. 477a–477b)<strong>Biology</strong>.com: Chapter 6 STEM activity;Chapter 21 STEM activity; Chapter 35 STEMactivityETS1.B: Developing Possible Solutions•When evaluating solutions, it is important to take intoaccount a range of constraints, including cost, safety,reliability, and aesthetics, and to consider social, cultural,and environmental impacts. (HS-ETS1-3)SE/TE: Appendix C (pp. A-16 and A-17)ETS1.C: Optimizing the Design Solution•Criteria may need to be broken down into simpler onesthat can be approached systematically, and decisionsabout the priority of certain criteria over others (tradeoffs)may be needed. (HS-ETS1-2)SE/TE: Appendix C (pp. A-16 and A-17)•Evaluate a solution to a complex real-world problem,based on scientific knowledge, student-generated sourcesof evidence, prioritized criteria, and tradeoffconsiderations. (HS-ETS1-3)SE: Unit 1 Project (pp. 1a–1b); Unit 4 Project(pp. 259a–259b); Unit 8 Project (pp. 711a–711b)SE = Student <strong>Edition</strong>; TE = Teacher’s <strong>Edition</strong>; LMB = Lab Manual B 25