rapport provisoire etude sur le bilan et les perspectives de la ...
rapport provisoire etude sur le bilan et les perspectives de la ...
rapport provisoire etude sur le bilan et les perspectives de la ...
- No tags were found...
Create successful ePaper yourself
Turn your PDF publications into a flip-book with our unique Google optimized e-Paper software.
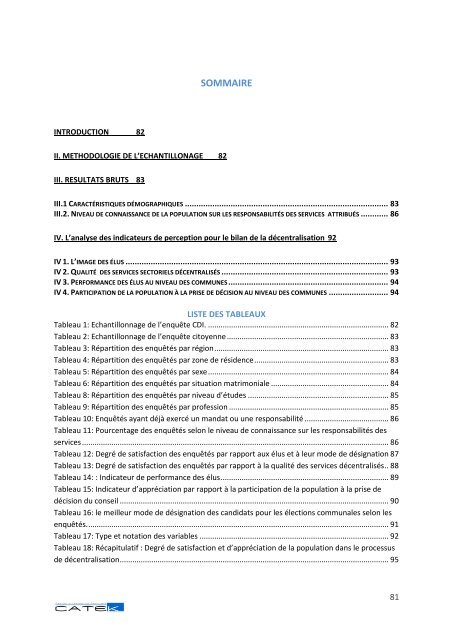
SOMMAIREINTRODUCTION 82II. METHODOLOGIE DE L’ECHANTILLONAGE 82III. RESULTATS BRUTS 83III.1 CARACTÉRISTIQUES DÉMOGRAPHIQUES ......................................................................................... 83III.2. NIVEAU DE CONNAISSANCE DE LA POPULATION SUR LES RESPONSABILITÉS DES SERVICES ATTRIBUÉS ............ 86IV. L’analyse <strong>de</strong>s indicateurs <strong>de</strong> perception pour <strong>le</strong> <strong>bi<strong>la</strong>n</strong> <strong>de</strong> <strong>la</strong> décentralisation 92IV 1. L’IMAGE DES ÉLUS ................................................................................................................... 93IV 2. QUALITÉ DES SERVICES SECTORIELS DÉCENTRALISÉS ......................................................................... 93IV 3. PERFORMANCE DES ÉLUS AU NIVEAU DES COMMUNES ...................................................................... 94IV 4. PARTICIPATION DE LA POPULATION À LA PRISE DE DÉCISION AU NIVEAU DES COMMUNES .......................... 94LISTE DES TABLEAUXTab<strong>le</strong>au 1: Echantillonnage <strong>de</strong> l’enquête CDI. ...................................................................................... 82Tab<strong>le</strong>au 2: Echantillonnage <strong>de</strong> l’enquête citoyenne ............................................................................. 83Tab<strong>le</strong>au 3: Répartition <strong>de</strong>s enquêtés par région ................................................................................... 83Tab<strong>le</strong>au 4: Répartition <strong>de</strong>s enquêtés par zone <strong>de</strong> rési<strong>de</strong>nce ................................................................ 83Tab<strong>le</strong>au 5: Répartition <strong>de</strong>s enquêtés par sexe ...................................................................................... 84Tab<strong>le</strong>au 6: Répartition <strong>de</strong>s enquêtés par situation matrimonia<strong>le</strong> ........................................................ 84Tab<strong>le</strong>au 8: Répartition <strong>de</strong>s enquêtés par niveau d’étu<strong>de</strong>s ................................................................... 85Tab<strong>le</strong>au 9: Répartition <strong>de</strong>s enquêtés par profession ............................................................................ 85Tab<strong>le</strong>au 10: Enquêtés ayant déjà exercé un mandat ou une responsabilité ........................................ 86Tab<strong>le</strong>au 11: Pourcentage <strong>de</strong>s enquêtés selon <strong>le</strong> niveau <strong>de</strong> connaissance <strong>sur</strong> <strong>le</strong>s responsabilités <strong>de</strong>sservices .................................................................................................................................................. 86Tab<strong>le</strong>au 12: Degré <strong>de</strong> satisfaction <strong>de</strong>s enquêtés par <strong>rapport</strong> aux élus <strong>et</strong> à <strong>le</strong>ur mo<strong>de</strong> <strong>de</strong> désignation 87Tab<strong>le</strong>au 13: Degré <strong>de</strong> satisfaction <strong>de</strong>s enquêtés par <strong>rapport</strong> à <strong>la</strong> qualité <strong>de</strong>s services décentralisés .. 88Tab<strong>le</strong>au 14: : Indicateur <strong>de</strong> performance <strong>de</strong>s élus ................................................................................ 89Tab<strong>le</strong>au 15: Indicateur d’appréciation par <strong>rapport</strong> à <strong>la</strong> participation <strong>de</strong> <strong>la</strong> popu<strong>la</strong>tion à <strong>la</strong> prise <strong>de</strong>décision du conseil ................................................................................................................................ 90Tab<strong>le</strong>au 16: <strong>le</strong> meil<strong>le</strong>ur mo<strong>de</strong> <strong>de</strong> désignation <strong>de</strong>s candidats pour <strong>le</strong>s é<strong>le</strong>ctions communa<strong>le</strong>s selon <strong>le</strong>senquêtés. ............................................................................................................................................... 91Tab<strong>le</strong>au 17: Type <strong>et</strong> notation <strong>de</strong>s variab<strong>le</strong>s .......................................................................................... 92Tab<strong>le</strong>au 18: Récapitu<strong>la</strong>tif : Degré <strong>de</strong> satisfaction <strong>et</strong> d’appréciation <strong>de</strong> <strong>la</strong> popu<strong>la</strong>tion dans <strong>le</strong> processus<strong>de</strong> décentralisation ................................................................................................................................ 9581


