THESE UNIQUE El Hassane Kéhien-Piho TOU - Nutridev
THESE UNIQUE El Hassane Kéhien-Piho TOU - Nutridev
THESE UNIQUE El Hassane Kéhien-Piho TOU - Nutridev

Create successful ePaper yourself
Turn your PDF publications into a flip-book with our unique Google optimized e-Paper software.
56<br />
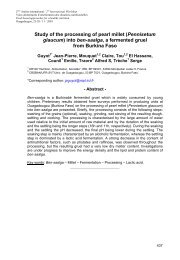
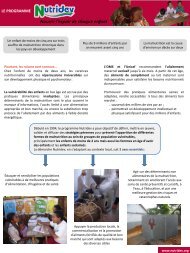
E.H. Tou et al. / International Journal of Food Microbiology 106 (2006) 52–60<br />
7<br />
SOAKING<br />
6<br />
5<br />
4<br />
pH<br />
SETTLING<br />
6<br />
5<br />
4<br />
3<br />
0 2 4 6 8 10 12 14 16 18 20 22 24 26<br />
Time (h)<br />
TPU1 TPU2 TPU3 TPU4<br />
TPU5 TPU6 TPU7 TPU8<br />
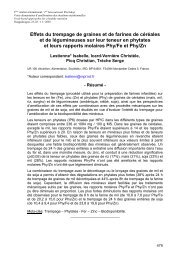
Fig. 2. Changes in pH during soaking and settling of the pearl millet grains in eight (1–8) traditional production units (TPU).<br />
3.3.1. Kinetics of substrate and product formation during the<br />
soaking step<br />
To characterize what could be the main substrates responsible<br />
for fermentation during the soaking step, changes in<br />
sugars (glucose, fructose, maltose, sucrose, melibiose, raffinose<br />
and stachyose) in the grains and in the soaking water<br />
(supernatant) were investigated in pilot scale experiments<br />
(PSE) (Fig. 3). The main sugars in the grains were sucrose<br />
(24.9 mmol/100 g DM), glucose (12.5 mmol/100 g DM),<br />
fructose (12.1 mmol/100 g DM) and raffinose (7.6 mmol/100 g<br />
DM). Their concentration decreased during soaking with the<br />
biggest changes in sucrose, fructose and glucose (Fig. 3).<br />
Glucose, fructose and maltose were the major mono- and<br />
disaccharides which appeared in the supernatant transiently<br />
between 2 and 12 h.<br />
Ethanol, acetic and lactic acids were identified as the<br />
fermentation products in the supernatant during the soaking<br />
step (Fig. 4). Surprisingly, ethanol was the main end-product<br />
and the same observation was made in samples taken from five<br />
different TPUs (Fig. 5). During the soaking step in both TPUs<br />
and PSEs, ethanol concentration increased to reach mean final<br />
values of 41 and 21 mM, respectively. From these results it can<br />
thus be inferred that the soaking step is dominated by alcoholic<br />
fermentation. The relatively limited production of lactic and<br />
acetic acids might account for the limited decrease in pH<br />
observed in poor buffering conditions. Furthermore, the first<br />
phase of the limited decrease in pH observed in TPU<br />
conditions (Fig. 2) may correspond to the period in which<br />
organic acid production is hardly detectable (up to 8 h) (Fig. 4).<br />
3.3.2. Kinetics of substrate and product formation during the<br />
settling step<br />
After the onset of the fermentation, only traces of maltose<br />
and a-galactosides were detected and the sugars initially<br />
present in the supernatant during the settling step (Fig. 6),<br />
mainly glucose (8.0 mM) and fructose (3.6 mM), decreased to<br />
reach mean final values of 0.43 and 0.02 mM, respectively.<br />
As a result of sugar fermentation, ethanol, acetic and lactic<br />
acids were formed during the settling step (Fig. 4). Lactic acid<br />
was the main fermentation product in both TPUs and PSEs<br />
(Fig. 7) and its concentration increased to reach mean final<br />
values of 35.4 and 31.0 mM, respectively. Furthermore, lactic<br />
acid production increased up to the end of fermentation (24 h)<br />
whereas ethanol production lasted only 8 h (Fig. 4).