THESE UNIQUE El Hassane Kéhien-Piho TOU - Nutridev
THESE UNIQUE El Hassane Kéhien-Piho TOU - Nutridev
THESE UNIQUE El Hassane Kéhien-Piho TOU - Nutridev

Create successful ePaper yourself
Turn your PDF publications into a flip-book with our unique Google optimized e-Paper software.
ARTICLE IN PRESS<br />
E.H. Tou et al. / LWT 40 (2007) 1561–1569 1565<br />
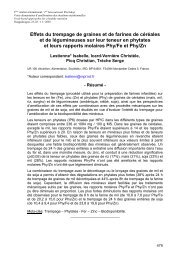
MG blend, the pH of the soaking water (supernatant)<br />
decreased in a similar way from an initial value around 6.0<br />
to a final value around 5.1 (Fig. 2A). As already mentioned<br />
by Tou et al. (2006), this indicates that initial fermentation<br />
occurs during the soaking step. Changes in sugar concentrations<br />
(glucose, fructose, maltose and melibiose) in the<br />
supernatant were investigated (Fig. 2B). The soaking step<br />
was characterized by an initial increase in glucose and<br />
fructose concentrations in the soaking medium due to<br />
sugar diffusion out of the grains, followed by a decrease in<br />
the concentrations of these sugars. At the end of soaking,<br />
glucose and fructose concentrations reached a value<br />
around 6.4 mmol/l. During the initial 12 h of soaking, the<br />
pH<br />
7<br />
6<br />
5<br />
increase in glucose and fructose concentrations occurred<br />
simultaneously with a decrease in pH (phase of slight<br />
acidification). One possible explanation is that the rate at<br />
which sugar diffuses out of the grains exceeds the rate of its<br />
utilization by the microbial flora which is still in the initial<br />
phase of growth. Changes in sugar concentrations in the<br />
soaking water of MG blend were similar to those observed<br />
during the soaking step in control (Tou et al., 2006).<br />
Changes were also observed in the concentrations of the<br />
main fermentation products (ethanol, lactate and acetate)<br />
in the supernatant (Fig. 2C). Ethanol and lactic acid<br />
concentrations increased significantly (Po0.001) during<br />
soaking to reach final values of 76 and 67 mmol/l,<br />
respectively. However, during the first 12 h, only ethanol<br />
was formed. After 12 h of soaking, lactic and acetic acids<br />
appeared and their concentrations increased simultaneously<br />
with that of ethanol, indicating the beginning of<br />
lactic acid fermentation (Fig. 2A). As was the case in the<br />
soaking of millet in ben-saalga processing (Tou et al.,<br />
2006), the soaking of the MG blend was dominated by<br />
alcoholic fermentation.<br />
B<br />
mmol/l<br />
4<br />
3<br />
14<br />
12<br />
10<br />
8<br />
6<br />
4<br />
2<br />
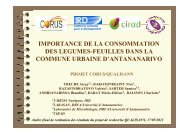
3.1.2. Settling step<br />
Changes in pH: A decrease in pH was observed during<br />
fermentation in both processing methods (traditional and<br />
CMI) (Fig. 3). Acidification profiles of pastes followed a<br />
classical pattern similar to that of other fermented cerealbased<br />
products (Kingamkono, Sjo¨gren, Svanberg, &<br />
Kaijser, 1994).<br />
In both processing methods, the pH decreased during<br />
fermentation from an initial value around 6.5 to a final<br />
value of around 4.0. Two phases of acidification were<br />
distinguished: the first one occurred during the first 6 h<br />
when the pH decreased from 6.5 to 4.7, followed by a<br />
second phase of slower acidification (from 6 to 24 h), that<br />
7<br />
C<br />
mmol/l<br />
0<br />
80<br />
70<br />
60<br />
50<br />
40<br />
30<br />
20<br />
10<br />
0<br />
0 4 8 12 16<br />
Soaking time (h)<br />
Fig. 2. Changes in pH (A) (E: millet-groundnut and B: millet) and<br />
concentrations of sugar; (B) (B: glucose, ’: fructose, n: melibiose and<br />
m: maltose), ethanol, lactate and acetate; (C) (B: lactate, E: ethanol and<br />
n: acetate) in the soaking water of millet–groundnut blend. Bars indicate<br />
standard deviation.<br />
pH<br />
6<br />
5<br />
4<br />
3<br />
0 5 10 15 20 25<br />
Fermentation time (h)<br />
Fig. 3. Changes in pH during the fermentation step in MG-T and MG-<br />
CMI processing methods (m: MG-T and B: MG-CMI). Bars indicate<br />
standard deviation.