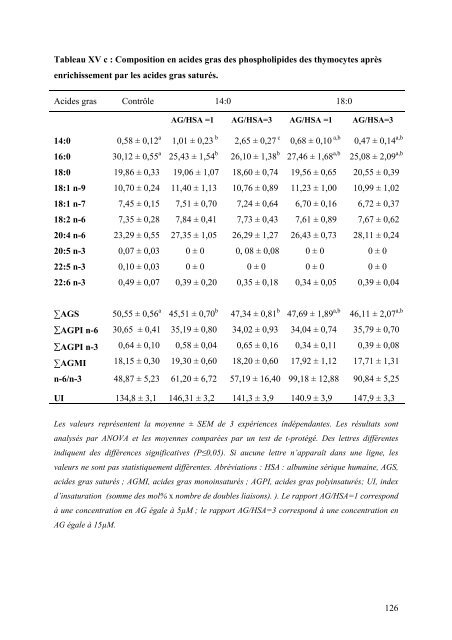
Tableau XV c : Composition en aci<strong>de</strong>s gras <strong>de</strong>s phospholipi<strong>de</strong>s <strong>de</strong>s thymocytes après enrichissement par les aci<strong>de</strong>s gras saturés. Aci<strong>de</strong>s gras Contrôle 14:0 18:0 AG/HSA =1 AG/HSA=3 AG/HSA =1 AG/HSA=3 14:0 0,58 ± 0,12 a 1,01 ± 0,23 b 2,65 ± 0,27 c 0,68 ± 0,10 a,b 0,47 ± 0,14 a,b 16:0 18:0 18:1 n-9 18:1 n-7 18:2 n-6 20:4 n-6 20:5 n-3 22:5 n-3 22:6 n-3 30,12 ± 0,55 a 19,86 ± 0,33 10,70 ± 0,24 7,45 ± 0,15 7,35 ± 0,28 23,29 ± 0,55 0,07 ± 0,03 0,10 ± 0,03 0,49 ± 0,07 25,43 ± 1,54 b 19,06 ± 1,07 11,40 ± 1,13 7,51 ± 0,70 7,84 ± 0,41 27,35 ± 1,05 0 ± 0 0 ± 0 0,39 ± 0,20 26,10 ± 1,38 b 18,60 ± 0,74 10,76 ± 0,89 7,24 ± 0,64 7,73 ± 0,43 26,29 ± 1,27 0, 08 ± 0,08 0 ± 0 0,35 ± 0,18 27,46 ± 1,68 a,b 19,56 ± 0,65 11,23 ± 1,00 6,70 ± 0,16 7,61 ± 0,89 26,43 ± 0,73 0 ± 0 0 ± 0 0,34 ± 0,05 25,08 ± 2,09 a,b 20,55 ± 0,39 10,99 ± 1,02 6,72 ± 0,37 7,67 ± 0,62 28,11 ± 0,24 0 ± 0 0 ± 0 0,39 ± 0,04 ∑AGS ∑AGPI n-6 ∑AGPI n-3 ∑AGMI 50,55 ± 0,56 a 30,65 ± 0,41 0,64 ± 0,10 18,15 ± 0,30 45,51 ± 0,70 b 35,19 ± 0,80 0,58 ± 0,04 19,30 ± 0,60 47,34 ± 0,81 b 34,02 ± 0,93 0,65 ± 0,16 18,20 ± 0,60 47,69 ± 1,89 a,b 34,04 ± 0,74 0,34 ± 0,11 17,92 ± 1,12 46,11 ± 2,07 a,b 35,79 ± 0,70 0,39 ± 0,08 17,71 ± 1,31 n-6/n-3 48,87 ± 5,23 61,20 ± 6,72 57,19 ± 16,40 99,18 ± 12,88 90,84 ± 5,25 UI 134,8 ± 3,1 146,31 ± 3,2 141,3 ± 3,9 140.9 ± 3,9 147,9 ± 3,3 Les valeurs représentent la moyenne ± SEM <strong>de</strong> 3 expériences indépendantes. Les résultats sont analysés par ANOVA <strong>et</strong> les moyennes comparées par un test <strong>de</strong> t-protégé. Des l<strong>et</strong>tres différentes indiquent <strong>de</strong>s différences significatives (P≤0,05). Si aucune l<strong>et</strong>tre n’apparaît dans une ligne, les valeurs ne sont pas statistiquement différentes. Abréviations : HSA : albumine sérique humaine, AGS, aci<strong>de</strong>s gras saturés ; AGMI, aci<strong>de</strong>s gras monoinsaturés ; AGPI, aci<strong>de</strong>s gras polyinsaturés; UI, in<strong>de</strong>x d’insaturation (somme <strong>de</strong>s mol% x nombre <strong>de</strong> doubles liaisons). ). Le rapport AG/HSA=1 correspond à une concentration en AG égale à 5µM ; le rapport AG/HSA=3 correspond à une concentration en AG égale à 15µM. 126
PBut (%<strong>de</strong> la radioactivité <strong>de</strong>s phospholipi<strong>de</strong>s totaux) 0.35 0.30 0.25 0.20 0.15 0.10 0.05 0 non stimulés stimulés avec la ConA contrôle 1 3 contrôle 1 3 22:6n -3 20:5n -3 18:1n -9 18:2n -6 14:0 18:0 Aci<strong>de</strong> gras/albumine Figure 35 : Eff<strong>et</strong>s <strong>de</strong>s aci<strong>de</strong>s gras in vitro sur l’activité phospholipase D <strong>de</strong>s thymocytes. Les cellules marquées avec une dose traceuse d’aci<strong>de</strong> arachidonique tritié sont suspendues à une concentration <strong>de</strong> 40 x 10 6 cellules/ ml. Elles sont incubées pendant 2h à 37°C avec <strong>de</strong> l’albumine seule (HSA 5µM) ou avec les différents complexes aci<strong>de</strong> gras-albumine (rapports 1 <strong>et</strong> 3 correspondant à 5 <strong>et</strong> 15 µM d’aci<strong>de</strong> gras, respectivement). Les cellules sont incubées en présence ou absence <strong>de</strong> butanol- 1 (concentration finale <strong>de</strong> 1%) pendant 20 min, puis 5 min avec ou sans ConA (1µg/ 10 6 cellules). La réaction est arrêtée par extraction <strong>de</strong>s lipi<strong>de</strong>s puis l’extrait lipidique est séparé par CCM bidimensionnelle comme décrit dans Matériels <strong>et</strong> Métho<strong>de</strong>s. La radioactivité associée au phosphatidylbutanol est exprimée en pourcentage <strong>de</strong> la radioactivité associée aux phospholipi<strong>de</strong>s totaux. Les résultats sont la moyenne ± SEM <strong>de</strong> 3 expériences indépendantes. Les résultats statistiques <strong>de</strong> l‘analyse <strong>de</strong> variance à <strong>de</strong>ux voies sont les suivants : 22:6n-3 :eff<strong>et</strong> aci<strong>de</strong> gras vs contrôle : F=12,90, P=0,0001 ; eff<strong>et</strong> ConA vs non stimulé : F=18,31, P=0,0002. 20:5n-3 :eff<strong>et</strong> aci<strong>de</strong> gras vs contrôle : F=0,44, NS ; eff<strong>et</strong> ConA vs non stimulé : F=8,94, P=0,007. 18:1n-9 :eff<strong>et</strong> aci<strong>de</strong> gras vs contrôle : F=2,38, NS ; eff<strong>et</strong> ConA vs non stimulé : F=18,94, P=0,0002. 18:2n-6 :eff<strong>et</strong> aci<strong>de</strong> gras vs contrôle : F=12,53, P=0,0002 ; eff<strong>et</strong> ConA vs non stimulé : F=24,13, P
- Page 1 and 2:
N° : 2006-ISAL-0031 ANNEE 2006 THE
- Page 3 and 4:
GOUTTE R. (Prof. émérite) CREATIS
- Page 5 and 6:
SIGLE ECOLE DOCTORALE NOM ET COORDO
- Page 7 and 8:
Dédicace Je dédie ce travail A me
- Page 9 and 10:
Je remercie également Mme Madelein
- Page 11 and 12:
AVANT-PROPOS Le travail présenté
- Page 13 and 14:
TABLE DES MATIERES REMERCIEMENTS...
- Page 15 and 16:
II-3-5-1 Huile d’olive...........
- Page 17 and 18:
IV-1-3-4 Distribution de la protéi
- Page 19 and 20:
Figure 26 : Gradient de saccharose
- Page 21 and 22:
Tableau XX : Effet des régimes sur
- Page 23 and 24:
MAP Kinase: Mitogen Activated Prote
- Page 25 and 26:
al., 1998 ; Steed et al., 1998). Le
- Page 27 and 28:
II- Rappels bibliographiques II-1-
- Page 29 and 30:
Figure 1 : Hématopoïèse du syst
- Page 31 and 32:
Tableau I : Antigènes couramment u
- Page 33 and 34:
Il existe cinq classes d’immunogl
- Page 35 and 36:
II-1-3-2-3 Les lymphocytes non T no
- Page 37 and 38:
Par la suite, de telles structures
- Page 39 and 40:
II-1-4-2 La composition des radeaux
- Page 41 and 42:
acylation (N-palmitoylation et S-my
- Page 43 and 44:
Tableau IV : Techniques d’analyse
- Page 45 and 46:
distingue d’une seconde zone de l
- Page 47 and 48:
essentiel du DAG est d’activer le
- Page 49 and 50:
R1 -O- R2 -O- Transphosphatidylatio
- Page 51 and 52:
II-2-4 Clonage et caractérisation
- Page 53 and 54:
Figure 8: Représentation schémati
- Page 55 and 56:
II-2-5-3 Les domaines PH et PX Il e
- Page 57 and 58:
Tableau VI: Caractéristiques des P
- Page 59 and 60:
Figure 10: La superfamille des prot
- Page 61 and 62:
Figure 11: la famille des PKC. En u
- Page 63 and 64:
phosphatidylinositol-4-monophosphat
- Page 65 and 66:
auteurs, PLD2 serait la forme préd
- Page 67 and 68:
prolifération, la croissance cellu
- Page 69 and 70:
II-3-2 Nomenclature des AG La nomen
- Page 71 and 72:
II-3-3 Les acides gras essentiels (
- Page 73 and 74:
II-3-4-3 Rôle fonctionnel II-3-4-3
- Page 75 and 76: Tableau IX: Distribution (mole %) d
- Page 77 and 78: II-3-5-1 Huile d’olive Le Maroc e
- Page 79 and 80: L’analyse de la composition en AG
- Page 81 and 82: 1998; Kelley, 2001; Calder et al.,
- Page 83 and 84: (1991) ont montré que les AGS ont
- Page 85 and 86: uniquement chez les lymphocytes pro
- Page 87 and 88: II-3-7-1 Effets des AG sur la synth
- Page 89 and 90: II-3-7-2 Effets des AG sur les rade
- Page 91 and 92: II-3-7-3 Effets des AG sur la struc
- Page 93 and 94: Tableau XI : Influence des régimes
- Page 95 and 96: III- MATERIELS ET METHODES III-1 Ma
- Page 97 and 98: III-2 Méthodes III-2-1 Préparatio
- Page 99 and 100: III-2-2 Préparation des échantill
- Page 101 and 102: A B Figure 23: A : Métabolisme du
- Page 103 and 104: III-2-5-4 Séparation du Pbut et du
- Page 105 and 106: III-2-7 Analyse de la composition e
- Page 107 and 108: croissantes (0.2M à 0.9M), puis l
- Page 109 and 110: éalisée dans les mêmes condition
- Page 111 and 112: vortexé avant d'être coulé. Apr
- Page 113 and 114: Tableau XIII: Séquence des amorces
- Page 115 and 116: IV- RESULTATS IV-1 Effet des acides
- Page 117 and 118: Viabilité cellulaire (% du contrô
- Page 119 and 120: métaboliquement stable et sa synth
- Page 121 and 122: 14 Activité PLD (pmoles de PC hydr
- Page 123 and 124: L’ensemble des résultats concern
- Page 125: Tableau XV b: Composition en acides
- Page 129 and 130: Prolifération des thymocytes (D.O5
- Page 131 and 132: IV-1-3-2 Détection du PIP2 Le PIP2
- Page 133 and 134: 1,0 45 0,9 40 Phospholipides (mg/ml
- Page 135 and 136: IV-1-4-2 Effet des AG sur la locali
- Page 137 and 138: L’huile de poisson constitue une
- Page 139 and 140: IV-2-2 Effets des régimes sur la c
- Page 141 and 142: acide gras est indétectable dans l
- Page 143 and 144: Tableau XIX : Effet des régimes su
- Page 145 and 146: IV-2-4 Effets des régimes sur la r
- Page 147 and 148: Proportion de 18:2(n-6) dans les ph
- Page 149 and 150: [ 3 H]Pbut (% de la radioactivité
- Page 151 and 152: A PLD1 PLD1 / tubulin (unités arbi
- Page 153 and 154: V- Discussion De nombreuses études
- Page 155 and 156: augmentent significativement l’ac
- Page 157 and 158: 16:1n-7, 18:1n-9 et 18:1n-7) plus f
- Page 159 and 160: posait alors de savoir quelle isofo
- Page 161 and 162: Cependant, il a été observé réc
- Page 163 and 164: VII- Références bibliographiques
- Page 165 and 166: BERGER, A., GERMAN, J. B., CHIANG,
- Page 167 and 168: BOWMAN, E. P., UHLINGER, D. J., LAM
- Page 169 and 170: CALDER, P. C., COSTA-ROSA, L. F., C
- Page 171 and 172: BOLLAG, W. B., FROHMAN, M. A. Cloni
- Page 173 and 174: DIAZ, O., BERQUAND, A., DUBOIS, M.,
- Page 175 and 176: FOWLER, K. H., MCMURRAY, D. N., FAN
- Page 177 and 178:
and Lipid Mediator Profiles and Pro
- Page 179 and 180:
HOREJSI, V. The Roles of Membrane M
- Page 181 and 182:
JIANG, C., TING, A. T., SEED, B. Pp
- Page 183 and 184:
KHAN, N. A., HICHAMI, A. Ionotrophi
- Page 185 and 186:
KTISTAKIS, N. T., BROWN, H. A., WAT
- Page 187 and 188:
LIU, Y., CASEY, L., PIKE, L. J. Com
- Page 189 and 190:
MILES, E. A., CALDER, P. C. Modulat
- Page 191 and 192:
NISHIZUKA, Y. The Molecular Heterog
- Page 193 and 194:
PLEVIN, R., COOK, S. J., PALMER, S.
- Page 195 and 196:
SCHERER, P. E., OKAMOTO, T., CHUN,
- Page 197 and 198:
SMART, E. J., GRAF, G. A., MCNIVEN,
- Page 199 and 200:
TEITELBAUM, J. E., ALLAN WALKER, W.
- Page 201 and 202:
Docosahexaenoic Acid on Proliferati
- Page 203 and 204:
YAQOOB, P. Fatty Acids and the Immu
- Page 205:
RESUME L’huile d’argan est extr