Segmentation d'images couleur par un opérateur gradient vectoriel ...
Segmentation d'images couleur par un opérateur gradient vectoriel ...
Segmentation d'images couleur par un opérateur gradient vectoriel ...

You also want an ePaper? Increase the reach of your titles
YUMPU automatically turns print PDFs into web optimized ePapers that Google loves.
QUANTIFICATION ET MORPHOLOGIE DE PHASES DE CLINKER PAR ANALYSE D'IMAGE.<br />
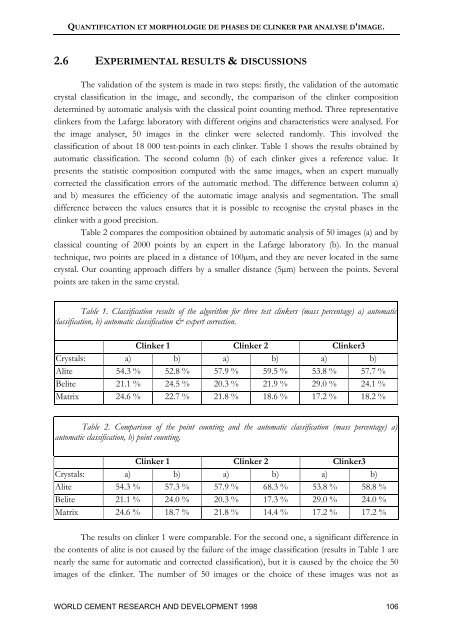
2.6 EXPERIMENTAL RESULTS & DISCUSSIONS<br />
The validation of the system is made in two steps: firstly, the validation of the automatic<br />
crystal classification in the image, and secondly, the com<strong>par</strong>ison of the clinker composition<br />
determined by automatic analysis with the classical point co<strong>un</strong>ting method. Three representative<br />
clinkers from the Lafarge laboratory with different origins and characteristics were analysed. For<br />
the image analyser, 50 images in the clinker were selected randomly. This involved the<br />
classification of about 18 000 test-points in each clinker. Table 1 shows the results obtained by<br />
automatic classification. The second column (b) of each clinker gives a reference value. It<br />
presents the statistic composition computed with the same images, when an expert manually<br />
corrected the classification errors of the automatic method. The difference between column a)<br />
and b) measures the efficiency of the automatic image analysis and segmentation. The small<br />
difference between the values ensures that it is possible to recognise the crystal phases in the<br />
clinker with a good precision.<br />
Table 2 com<strong>par</strong>es the composition obtained by automatic analysis of 50 images (a) and by<br />
classical co<strong>un</strong>ting of 2000 points by an expert in the Lafarge laboratory (b). In the manual<br />
technique, two points are placed in a distance of 100µm, and they are never located in the same<br />
crystal. Our co<strong>un</strong>ting approach differs by a smaller distance (5µm) between the points. Several<br />
points are taken in the same crystal.<br />
Table 1. Classification results of the algorithm for three test clinkers (mass percentage) a) automatic<br />
classification, b) automatic classification & expert correction.<br />
Clinker 1 Clinker 2 Clinker3<br />
Crystals: a) b) a) b) a) b)<br />
Alite 54.3 % 52.8 % 57.9 % 59.5 % 53.8 % 57.7 %<br />
Belite 21.1 % 24.5 % 20.3 % 21.9 % 29.0 % 24.1 %<br />
Matrix 24.6 % 22.7 % 21.8 % 18.6 % 17.2 % 18.2 %<br />
Table 2. Com<strong>par</strong>ison of the point co<strong>un</strong>ting and the automatic classification (mass percentage) a)<br />
automatic classification, b) point co<strong>un</strong>ting.<br />
Clinker 1 Clinker 2 Clinker3<br />
Crystals: a) b) a) b) a) b)<br />
Alite 54.3 % 57.3 % 57.9 % 68.3 % 53.8 % 58.8 %<br />
Belite 21.1 % 24.0 % 20.3 % 17.3 % 29.0 % 24.0 %<br />
Matrix 24.6 % 18.7 % 21.8 % 14.4 % 17.2 % 17.2 %<br />
The results on clinker 1 were com<strong>par</strong>able. For the second one, a significant difference in<br />
the contents of alite is not caused by the failure of the image classification (results in Table 1 are<br />
nearly the same for automatic and corrected classification), but it is caused by the choice the 50<br />
images of the clinker. The number of 50 images or the choice of these images was not as<br />
WORLD CEMENT RESEARCH AND DEVELOPMENT 1998 106