

Le Cirad en 2006
Le Cirad en 2006
Le Cirad en 2006

Create successful ePaper yourself
Turn your PDF publications into a flip-book with our unique Google optimized e-Paper software.
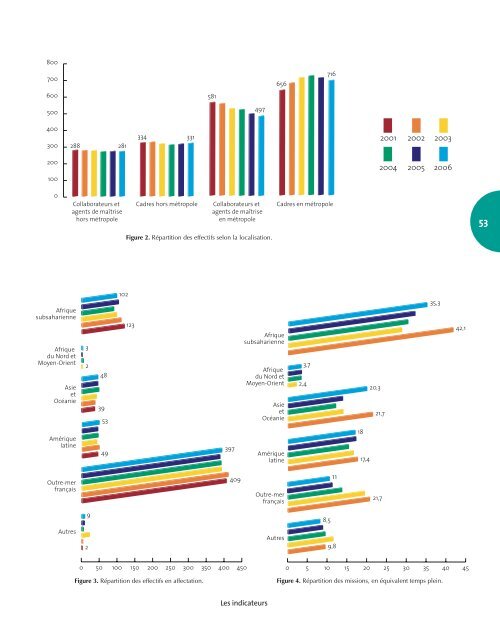
800<br />
700<br />
656<br />
716<br />
600<br />
581<br />
500<br />
497<br />
400<br />
300<br />
288 281<br />
334 331<br />
2001 2002 2003<br />
200<br />
2004 2005 <strong>2006</strong><br />
100<br />
0<br />
Collaborateurs et<br />
ag<strong>en</strong>ts de maîtrise<br />
hors métropole<br />
Cadres hors métropole<br />
Collaborateurs et<br />
ag<strong>en</strong>ts de maîtrise<br />
<strong>en</strong> métropole<br />
Cadres <strong>en</strong> métropole<br />
53<br />
Figure 2. Répartition des effectifs selon la localisation.<br />
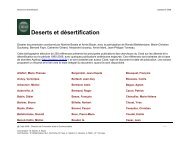
Afrique<br />
subsahari<strong>en</strong>ne<br />
Afrique<br />
du Nord et<br />
Moy<strong>en</strong>-Ori<strong>en</strong>t<br />
Asie<br />
et<br />
Océanie<br />
3<br />
2<br />
48<br />
39<br />
53<br />
102<br />
123<br />
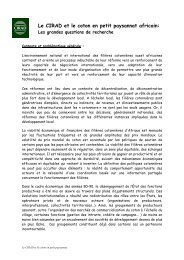
Afrique<br />
subsahari<strong>en</strong>ne<br />
Afrique<br />
du Nord et<br />
Moy<strong>en</strong>-Ori<strong>en</strong>t<br />
Asie<br />
et<br />
Océanie<br />
3,7<br />
2,4<br />
20,3<br />
21,7<br />
35,3<br />
42,1<br />
Amérique<br />
latine<br />
49<br />
397<br />
Amérique<br />
latine<br />
18<br />
17,4<br />
Outre-mer<br />
français<br />
409<br />
Outre-mer<br />
français<br />
11<br />
21,7<br />
9<br />
8,5<br />
Autres<br />
2<br />
Autres<br />
9,8<br />
0 50 100 150 200 250 300 350 400 450<br />
0 5 10 15 20 25 30 35 40 45<br />
Figure 3. Répartition des effectifs <strong>en</strong> affectation.<br />
Figure 4. Répartition des missions, <strong>en</strong> équival<strong>en</strong>t temps plein.<br />
<strong>Le</strong>s indicateurs


![Version française [pdf, 376,65 ko] - Cirad](https://img.yumpu.com/26838166/1/184x260/version-franaaise-pdf-37665-ko-cirad.jpg?quality=85)
![VIP N°4 [FR] - Cirad](https://img.yumpu.com/26838163/1/184x260/vip-na4-fr-cirad.jpg?quality=85)


![VIP N.4 [ESP]--> PDF - Cirad](https://img.yumpu.com/26838123/1/184x260/vip-n4-esp-pdf-cirad.jpg?quality=85)
![Version française [pdf, 493,34 ko] - Cirad](https://img.yumpu.com/26838117/1/184x260/version-franaaise-pdf-49334-ko-cirad.jpg?quality=85)
![Version française [pdf, 180,31 ko] - Cirad](https://img.yumpu.com/26838111/1/184x260/version-franaaise-pdf-18031-ko-cirad.jpg?quality=85)
![VIP N.3 [GB]-->WEB - Cirad](https://img.yumpu.com/26838098/1/184x260/vip-n3-gb-web-cirad.jpg?quality=85)