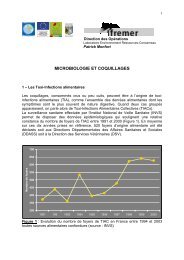
La cartographie et les analyses spatiales avec R
La cartographie et les analyses spatiales avec R
La cartographie et les analyses spatiales avec R
SHOW LESS

You also want an ePaper? Increase the reach of your titles
YUMPU automatically turns print PDFs into web optimized ePapers that Google loves.
S. Roch<strong>et</strong>te ValorIg – 9-10 octobre 2012 Les données spatia<strong>les</strong> dans R<br />
3. Visualisation<br />
→ Visualisation des rasters<br />
– plot / image [raster]<br />
plot(RastMean_proj,col=rainbow(30,start=1/6)[30:1])<br />
color