maenas (intertidal zone) and Segonzacia mesatlantica - Station ...
maenas (intertidal zone) and Segonzacia mesatlantica - Station ...
maenas (intertidal zone) and Segonzacia mesatlantica - Station ...

Create successful ePaper yourself
Turn your PDF publications into a flip-book with our unique Google optimized e-Paper software.
172 Current Protein <strong>and</strong> Peptide Science, 2008, Vol. 9, No. 2 Bruneaux et al.<br />
(a)<br />
4000<br />
Lt<br />
y = 1,807x - 2318<br />
R 2 = 0,8485<br />
MALLS mass (kDa)<br />
3800<br />
3600<br />
Rp<br />
Md<br />
Am<br />
Ms<br />
Am<br />
Ac<br />
Ap<br />
Pg<br />
Pp<br />
Lt<br />
y = 1,0576x + 46,043<br />
R 2 = 0,9582<br />
3400<br />
Tj<br />
y = 1,1252x - 304,64<br />
R 2 = 0,9971<br />
Ev<br />
3200<br />
3200 3400 3600 3800<br />
Model mass (kDa)<br />
4000<br />
(b)<br />
16<br />
Group 3<br />
14<br />
∆(MALLS mass – model mass) %<br />
12<br />
10<br />
8<br />
6<br />
4<br />
2<br />
(12)<br />
Group 1<br />
(6)<br />
Group 2<br />
0<br />
Fig. (8). Self-association properties of AmHb.<br />
Self-association properties of AmHb followed by MALLS detector<br />
during the elution on a gel exclusion column (Superose 6-C). The<br />
solid curve represents the refractive index (RI) profile overlaid with<br />
the dotted curve which represents the light scattering profil at 90°<br />
(LS), versus the retention time. The red curves set for AmHb after<br />
dissociation <strong>and</strong> the blue curves set for AmHb after reassociation.<br />
(a) AmHb immediately after exposure in 0.1 M Tris-HCl buffer pH<br />
8.0 <strong>and</strong> immediately reassociated. (b) AmHb dissociated immediately<br />
after exposure in 0.1 M Tris-HCl buffer pH 9.0 <strong>and</strong> immediately<br />
reassociated. (c) AmHb dissociated in 0.1 M Tris-HCl buffer<br />
pH 8.0 after 1 hour <strong>and</strong> reassociated. The percentages of HBL are<br />
indicated after dissociation (red) <strong>and</strong> after reassociation (blue).<br />
They are calculated from the integration of HPLC chromatogram at<br />
414 nm.<br />
7. INVESTIGATING RESPIRATORY PIGMENT DI-<br />
VERSITY AMONG PHYLA<br />
7.1. HBL-Hb Diversity in Annelids<br />
Annelid HBL-Hbs share the same global quaternary<br />
structure, as demonstrated by the typical shape observed in<br />
electron microscopy for these molecules. However, precise<br />
structural studies <strong>and</strong> three-dimensional reconstructions of<br />
their volume in the recent years shed light on high diversity<br />
among the different groups. Table 1 presents available data<br />
- 2<br />
Ev Cm Tj Ac Am Cm Lt Rp Ms Pp Am Pg Ap Md Lt<br />
Species<br />
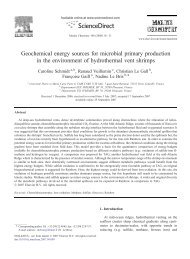
Fig. (9). Comparison between native mass (MALLS) <strong>and</strong> model<br />
mass (ESI-MS).<br />
Comparison between measured native mass determined by MALLS<br />
<strong>and</strong> model mass calculated from ESI-MS data. The masses are<br />
taken from in Table 1. (a) Plot of MALLS mass versus model mass<br />
for annelid HBL-Hbs. The dashed line corresponds to equality between<br />
MALLS <strong>and</strong> model masses. The three linear regression displayed<br />
were performed on each group mentioned in (b). (b) Relative<br />
difference between MALLS <strong>and</strong> model masses. The species are<br />
sorted by increasing difference value. The values for Carcinus<br />
<strong>maenas</strong> dodecamers (12) <strong>and</strong> hexamers (6) are added for comparison.<br />
Three groups were considered based on the difference values.<br />
Ac, Alvinella caudata; Am, Arenicola marina; Ap, Alvinella pompejana;<br />
Cm, Carcinus <strong>maenas</strong>; Ev, Eudistylia vancouverii; Lt,<br />
Lumbricus terrestris; Md, Macrobdella decora; Ms, Marphysa sp.;<br />
Pg, Paralvinella grasslei; Pp, Paralvinella palmiformis; Rp, Riftia<br />
pachyptila.<br />
concerning subunit composition of HBL-Hbs from different<br />
species.<br />
Denaturing ESI-MS is very useful for subunit diversity<br />
investigation. It is worthwhile to note that the MS analyses<br />
were often performed on a pool from several individuals.<br />
Hence the observed diversity is rather representative of the<br />
pool <strong>and</strong> single individuals could exhibit lesser diversity. All<br />
93