Déclaration environnementale de produit - Pavatex
Déclaration environnementale de produit - Pavatex
Déclaration environnementale de produit - Pavatex

Create successful ePaper yourself
Turn your PDF publications into a flip-book with our unique Google optimized e-Paper software.
<strong>Déclaration</strong> <strong>environnementale</strong> <strong>de</strong> <strong>produit</strong><br />
Panneaux isolants en fibres <strong>de</strong> bois PAVATEX Page 17<br />
Groupe <strong>de</strong> <strong>produit</strong>s Matériaux en bois Fabrication<br />
Titulaire <strong>de</strong> la déclaration: PAVATEX SA 01-12-2010<br />
Numéro <strong>de</strong> la déclaration: EPD-PTX-2010121-FR<br />
Évaluation <strong>de</strong><br />
l'impact du cycle<br />
<strong>de</strong> vie<br />
directe en tant qu'eau <strong>de</strong> processus est négligeable durant la production.<br />
Le tableau qui suit montre les différents impacts lors <strong>de</strong> la fabrication et la valorisation<br />
énergétique d'1 m 3 <strong>de</strong> panneaux <strong>de</strong> fibres, catégories suivantes : potentiel d'effet <strong>de</strong><br />
serre (PES 100), potentiel d'appauvrissement <strong>de</strong> la couche d'ozone (PAO), potentiel<br />
d'acidification (PA), potentiel d'eutrophisation (PE), et potentiel <strong>de</strong> formation d'ozone<br />
(potentiel du smog d'été PFOP).<br />
Tableau 13 : Évaluation <strong>de</strong> l'impact du cycle <strong>de</strong> vie <strong>de</strong>s <strong>produit</strong>s <strong>Pavatex</strong> déclarés, par m 3<br />
PAVATHERM PAVATHERM PLUS +<br />
par m 3 Fabrication Élimination Total Fabrication Élimination Total<br />
Potentiel d'effet <strong>de</strong> serre (PES) kg CO 2 eq ‐181 71 ‐110 ‐220 88 ‐132<br />
Potentiel d'appauvrissement <strong>de</strong> la couche d'ozone kg CFC‐11 eq 5,96E‐06 ‐2,04E‐05 ‐1,45E‐05 6,93E‐06 ‐2,52E‐05 ‐1,83E‐05<br />
Potentiel d'acidification (PA) kg SO 2 eq 0,192 ‐0,147 0,044 0,27 ‐0,18 0,09<br />
Potentiel d'eutrophisation (PE) kg PO 3‐ 4 eq 0,072 ‐0,013 0,059 0,09 ‐0,02 0,08<br />
Potentiel <strong>de</strong> formation d'ozone photochimique kg C 2H 4 1,29E‐02 ‐1,25E‐02 3,16E‐04 1,73E‐02 ‐1,55E‐02 1,85E‐03<br />
ISOROOF NATUR/ISOLAIR<br />
DIFFUTHERM<br />
par m 3 Fabrication Élimination Total Fabrication Élimination Total<br />
Potentiel d'effet <strong>de</strong> serre (PES) kg CO 2 eq ‐285 125 ‐160 ‐233 91 ‐142<br />
Potentiel d'appauvrissement <strong>de</strong> la couche d'ozone kg CFC‐11 eq 1,15E‐05 ‐3,55E‐05 ‐2,41E‐05 7,63E‐06 ‐2,63E‐05 ‐1,86E‐05<br />
Potentiel d'acidification (PA) kg SO 2 eq 0,503 ‐0,257 0,246 0,25 ‐0,19 0,06<br />
Potentiel d'eutrophisation (PE) kg PO 3‐ 4 eq 0,131 ‐0,020 0,111 0,09 ‐0,02 0,08<br />
Potentiel <strong>de</strong> formation d'ozone photochimique kg C 2H 4 2,78E‐02 ‐2,18E‐02 5,91E‐03 1,66E‐02 ‐1,61E‐02 4,41E‐04<br />
( )<br />
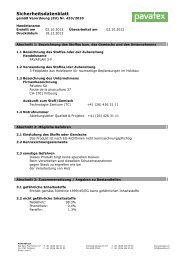
Sur l'illustration 3, les impacts sur l'environnement <strong>de</strong>s panneaux PAVATHERM sont<br />
présentés à titre d'exemple sous forme schématique. Tous les indicateurs se rapportent<br />
à la la fabrication, sans les emballages (=100 %):<br />
Potentiel d'effet <strong>de</strong> serre<br />
Accumulation <strong>de</strong> carbone<br />
Potentiel d'acidification<br />
Potentiel d'eutrophisation<br />
Potentiel d'appauvrissement <strong>de</strong> la couche d'ozone<br />
Potentiel <strong>de</strong> formation d'oxdants photochimique<br />
‐500% ‐400% ‐300% ‐200% ‐100% 0% 100% 200% 300%<br />
Fabrication Accumulation <strong>de</strong> carbone Emballage Valorisation Substitution<br />
Figure 3 :<br />
Ventilation <strong>de</strong>s impacts environnementaux du <strong>produit</strong> PAVATHERM, en<br />
fonction <strong>de</strong> l'impact environnemental <strong>de</strong> la fabrication (sans emballage)<br />
(= 100 %)<br />
Il apparaît évi<strong>de</strong>nt que les charges <strong>environnementale</strong>s évitées lors <strong>de</strong> l'utilisation<br />
énergétique <strong>de</strong>s panneaux en fibres <strong>de</strong> bois, et donc <strong>de</strong> la substitution <strong>de</strong>s sources<br />
d'énergie fossiles, se situent dans le même ordre <strong>de</strong> gran<strong>de</strong>ur que celles <strong>de</strong> la fabrication,<br />
pour plusieurs indicateurs. Dans le cas du potentiel d'appauvrissement <strong>de</strong> la<br />
couche d'ozone, et notamment dans le cas <strong>de</strong> l'effet <strong>de</strong> serre, l'effet <strong>de</strong> la substitution<br />
dépasse largement la contribution <strong>de</strong> la fabrication.