these simulation numerique et modelisation de l'ecoulement autour ...
these simulation numerique et modelisation de l'ecoulement autour ...
these simulation numerique et modelisation de l'ecoulement autour ...

Create successful ePaper yourself
Turn your PDF publications into a flip-book with our unique Google optimized e-Paper software.
α<br />
σ<br />
ϕ<br />
UM1 or UM2<br />
C D<br />
V j<br />
P suc ,P inj<br />
N inj<br />
ρ suc ,T suc<br />
N suc<br />
Y ksuc<br />
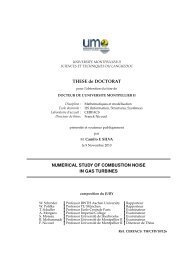
Figure 8. Schematic of the coupling procedure. Dotted lines <strong>de</strong>note the external input param<strong>et</strong>ers<br />
nee<strong>de</strong>d by the mo<strong>de</strong>ls: only the geom<strong>et</strong>rical d<strong>et</strong>ails (porosity and hole angles) and a<br />
law for the discharge coefficient C D have to be provi<strong>de</strong>d.<br />
IV.<br />
Application of the uniform mo<strong>de</strong>l in the LARA configuration<br />
The mo<strong>de</strong>ls proposed in section III.B, UM1 and UM2, are implemented in the AVBP<br />
co<strong>de</strong> (section IIA) and tested in the case of the LARA experiment. Fig. 9 presents the<br />
computational domain of the large-scale large-eddy <strong>simulation</strong>s performed for the a posteriori<br />
validation. It consists in two channels (height h = 0.12 m) separated by a plate that is<br />
perforated over a streamwise distance of 2.7 h. It has been <strong>de</strong>ci<strong>de</strong>d to locate the inflows<br />
6 h upstream of the perforated part of the plate. Fluid coming from channel 2 is injected<br />
in channel 1 through the multi-perforated plate to mimic the effusion of cooling air into<br />
combustion products.<br />
The si<strong>de</strong> walls of the experiment have been replaced by periodic conditions in the spanwise<br />
direction z. In the <strong>simulation</strong>, the perforated part of the wall is replaced by the coupled<br />
boundary condition <strong>de</strong>scribed in section III.C. The grid contains 121 × 31 × 31 hexahedral<br />
no<strong>de</strong>s for channel 1 and 121 ×21 ×31 hexahedral no<strong>de</strong>s for channel 2. This difference is due<br />
to the lower values of Reynolds numbers imposed in channel 2 in the LARA experiment.<br />
In the experiment, far enough from the si<strong>de</strong> walls, the velocity profiles upstream of<br />
the perforated zone correspond to fully <strong>de</strong>veloped channel flow profiles. In the <strong>simulation</strong>,<br />
imposing the mean streamwise velocity profile at the inl<strong>et</strong> is not a satisfying approach: the<br />
flow needs a too long distance to <strong>de</strong>stabilize and recover the characteristics of a fully turbulent<br />
channel. Thus it has been <strong>de</strong>ci<strong>de</strong>d to accelerate this transition by using the Random Flow<br />
Generation (RFG) algorithm 41,42 to make the fluid velocity vary in time and space at the<br />
17 of 26