these simulation numerique et modelisation de l'ecoulement autour ...
these simulation numerique et modelisation de l'ecoulement autour ...
these simulation numerique et modelisation de l'ecoulement autour ...

You also want an ePaper? Increase the reach of your titles
YUMPU automatically turns print PDFs into web optimized ePapers that Google loves.
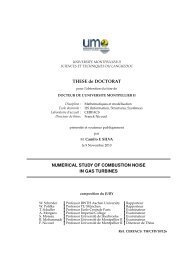
LES of a bi-periodic turbulent flow with effusion 29<br />
3.0<br />
2.5<br />
2.0<br />
y/d<br />
1.5<br />
1.0<br />
0.5<br />
0.0<br />
0 5 10 15 20 25<br />
x/d<br />
Figure 19. J<strong>et</strong> trajectory from Run C ( ). Comparison with the correlation of Ivanov<br />
(1963) with R = M b ( ) and R = 1.25 ( • ).<br />
the main stream, at least for x/d ≥ 12 (recall that the hole-to-hole streamwise distance<br />
is 11.68 d),<br />
(f) due the staggered arrangement of the holes, the pen<strong>et</strong>ration of the current j<strong>et</strong><br />
might be enhanced by the presence of the two lateral j<strong>et</strong>s located downstream, at half<br />
the downstream hole-to-hole distance.<br />
Note that the first two items can be accounted for in equation 4.1 by tuning the velocity<br />
ratio and flow angle. Figure 19 shows that the pen<strong>et</strong>ration of the j<strong>et</strong> is b<strong>et</strong>ter reproduced<br />
by the JCF correlation when R = 1.25 is used instead of R = M b . The last four items<br />
are related to the presence of regions with non negligible vertical velocity besi<strong>de</strong> the<br />
current j<strong>et</strong>. Specific to FCFC cases, they are also consistent with the smaller curvature<br />
and <strong>de</strong>eper pen<strong>et</strong>ration of the j<strong>et</strong> observed in figure 19.<br />
5. Discussion<br />
In this section, the LES results are analysed to provi<strong>de</strong> information about the wall<br />
fluxes mo<strong>de</strong>lling on both si<strong>de</strong>s of the perforated plate. In § 5.1, the fluxes at the wall<br />
are post-processed from Run C in or<strong>de</strong>r to d<strong>et</strong>ermine the most important contributions.<br />
In § 5.2, for each si<strong>de</strong> of the plate, an attempt to mo<strong>de</strong>l the main contribution of the<br />
streamwise momentum flux is presented.<br />
5.1. Wall fluxes<br />
The perforated plate is a combination of holes and solid wall. At the suction si<strong>de</strong>, the<br />
liner can be seen as a solid wall plus an outl<strong>et</strong> and at the injection si<strong>de</strong>, as a solid wall plus<br />
an inl<strong>et</strong>. The fluxes are then a combination of inl<strong>et</strong>/outl<strong>et</strong> fluxes and solid wall fluxes.<br />
The configuration tested in this paper being isothermal, only the momentum fluxes are<br />
consi<strong>de</strong>red in the remain<strong>de</strong>r of this section.<br />
The wall fluxes for the three components of the momentum have been post-processed<br />
from Run C and are presented in tables 5, 6 and 7. Each flux at the wall is <strong>de</strong>composed<br />
into contributions from the hole outl<strong>et</strong>/inl<strong>et</strong> (surface S h ) and from the solid wall (surface<br />
S s ) and also into viscous and non-viscous parts. The relative importance of each<br />
contribution in the total flux at the wall can be assessed from <strong>these</strong> tables. Note that<br />
viscous contributions are not presented in table 6, as they are negligible compared to<br />
non-viscous terms. Subscripts 1, 2 and 3 correspond to the three coordinates x, y and<br />
z. The outgoing normal to the wall is n. In the case of interest, n has only a vertical<br />
component: n 2 = −1 for the injection wall and n 2 = 1 for the suction wall. τ ij is the