these simulation numerique et modelisation de l'ecoulement autour ...
these simulation numerique et modelisation de l'ecoulement autour ...
these simulation numerique et modelisation de l'ecoulement autour ...

You also want an ePaper? Increase the reach of your titles
YUMPU automatically turns print PDFs into web optimized ePapers that Google loves.
LES of a bi-periodic turbulent flow with effusion 15<br />
NINTH ROW<br />
Eighth row Tenth row<br />
DIRECTION<br />
OF THE FLOW<br />
z<br />
x<br />
d<br />
(a) (b) (c) (d)<br />
(a)<br />
(b)<br />
(c)<br />
(d)<br />
x/d<br />
−2.92<br />
0<br />
2.92<br />
5.84<br />
z/d<br />
0<br />
0<br />
0<br />
0<br />
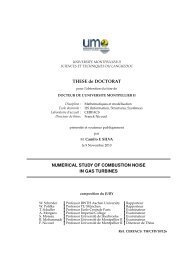
Figure 9. Zoom on the ninth row of the experimental test rig. Projected location of the profiles<br />
measured in the experiment: (a), (b), (c) and (d). The streamwise (x/d) and spanwise (z/d)<br />
locations of the points are reported in the table. Profiles are measured from the wall (y/d = 0)<br />
to the centre of channel 1 (y/d = 12). The projection of the computational domain ( ) is<br />
also represented.<br />
j<strong>et</strong>-to-j<strong>et</strong> interactions may occur, but small row-to-row spacing (typically of or<strong>de</strong>r 3-4d)<br />
would probably necessitate computations including a larger number of holes.<br />
3.3. Spatially evolving versus homogeneous flow<br />
From the previous sections, one can conclu<strong>de</strong> that the computational domain and spatial<br />
resolution are appropriate for the flow of interest. Note also that the same flow configuration<br />
has been computed with another LES co<strong>de</strong> (Ham & Iaccarino 2004), called<br />
CDP and <strong>de</strong>veloped at the Center for Turbulence Research (Stanford University, California).<br />
The d<strong>et</strong>ailed comparison is presented in Men<strong>de</strong>z <strong>et</strong> al. (2006). The very good<br />
agreement b<strong>et</strong>ween the two co<strong>de</strong>s strongly supports the i<strong>de</strong>a that numerical or sub-grid<br />
scale mo<strong>de</strong>lling errors have no significant effects on the results presented in this paper. It<br />
is then justified to consi<strong>de</strong>r Run C as a reference solution relevant to a bi-periodic (fully<strong>de</strong>veloped)<br />
turbulent flow with effusion. The next natural question to address regards<br />
the similarities/differences of this flow compared to the more classical spatially evolving<br />
configuration where the position within the array of holes is a relevant param<strong>et</strong>er.<br />
In the LARA experiment, Miron (2005) investigated the flow within two parallel channels<br />
separated by a 12-rows perforated plate. The experimental data base provi<strong>de</strong>s velocity<br />
profiles in the streamwise and vertical directions on the injection si<strong>de</strong> of the plate,<br />
at row 9. Comparisons are ma<strong>de</strong> with experimental profiles at locations (a), (b), (c) and<br />
(d) of figure 3 and recalled in figure 9. Note that no measurement is available at position<br />
(e). From figures 4 and 5, a general good agreement is obtained b<strong>et</strong>ween the <strong>simulation</strong>s<br />
and the experiment. Surprisingly, Run A (COARSE grid) seems to b<strong>et</strong>ter reproduce the<br />
experimental data than Runs B and C (finer grids). However, the near-wall region is<br />
not discr<strong>et</strong>ised finely enough: this leads to important errors on the velocity gradient at<br />
the wall (figure 4d) as well as a significant un<strong>de</strong>r-estimation of the velocity fluctuations<br />
(figure 5c,d). These errors are also related to an insufficient <strong>de</strong>scription of the vortical<br />
structure of the flow, the entrainment process being not correctly reproduced with the<br />
coarsest grid.<br />
Regarding Runs B and C (MEDIUM and FINE mesh), the behaviour of the streamwise<br />
velocity in the near wall region is well represented: the velocity peak due to the j<strong>et</strong> is