Composition minérale et stocks de bioéléments dans la ... - IRD
Composition minérale et stocks de bioéléments dans la ... - IRD
Composition minérale et stocks de bioéléments dans la ... - IRD

Create successful ePaper yourself
Turn your PDF publications into a flip-book with our unique Google optimized e-Paper software.
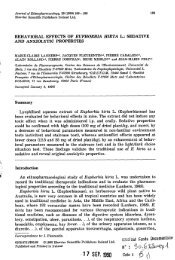
Acta Ecologica<br />
Ecol. P<strong>la</strong>nt., 1985, Vol. 6 (20), no 3, p. 233-246.<br />
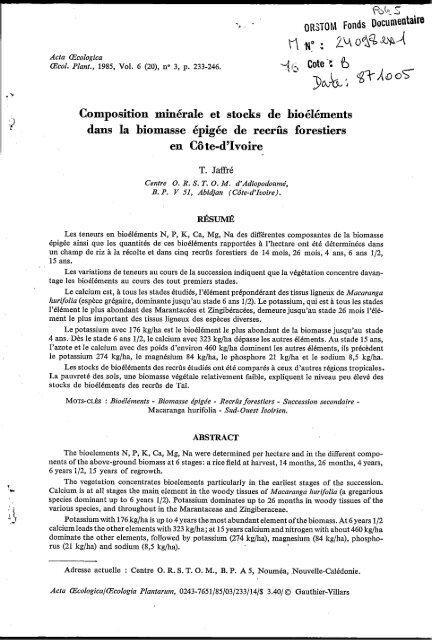
<strong>Composition</strong> <strong>minérale</strong> <strong>et</strong> <strong>stocks</strong> <strong>de</strong> <strong>bioéléments</strong><br />
<strong>dans</strong> <strong>la</strong> biomasse épigée <strong>de</strong> recrûs forestiers<br />
en Cô te-d’Ivoire<br />
T. Jaffré<br />
Centre O. R. S. T. O. M. &Adiopodoumé,<br />
B. P. V 51, Abi4an (Côte-d’Ivoire).<br />
RËSUMJZ<br />
Les teneurs en <strong>bioéléments</strong> N, P, K, Ca, Mg, Na <strong>de</strong>s différentes composantes <strong>de</strong> <strong>la</strong> biomasse<br />
épigée ainsi que les quantités <strong>de</strong> ces <strong>bioéléments</strong> rapportées à l’hectare ont été déterminées <strong>dans</strong><br />
un champ <strong>de</strong> riz à <strong>la</strong> récolte <strong>et</strong> <strong>dans</strong> cinq recrûs forestiers <strong>de</strong> 14 mois, 26 mois, 4 ans, 6 ans 1/2,<br />
15 ans.<br />
Les variations <strong>de</strong> teneurs au cours <strong>de</strong> <strong>la</strong> succession indiquent que <strong>la</strong> végétation concentre davantage<br />
les <strong>bioéléments</strong> au cours <strong>de</strong>s tout premiers sta<strong>de</strong>s.<br />
Le calcium est, à tous les sta<strong>de</strong>s étudiés, I’élément prépondérant <strong>de</strong>s tissus ligneux <strong>de</strong> Macaranga<br />
hurifolia (espèce grégaire, dominante jusqu’au sta<strong>de</strong> 6 ans 1/2). Le potassium, qui està tous les sta<strong>de</strong>s<br />
l’élément le plus abondant <strong>de</strong>s Marantacées <strong>et</strong> Zingibéracées, <strong>de</strong>meure jusqu’au sta<strong>de</strong> 26 mois l’élément<br />
le plus important <strong>de</strong>s tissus ligneux <strong>de</strong>s espèces diverses.<br />
Le potassium avec 176 kg/ha est le bioélément le plus abondant <strong>de</strong> <strong>la</strong> biomasse jusqu’au sta<strong>de</strong><br />
4 ans. Dès le sta<strong>de</strong> 6 ans 1/2, le calcium avec 323 kg/ha dépasse les autres éléments. Au sta<strong>de</strong> 15 ans,<br />
l’azote <strong>et</strong> le calcium avec <strong>de</strong>s poids d’environ 460 kg/ha dominent les autres éléments, ils précè<strong>de</strong>nt<br />
le potassium 274 kg/ha, le magnésium 84 kg/ha, le phosphore 21 kg/ha <strong>et</strong> le sodium 8,5 kg/ha.<br />
Les <strong>stocks</strong> <strong>de</strong> <strong>bioéléments</strong> <strong>de</strong>s recrûs étudiés ont été comparés à ceux d’autres régions tropicales.<br />
La pauvr<strong>et</strong>é <strong>de</strong>s sols, une biomasse végétale re<strong>la</strong>tivement faible, expliquent le niveau peu élevé <strong>de</strong>s<br />
<strong>stocks</strong> <strong>de</strong> <strong>bioéléments</strong> <strong>de</strong>s recrûs <strong>de</strong> Taï.<br />
MOTS-CLÉS : Bioéléments - Biomasse épigée - Recrlis forestiers - Succession secondaire -<br />
Macaranga hurifolia - Sud- OueJt Ivoirien.<br />
ABSTRACT<br />
The bioelements N, P, K, Ca, Mg, Na were d<strong>et</strong>ermined per hectare and in the different components<br />
of the above-ground biomass at 6 stages: a rice field at harvest, 14 months, 26 months, 4 years,<br />
6 years 1/2, 15 years of regrowth.<br />
The veg<strong>et</strong>ation concentrates bioelements particu<strong>la</strong>rly in the earliest stages of the succession.<br />
Calcium is at all stages the main element in the woody tissues of Macararzga Izurifolia (a gregarious<br />
species dominant up to 6 years 1/2). Potassium dominates up to 26 months in woody tissues of the<br />
various species, and throughout in the Marantaceae and Zingiberaceae.<br />
Potassium with 176 kg/ha is up to 4 years the most abundant element ofthe biomass. At 6 years 1/2<br />
calciumleads the other elements with 323 kg/ha; at 15 years calcium and nitrogen with about 460 kg/ha<br />
dominate the other elements, followed by potassium (274 kg/ha), magnesium (84 kg/ha), phosphorus<br />
(21 kg/ha) and sodium (8,5 kg/ha).<br />
Adresse actuelle : Centre O. R. S. T. O. M., B. P. A 5, Nouméa, Nouvelle-Calédonie.<br />
Acta cEcologica/@coIogia P<strong>la</strong>atarum, 0243-7651/85/03/233/14/$ 3.40/ 0 Gauthier-Vil<strong>la</strong>rs
234 T. JAFFRÉ<br />
Bioelements <strong>stocks</strong> in the regrowth studied are compared with those of other tropical region.<br />
The low levels observed at Taï are exp<strong>la</strong>ined by poor soils and re<strong>la</strong>tively reduced biomass.<br />
KEY-WORDS: Bioelements - Above-ground bioniass - Forest regrowth -<br />
Secondary slrccessiorz - Macaranga hurifolia - Southwest Ivory Coast.<br />
INTRODUCTION<br />
I1 est couramment admis que l’immobilisation <strong>de</strong>s <strong>bioéléments</strong> <strong>dans</strong> <strong>la</strong> biomasse<br />
végétale constitue en zone tropicale le principal obstacle à leur entraînement hors <strong>de</strong><br />
l’écosystème. D’importantes étu<strong>de</strong>s ont d’ailleurs montré que les quantités <strong>de</strong> <strong>bioéléments</strong><br />
contenus <strong>dans</strong> <strong>la</strong> biomasse <strong>de</strong>s forêts <strong>de</strong>nses tropicales étaient supérieures<br />
aux quantités utilisables du sol (ORSTOM-UNESCO, 1983). Toutefois, assez peu<br />
<strong>de</strong> travaux ont été consacrés à l’évolution <strong>de</strong>s <strong>stocks</strong> <strong>de</strong> <strong>bioéléments</strong> au cours <strong>de</strong> <strong>la</strong><br />
reconstitution <strong>de</strong> <strong>la</strong> forêt <strong>de</strong>nse.<br />
Le but du présent travail est d’examiner <strong>la</strong> composition en <strong>bioéléments</strong> (N, P, K,<br />
Ca, Mg, Na) <strong>de</strong>s différentes composantes <strong>de</strong> <strong>la</strong> biomasse épigée <strong>de</strong> recrûs forestiers<br />
du sud-ouest <strong>de</strong> <strong>la</strong> Côte-d’Ivoire (région <strong>de</strong> Taï), d’évaluer le poids <strong>de</strong> ces <strong>bioéléments</strong><br />
à différents sta<strong>de</strong>s <strong>de</strong> <strong>la</strong> succession secondaire <strong>et</strong> <strong>de</strong> préciser le rôle <strong>de</strong>s différentes<br />
composantes <strong>de</strong> <strong>la</strong> biomasse <strong>dans</strong> <strong>la</strong> constitution <strong>de</strong>s <strong>stocks</strong> <strong>de</strong> <strong>bioéléments</strong>.<br />
Ce travail fait suite à une série d’étu<strong>de</strong>s <strong>de</strong>stinées à caractériser <strong>la</strong> succession<br />
secondaire du sud-ouest <strong>de</strong> <strong>la</strong> Côte-d’Ivoire (GUILLAUMET <strong>et</strong> al., 1978) <strong>et</strong> <strong>la</strong> dynamique<br />
<strong>de</strong> <strong>la</strong> phytomasse épigée (JAFFRÉ, DE NAMUR, 1983). Elle porte sur un champ<br />
<strong>de</strong> riz sur brûlis <strong>de</strong> défrichement à l’abandon après récolte (sta<strong>de</strong> initial) <strong>et</strong> cinq<br />
recrûs <strong>de</strong> 14 mois, 26 mois, 4 ans, 6 ans 1/2, 15 ans, datés à compter <strong>de</strong> l’abandon du<br />
champ. Tous les champs étudiés se trouvent sur sols ferrallitiques fortement dksaturés<br />
(FRITSCH, 1982) <strong>et</strong> n’ont porté qu’une seule culture <strong>de</strong> riz pluvial imp<strong>la</strong>nté sur brû1,is<br />
après défrichement <strong>de</strong> <strong>la</strong> forêt primaire.<br />
MÉTHODE D’ÉTUDE<br />
Lors <strong>de</strong> <strong>la</strong> détermination <strong>de</strong> <strong>la</strong> biomasse (JAFFRÉ, DE NAMUR, 19831, <strong>de</strong>s échantillons végétaux<br />
ont été constitués en vue <strong>de</strong> leur analyse chimique pour établir <strong>la</strong> compostiion moyenne en bioélt5ment.s<br />
<strong>de</strong>s différentes composantes <strong>de</strong> <strong>la</strong> biomasse épigée.<br />
- La composition élémentaire <strong>de</strong>s lianes ainsi que celle <strong>de</strong>s Marantacées <strong>et</strong> Zingibéracées a été<br />
déterminée pour chaque recrû à partir <strong>de</strong> l’analyse <strong>de</strong> 3 à 8 échantillons constitués chacun <strong>de</strong> 3 à<br />
4 kg <strong>de</strong> matière sèche. Pour le sta<strong>de</strong> initial, <strong>la</strong> composition élémentaire moyenne <strong>de</strong> ces <strong>de</strong>ux composantes<br />
a été obtenue en faisant <strong>la</strong> moyenne <strong>de</strong>s teneurs <strong>de</strong>s <strong>bioéléments</strong> analysés <strong>dans</strong> les principales<br />
espèces <strong>de</strong> chaque composante.<br />
- La composition élémentaire <strong>de</strong> Macaranga hurifolia (espèce pionnière dominante <strong>de</strong>s sta<strong>de</strong>s<br />
jeunes) a été obtenueà partir <strong>de</strong> l’analyse <strong>de</strong> 5 à 8 échantillons <strong>de</strong> feuilles <strong>et</strong> du même nombre d’échantillons<br />
<strong>de</strong> tissus ligneux (bois avec écorce), chaque échantillon étant constitué <strong>de</strong> prélèvements effectués<br />
sur 5 à 10 individus.<br />
- La détermination <strong>de</strong> <strong>la</strong> composition élémentaire moyenne <strong>de</strong>s feuilles <strong>et</strong> <strong>de</strong>s tissus ligneux<br />
du peuplement <strong>de</strong>s espèces diverses, soit toutes les espkces ligneuses érigées àl’exception <strong>de</strong> Macarariga<br />
hurifolia, s’est révélée délicate en raison du nombre <strong>de</strong>s espèces <strong>et</strong> <strong>de</strong> l‘hétérogénéité <strong>de</strong> leur peuplement.<br />
Elle a été obtenue en faisant <strong>la</strong> moyenne <strong>de</strong>s teneurs en chaque élPment <strong>de</strong>s principales espèces<br />
représentées <strong>dans</strong> le recrû considéré. Les analyses ont porté sur 15 à 35 espèces selon <strong>la</strong> diversité<br />
floristique <strong>de</strong>s recrûs.<br />
- Les analyses <strong>de</strong>s échantillons végétaux réduits en poudre ont été effectuées selon les métho<strong>de</strong>s<br />
Acta CEcolug¿ca/CEcologia P<strong>la</strong>ntnmm
STOCKS DE BIOÉLÉMENTS DE RECRÛS FORESTIERS 23 5<br />
.’<br />
-3)<br />
utilisées au <strong>la</strong>boratoire commun d’analyses du Centre ORSTOM d’Adiopodoumé (Goum’, 1973).<br />
Après calcination au four à moufle, les cendres sont reprises par <strong>de</strong> l’aci<strong>de</strong> chlorhydrique. Les dosages<br />
du calcium <strong>et</strong> du magnésium sont effectues par absorption atomique,ceux du sodium <strong>et</strong> du potassium<br />
par photométrie <strong>de</strong> f<strong>la</strong>mme, celui du phosphore par colorimétrie au bleu <strong>de</strong> molybdène. L‘analyse<br />
<strong>de</strong> l’azote est effectuée par minéralisation <strong>de</strong> Kjeldahl <strong>et</strong> dosage par colorimétrie au bleu d’indophénol.<br />
Le phosphore <strong>et</strong> l’azote sont dosés à l’ai<strong>de</strong> d’un auto-analyseur Technicon.<br />
Le poids <strong>de</strong>s bioklements contenus <strong>dans</strong> <strong>la</strong> biomasse épigée a été calculé en multipliant le poids<br />
<strong>de</strong>s différentes fractions <strong>de</strong> <strong>la</strong> biomasse par leurs concentrations moyennes en chacun <strong>de</strong>s <strong>bioéléments</strong>.<br />
z<br />
.l x<br />
RÉSULTATS ET DISCUSSION<br />
I. COMPOSITION EN BIOÉLÉMENTS DES DIFFÉRENTES COMPOSANTES DE LA BIOMASSE<br />
ÉPIGÉE A DIFFÉRENTS STADES DE LA SUCCESSION SECONDAIRE<br />
Les variations <strong>de</strong> teneurs en <strong>bioéléments</strong> N, P, K, Ca, Mg, <strong>de</strong>s différentes fractions<br />
<strong>de</strong> <strong>la</strong> biomasse à différents sta<strong>de</strong>s <strong>de</strong> <strong>la</strong> succession sont représentées sur <strong>la</strong> figure 1.<br />
Les teneurs en sodium, en raison <strong>de</strong> leurs faibles valeurs (< 0,03 %) <strong>et</strong> <strong>de</strong> leurs<br />
variations peu significatives, n’ont pas été portées sur les graphiques.<br />
1. Coinposition en <strong>bioéléments</strong> <strong>de</strong>s feuilles <strong>de</strong>s espèces ligneuses érigées (fig. I-C, E).<br />
Elle est marquée par <strong>la</strong> prédominance <strong>de</strong> l’azote dont les teneurs moyennes<br />
sont comprises entre 2,11 % <strong>et</strong> 2,49 % pour Macaranga hurtfolia <strong>et</strong> entre 2,29 %<br />
<strong>et</strong> 3,04 % pour les espèces diverses; viennent ensuite le potassium (1,23 % à 2,12 %),<br />
le calcium (1,08 % à1,89 %), le magnésium (0,30 % à 0,46 %) <strong>et</strong> le phosphore (0,lO %<br />
à 0,17 %).<br />
Pour un recrû donné, les teneurs en azote, en calcium <strong>et</strong> en magnésium sont<br />
d’une manière assez générale plus élevées pour les espèces diverses ligneuses que pour<br />
Macaranga hurifolia. L’inverse s’observe pour le phosphore.<br />
2. <strong>Composition</strong> en <strong>bioéléments</strong> <strong>de</strong>s tissus ligneux <strong>de</strong>s espèces ligneuses érigées<br />
(fig. 1-D, F).<br />
Les teneurs observées sont, en accord avec <strong>la</strong> règle générale, plus faibles que les<br />
teneurs foliaires.<br />
Chez Macaranga hurifolia, le calcium, dont les concentrations moyennes oscillent<br />
entre 0,47 % <strong>et</strong> 0,59 %, est l’Clément le mieux représenté. Il est suivi du potassium<br />
(0,36 % à 0,49 %), <strong>de</strong> l’azote (0,23 % à 0,32 %), du magnésium (0,lO % à 0,13 %)<br />
<strong>et</strong> du phosphore (0,02 % à 0,03 %).<br />
Chez les espèces diverses ligneuses, c’est au sta<strong>de</strong> initial, où abon<strong>de</strong>nt les jeunes<br />
pousses, que l’on observe les teneurs les plus élevées en potassium, en calcium,<br />
en magnésium <strong>et</strong> en phosphore.<br />
Les concentrations en potassium <strong>de</strong>s tissus ligneux <strong>de</strong>s espèces diverses ligneuses<br />
diminuent fortement <strong>et</strong> <strong>de</strong> manière continue du sta<strong>de</strong> initial (1,68 %) au sta<strong>de</strong> 15 ans<br />
(0,25 %). Les teneurs en azote, en calcium <strong>et</strong> en phosphore varient <strong>de</strong> manière moins<br />
régulière. Les teneurs en calcium comprises entre 0,43 % <strong>et</strong> 0,65 % sont moins élevées<br />
que les teneurs correspondantes en azote <strong>et</strong> en potassium <strong>dans</strong> les recrûs <strong>de</strong><br />
14 mois à 4 ans <strong>et</strong> plus élevées <strong>dans</strong> les recrûs <strong>de</strong> 6 ans 1/2 <strong>et</strong> 15 ans. C’est <strong>dans</strong> ce<br />
<strong>de</strong>rnier que les teneurs en azote, en potassium, en phosphore <strong>et</strong> en magnésium sont<br />
les plus faibles.<br />
Vol. 6 (20), no 3 - 1985
236 T. JAF&<br />
% (N,K,Ca,Mg)<br />
d%o ( P)<br />
I<br />
(ÂJ<br />
- Marantacées (ÂJ - Lianes @J<br />
- Espèces diverses:feuilles @ bois + écorce @<br />
- Macaranga hurifolia : feuilles 0 bois + écorce 0<br />
%(N,K,Ca,Mg)<br />
+-+-+-+ Mg<br />
Oe5 ‘<br />
O,’ .<br />
FIG. 1. - Teneurs en N, P, K, Ca, Mg<br />
<strong>de</strong>s diffbrentes composantes <strong>de</strong> <strong>la</strong> biomasse bpigbe à divers sta<strong>de</strong>s <strong>de</strong> <strong>la</strong> succession secondaire.<br />
Acta @cologica/@cologia P<strong>la</strong>ntarum
STOCKS DE BIOÉLÉMENTS DE RECRÛS FORESTIERS 237<br />
.*<br />
Ij<br />
Dans tous les recrûs, les teneurs en potassium, en azote <strong>et</strong> en phosphore <strong>de</strong>s<br />
tissus ligneux <strong>de</strong>s espèces diverses sont supérieures à celles <strong>de</strong>s tissus ligneux <strong>de</strong><br />
Macaganga hurtfolia. L’inverse s’observe pour le calcium.<br />
Les variations <strong>de</strong> teneurs moyennes en <strong>bioéléments</strong> aussi bien <strong>dans</strong> les organes<br />
ligneux que <strong>dans</strong> les feuilles apparaissent plus importantes chez les espèces diverses<br />
que chez Macaranga hurifolia. Ceci est à m<strong>et</strong>tre en re<strong>la</strong>tion avec les variations <strong>de</strong><br />
composition floristique <strong>de</strong> l’ensemble <strong>de</strong>s espèces diverses aux différents sta<strong>de</strong>s étudiés.<br />
3. <strong>Composition</strong> eil <strong>bioéléments</strong> <strong>de</strong>s Marantacées <strong>et</strong> Zingibéracées (fig, 1-A).<br />
La composition élémentaire moyenne <strong>de</strong>s Marantacées <strong>et</strong> Zingibéracées est<br />
caractérisée, comme c’est généralement le cas <strong>de</strong>s espèces herbacées, par une prédominance<br />
du potassium dont les concentrations oscillent entre 3,4 % (sta<strong>de</strong> initial)<br />
<strong>et</strong> 1,74 % (sta<strong>de</strong> 6 ans 1/2).<br />
Contrairement à ce <strong>de</strong>rnier élément, le calcium est représenté à <strong>de</strong>s taux peu<br />
élevés, 0,30 % à 0,40 %, soit <strong>de</strong>s valeurs égales ou sensiblement inférieures à celles<br />
<strong>de</strong>s tissus ligneux ou foliaires <strong>de</strong>s espèces ligneuses érigées (Macaranga hurifolia<br />
<strong>et</strong> espèces diverses) <strong>et</strong> à celles <strong>de</strong>s lianes.<br />
Les teneurs en phosphore comprises entre 0,05 <strong>et</strong> 0,15 % sont, pour un même<br />
sta<strong>de</strong>, supérieures à celles <strong>de</strong>s tissus ligneux <strong>de</strong>s espèces ligneuses érigées, mais inférieures<br />
à celles <strong>de</strong>s autres composantes <strong>de</strong> <strong>la</strong> biomasse.<br />
Les teneurs en magnésium sont, comme les teneurs en phosphore, intermédiaires<br />
entre celles <strong>de</strong>s tissus ligneux <strong>et</strong> celles <strong>de</strong>s feuilles. Elles diminuent régulièrement du<br />
sta<strong>de</strong> initial (0,43 %) au sta<strong>de</strong> 15 ans (0,16 %).<br />
4. <strong>Composition</strong> en <strong>bioéléments</strong> <strong>de</strong>s lianes (fig. 1-B).<br />
Jusqu’au sta<strong>de</strong> 26 mois, l’azote <strong>de</strong>meure l’Clément le mieux représenté (1,16 %<br />
à 3,15 %); viennent ensuite le potassium (1 % à 2,62 %), puis le calcium (0,78 %<br />
à 1,54 %). Au sta<strong>de</strong> 4 ans les teneurs en potassium <strong>et</strong> en calcium sont sensiblement<br />
égales (1,94 % <strong>et</strong> 1,95 %) <strong>et</strong> sont supérieures aux teneurs en azote (1,47 %). Aux<br />
sta<strong>de</strong>s 6 ans 1/2 <strong>et</strong> 15 ans, le calcium est l’élément prépondérant (1,57 % <strong>et</strong> 1,14 %),<br />
suivi <strong>de</strong> l’azote (1,12 % <strong>et</strong> 0,73 %), puis du potassium (1,04 % <strong>et</strong> 0,61 %),<br />
Entre le sta<strong>de</strong> 14 mois <strong>et</strong> le sta<strong>de</strong> 15 ans, les teneurs <strong>de</strong>s lianes en magnésium,<br />
én azote <strong>et</strong> en phosphore restent intermédiaires entre celles <strong>de</strong>s tissus ligneux <strong>et</strong> celles<br />
<strong>de</strong>s tissus foliaires <strong>de</strong>s espèces ligneuses érigées. Les teneurs en calcium <strong>et</strong> en potassium<br />
sont globalement du même ordre <strong>de</strong> gran<strong>de</strong>ur que celles observées <strong>dans</strong> les<br />
tissus foliaires <strong>de</strong> ces <strong>de</strong>rnières.<br />
Les teneurs moyennes en <strong>bioéléments</strong> <strong>de</strong>s lianes montrent donc <strong>de</strong>s variations<br />
importantes au cours <strong>de</strong> <strong>la</strong> succession secondaire. Ce<strong>la</strong> tient vraisemb<strong>la</strong>blement<br />
à l’hétérogénéit6 <strong>de</strong> c<strong>et</strong>te composante <strong>de</strong> <strong>la</strong> biomasse.<br />
.,<br />
n<br />
5. Teneurs moyennes en <strong>bioéléments</strong> <strong>de</strong> <strong>la</strong> biomasse totale.<br />
L’examen <strong>de</strong>s teneurs en <strong>bioéléments</strong> <strong>de</strong> <strong>la</strong> biomasse épigée prise <strong>dans</strong> son<br />
ensemble (fig. 2) (teneurs calculées en faisant <strong>la</strong> moyenne pondérée par le poids, <strong>de</strong>s<br />
concentrations observées <strong>dans</strong> les différentes composantes <strong>de</strong> <strong>la</strong> biomasse) montre<br />
que les teneurs en Ny P, K, Ca, Mg décroissent rapi<strong>de</strong>ment du sta<strong>de</strong> initial (pour<br />
lequel le riz, exporté à <strong>la</strong> récolte, n’a pas été pris en compte) au sta<strong>de</strong> 14 mois puis,<br />
exception faite du phosphore, du sta<strong>de</strong> 14 mois au sta<strong>de</strong> 26 mois. Du sta<strong>de</strong> 26 mois<br />
Vol. 6 (201, no 3 - 1985 16
238 T. JAETRÉ<br />
au sta<strong>de</strong> 15 ans, on observe encore une diminution importante <strong>de</strong>s teneurs en potassium<br />
<strong>et</strong> une faible diminution <strong>de</strong>s teneurs en azote <strong>et</strong> en magnésium.<br />
% matiere seche(N,K,Ca,Mg) - K<br />
-x- N<br />
---c Ca<br />
I 1<br />
O 14m 26m 4a 6,5 a i5 a<br />
- 0,08<br />
- 0,06<br />
- 0,04<br />
.0,02<br />
FIG. 2. - Variations <strong>de</strong>s teneurs en <strong>bioéléments</strong> gU, P, K, Ca, Mg)<br />
-<strong>de</strong> <strong>la</strong> biomasse épigée totale au cours <strong>de</strong> <strong>la</strong> succession secondaire.<br />
Ces constatations rejoignent celles <strong>de</strong> STARK (1970) qui, comparant <strong>la</strong> composition<br />
élémentaire <strong>de</strong> recrûs forestiers <strong>et</strong> <strong>de</strong> forêts climaciques au Surinam <strong>et</strong> au Brésil,<br />
souligne que <strong>la</strong> végétation <strong>de</strong>s recrûs sur brûlis <strong>de</strong> défrichement concentre davantage<br />
les éléments minéraux au cours <strong>de</strong>s tout premiers sta<strong>de</strong>s <strong>de</strong> <strong>la</strong> reconstitution<br />
<strong>de</strong> <strong>la</strong> forêt.<br />
GOLLEY <strong>et</strong> al. (1975) re<strong>la</strong>tent également, pour <strong>la</strong> région <strong>de</strong> Santa Fé au Panama,<br />
<strong>de</strong>s concentrations en <strong>bioéléments</strong> plus élevées <strong>dans</strong> <strong>la</strong> biomasse végétale <strong>de</strong> recrûs<br />
forestiers que <strong>dans</strong> celle <strong>de</strong> <strong>la</strong> forêt à maturité. Les concentrations moyennes qu’ils<br />
observent pour quatre recrûs <strong>de</strong> 2 à 6 ans (P : 0,18 %, K : 1,66 %, Ca : 1,38 %,<br />
Mg : 0,25 %) sont n<strong>et</strong>tement plus élevées que celles enregistrées en Côte-d’Ivoire.<br />
Ces différences s’expliquent en partie par les différences <strong>de</strong> composition chimique<br />
<strong>de</strong>s sols. En eff<strong>et</strong>, les recrûs <strong>de</strong> Taï se trouvent sur sols fortement désaturés pauvres<br />
en éléments nutritifs (tableau I), tandis que ceux <strong>de</strong> Santa Fé au Panama se situent sur<br />
<strong>de</strong>s sols jeunes, d’origine calcaire <strong>et</strong> dolomitique, caractérisés par une forte<br />
capacité d’échange <strong>et</strong> un <strong>de</strong>gré <strong>de</strong> saturation en bases élevé.<br />
On notera que les variations <strong>de</strong> composition <strong>minérale</strong> <strong>de</strong>s sols <strong>de</strong>s recrûs <strong>de</strong> Taï,<br />
notamment les teneurs légèrement supérieures en bases échangeables <strong>de</strong>s sols <strong>de</strong>s<br />
recrûs <strong>de</strong> 14 mois <strong>et</strong> 6 ans 1/2, n’influent pas <strong>de</strong> manière significative sur <strong>la</strong> composition<br />
<strong>minérale</strong> <strong>de</strong> <strong>la</strong> biomasse végétale totale, ni sur celle <strong>de</strong> ses principales composantes.<br />
II. ÉVOLUTION DES STOCKS DE BIOÉLÉMENTS DANS LA BIOMASSE ÉPIGÉE AU COURS DE LA<br />
SUCCESSION SECONDAIRE (tableau II)<br />
Les poids <strong>de</strong> chacun <strong>de</strong>s six éléments analysés augmentent différemment au cours<br />
<strong>de</strong> <strong>la</strong> succession secondaire. Jusqu’au sta<strong>de</strong> 4 ans, le potassium <strong>de</strong>meure l’élément le<br />
plus abondant <strong>de</strong> <strong>la</strong> biomasse; viennent ensuite l’azote, puis le calcium jusqu’au sta<strong>de</strong><br />
Acra CEcologicalCEcologia P<strong>la</strong>ntaruni
STOCKS DE BIOÉLÉMENTS DE RECRÛS FORESTIERS 239<br />
TABLEAU I. - Caractéristiques chimiques <strong>de</strong>s sols <strong>de</strong>s recrfis (FRITSCH, 1982).<br />
PH<br />
Complexe Bchangeable (me/lOO g)<br />
Ca Mg K Na (S) (T)<br />
s x 100<br />
T<br />
N<br />
%.<br />
Champ <strong>de</strong> riz<br />
0-10 cm.. ........... 4,s<br />
10-20 cm.. ........... 4,6<br />
20-30 cm.. ........... 4,s<br />
0,84 0,40 0,09 0,Ol 1,34 4,24<br />
0,26 0,20 0,04 0,03 0,53 3,24<br />
0,30 0,20 0,02 0,02 0,54 3,42<br />
31,60<br />
16,36<br />
15,79<br />
11<br />
7<br />
7<br />
o, 80<br />
0,55<br />
0,53<br />
Recrû <strong>de</strong> 14 mois<br />
0-10 cm ............. 5,6<br />
10-20 cm.. ........... 4,s<br />
20-30 cm.. ........... 4,5<br />
1,80 0,70 0,09 0,Ol 2,60 4,99<br />
0,44 0,25 0,04 0,Ol 0,74 3,37<br />
0,38 0,20 0,04 0,Ol 0,63 3,08<br />
52,lO<br />
21,96<br />
20,45<br />
11<br />
8<br />
8<br />
l,oo<br />
0,73<br />
0,45<br />
Recrû <strong>de</strong> 26 mois<br />
0-10 cm ............. 5,O<br />
10-20 cm.. ........... 4,7<br />
20-30 cm.. ........... 4,7<br />
1,50 0,60 0,06 0,Ol 2.17 5,73<br />
0,30 0,20 0,02 0,Ol 0,53 4,30<br />
0,20 0,15 0,02 0,Ol 0,38 3,92<br />
37,87<br />
12,33<br />
9,69<br />
11<br />
9<br />
6<br />
1 ,O8<br />
0,70<br />
0,60<br />
Recrû <strong>de</strong> 4 ans<br />
0-10 cm ............. 5,O<br />
10-20 cm.. ........... 4,s<br />
20-30 cm.. ........... 43<br />
1,58 0,50 0,07 0,Ol 2,16 5,58<br />
0,61 0,20 0,03 0,Ol 0,85 4,13<br />
0,58 0,20, 0,02 0,Ol 0,81 3,81<br />
38,71<br />
20,58<br />
21,21<br />
12<br />
7<br />
6<br />
1,05<br />
0,70<br />
0,50<br />
Recrû <strong>de</strong> 6 ans 1/2<br />
0-10 cm ............. 5,5<br />
10-20 cm.. ........... 5,l<br />
20-30 cm.. ........... 5,l<br />
1,60 1,lO 0,13 0,02 2,85 5,16<br />
0,58 0,50 0,07 0,02 1,17 3,60<br />
0,38 0,40 0,05 0,Ol 0,84 3,09<br />
55,23<br />
32,50<br />
27,lS<br />
12<br />
11<br />
8<br />
1,20<br />
0,70<br />
0,55<br />
Recrû <strong>de</strong> 15 ans<br />
0-10 cm ............. 4,5<br />
10-20 cm ............. 4,4<br />
20-30 cm.. ........... 4,7<br />
0,86 0,40 0,09 0,Ol 1,36 5,81<br />
0,42 0,20 0,lO 0,02 0,74 5,56<br />
0,30 0,20 0,02 0,02 0,54 4,37<br />
23,41<br />
13,31<br />
12,36<br />
8<br />
4<br />
2<br />
1,23<br />
0,88<br />
0,60<br />
(*) MBtho<strong>de</strong> Olsen.<br />
I<br />
- .-’<br />
26 mois, puis le calcium suivi <strong>de</strong> l’azote au sta<strong>de</strong> 4 ans. Les <strong>stocks</strong> <strong>de</strong> potassium <strong>et</strong><br />
d’azote augmentant moins vite que celui du calcium, au sta<strong>de</strong> 6 ans 112, c’est c<strong>et</strong><br />
élément avec 323 kg/ha qui <strong>de</strong>vient prépondérant, suivi du potassium (244 kg/ha)<br />
<strong>et</strong> <strong>de</strong> l’azote (236 kg/ha). Au sta<strong>de</strong> 15 ans, l’azote <strong>et</strong> le calcium avec <strong>de</strong>s valeurs <strong>de</strong><br />
l’ordre <strong>de</strong> 460 kg/ha sont n<strong>et</strong>tement plus abondants que le potassium (274 kg/ha).<br />
Aux différents sta<strong>de</strong>s étudiés, l’azote, le potassium <strong>et</strong> le calcium sont plus abondants<br />
que les trois autres éléments analysés qui se succè<strong>de</strong>nt <strong>dans</strong> l’ordre Mg > P > Na.<br />
Ces différences <strong>dans</strong> l’accroissement du stock <strong>de</strong>s <strong>bioéléments</strong> reflètent les<br />
variations <strong>de</strong> composition élémentaire <strong>de</strong>s différentes fractions <strong>de</strong> <strong>la</strong> biomasse au<br />
cours du temps <strong>et</strong> les variations <strong>de</strong> leur importance re<strong>la</strong>tive aux différents sta<strong>de</strong>s.<br />
La prépondérance du potassium <strong>et</strong> <strong>de</strong> l’azote sur le calcium <strong>dans</strong> les sta<strong>de</strong>s<br />
les plus jeunes s’explique par le caractère juvénile <strong>de</strong> nombreuses espèces, par l’importance<br />
re<strong>la</strong>tive <strong>de</strong>s tissus foliaires <strong>et</strong> <strong>de</strong>s espèces herbacées (Marantacées, Zingibéracées,<br />
certaines lianes <strong>et</strong> le riz au sta<strong>de</strong> initial).<br />
Vol. 6 (20), no 3 - 1985
240 T . JAFF'RÉ<br />
II . .<br />
TABLEAU Stocks <strong>de</strong>s <strong>bioéléments</strong> minéraux <strong>dans</strong> <strong>la</strong> biomasse épigée d'un champ <strong>de</strong><br />
riz sur briilis <strong>de</strong> défrichement <strong>et</strong> <strong>dans</strong> <strong>la</strong> biomasse épigée <strong>de</strong> recríìs forestiers d'âges<br />
différents . * .<br />
Bio-<br />
Éléments minéraux (kg/ha)<br />
masse<br />
t/ha N P K Na Ca Mg Total<br />
Champ <strong>de</strong> riz<br />
Riz (tpisfextrémité tiges) .<br />
Chaumes ................<br />
Tiges (espèces ligneuses trigées)<br />
..................<br />
Feuilles .................<br />
Lianes ..................<br />
Marantactes. ZingibéracBes .<br />
Total .............<br />
O. 75<br />
1. 25<br />
O. 70<br />
O. 30<br />
o. 20<br />
O. 06<br />
3. 26<br />
10. 13 O. 90 2. 55 O. O8 O. 23 O. 53 14. 42<br />
11. 63 O. 50 40. O O. 13 4. 13 4. 38 60. 77<br />
4. 97 O. 56 11. 76 O. 07 4. 55 2. 31 24. 22<br />
9. 12 O. 51 6. 36 O. 03 4. 44 1. 32 21. 78<br />
6. 30 O. 40 5. 24 O. 02 3. O8 O. 78 15. 82<br />
1. 18 O. 09 2. 04 O. O1 O. 23 O. 26 3. 81<br />
43. 33 2. 96 67. 95 O. 34 16. 66 9. 58 140. 08<br />
Recrû <strong>de</strong> 14 mois<br />
Bois + écorce ............<br />
Feuilles .................<br />
Lianes ..................<br />
Marantacées. Zingibéracées .<br />
Total .............<br />
4. 87<br />
1. 19<br />
1. 75 '<br />
1 . 04<br />
835<br />
22. 37 1. 60 36. 62 O. 49 22. 87 6. 96 90. 91<br />
27. 25 1. 24 16. 36 O. 22 16. 15 5. 20 66. 42<br />
20. 30 1. 23 17. 50 O. 04 13. 65 3. 15 55.87<br />
S. 94 O. 52 21. 74 O. 21 4. 58 2. 91 38. 90<br />
78. 86 4. 59 92. 22 O. 96 573 18. 22 252. 1<br />
Recrû <strong>de</strong> 26 mois<br />
Bois + écorce ............<br />
Feuilles .................<br />
Lianes ..................<br />
Marantacées. Zingibéracées .<br />
Total .............<br />
10. 5<br />
1. 17<br />
o. 90<br />
1. 41<br />
14. 06<br />
36. 55 3. 17 56. 65 1. 33 48. 91 10. 58 157. 2<br />
29. 10 1. 64 17. 62 O. 16 14. 75 3. 98 67. 25<br />
18. O0 1. O8 15. 66 O. 18 9. 54 2. 43 46. 89<br />
13. 54 O. 99 40. 19 O. 14 6. 49 3. 53 64. 88<br />
97. 19 6. 88 130. I 1. 81 79. 69 20J2 336. 2<br />
Recrû <strong>de</strong> 4 ans<br />
Bois + écorce ............<br />
Feuilles .................<br />
Lianes ..................<br />
Marantacees. Zingibéractes .<br />
Total .............<br />
17. 2<br />
1. 30<br />
1. 74<br />
1. 31<br />
21. 62<br />
64. 58 5. 57 89. 67 1. 72 94. 60 21. 48 277. 62<br />
32. 78 2. O0 16. 88 O. 15 17. 42 4. 09 73. 3<br />
25. 58 1. 91 33. 93 O. 17 33. 76 4. 87 100. 25<br />
18. O8 1. 05 35. 89 O. 26 6. 16 3. 41 64. 8<br />
141. O 10. 53 176.4 2. 30 151. 9 33. 85 516. O<br />
Recrû <strong>de</strong> 6 ans 112<br />
Bois + tcorce ............<br />
Feuilles .................<br />
Lianes ..................<br />
Marantacées. Zingibéracées .<br />
Total .............<br />
Recrû <strong>de</strong> 15 ans<br />
Bois + écorce ............<br />
Feuilles .................<br />
Lianes ..................<br />
Total .............<br />
27. 1<br />
1. 48<br />
9. 15<br />
O. 58<br />
38. 38<br />
63. 29<br />
3. 85<br />
10. 51<br />
77. 65<br />
92. 54 6. 69 116. 6 2. 72 152. 8 24. 67 396. O<br />
36. 74 1. 90 21. 75 O. 26 24. 73 5. 20 90. 58<br />
102.5 5. 49 95. 16 O. 92 143. 7 14. 64 362. 4<br />
4. 64 O. 29 10. 09 O. 17 1. 74 O. 93 17. 86<br />
236. 4 14. 37 243. 6 4. 07 322. 9 45. 44 8663<br />
291. 1 12. 66 158. 2 6. 33 297. 5 50. 63 816. 4<br />
97. 02 335 51. 59 1. 16 44. 28 16. 56 214. 5<br />
76. 72 4. 20 64. 11 1. 05 119. 8 16. 82 282. 7<br />
464. 9 20. 71 273. 9 8. 54 461. 6 84. 01 I314<br />
w<br />
J<br />
Acta CEcoIogica/EcoIogia P<strong>la</strong>ntarum
-<br />
3<br />
,<br />
STOCKS DE BIO~L~MENTS DE RECRÛS FORESTIERS 241<br />
La prédominance du calcium au sta<strong>de</strong> 6 ans 112 est due en gran<strong>de</strong> partie à une<br />
diminution <strong>de</strong> l’importance re<strong>la</strong>tive <strong>de</strong>s feuilles par rapport aux tissus ligneux <strong>et</strong><br />
à l’importance du peuplement lianescent riche en calcium.<br />
Les différences observées entre les recrûs <strong>de</strong> 6 ans 112 <strong>et</strong> <strong>de</strong> 15 ans se caractérisent<br />
pax un fort accroissement du stock d’azote comparativement à ceux du calcium<br />
<strong>et</strong> du potassium. Ainsi le poids <strong>de</strong> l’azote augmente-t-il <strong>de</strong> 96 % entre les <strong>de</strong>ux sta<strong>de</strong>s,<br />
tandis que ceux du calcium <strong>et</strong> du potassium n’augmentent respectivement que <strong>de</strong><br />
43 % <strong>et</strong> <strong>de</strong> 21,5 %. Ces variations du stock <strong>de</strong>s <strong>bioéléments</strong> les uns par rapport<br />
aux autres s’expliquent par <strong>la</strong> disparition du peuplement <strong>de</strong> Macaranga hurifolia<br />
<strong>et</strong> le développement <strong>de</strong>s espèces diverses qui représentent à 15 ans plus <strong>de</strong> 85 %<br />
<strong>de</strong> <strong>la</strong> biomasse épigée. En eff<strong>et</strong>, comme il ressort du tableau III, le peuplement <strong>de</strong><br />
Macaranga lzurifolia se distingue à tous les sta<strong>de</strong>s par un stock <strong>de</strong> calcium supérieur<br />
au stock <strong>de</strong> potassium, lui-même supérieur à celui <strong>de</strong> l’azote. Inversement, <strong>la</strong> composante<br />
(( espèces diverses )) renferme à tous les sta<strong>de</strong>s <strong>de</strong>s quantités d’azote supérieures<br />
aux quantités <strong>de</strong> calcium.<br />
TABLEAU III. - Stock <strong>de</strong>s élémelits minéraux <strong>dans</strong> le peuplenient <strong>de</strong> Macaranga hurifolia<br />
<strong>et</strong> <strong>dans</strong> celui <strong>de</strong>s espèces diverses à différents sta<strong>de</strong>s <strong>de</strong> <strong>la</strong> succession secondaire.<br />
N P K Ca Mg<br />
0<br />
C<br />
Champ <strong>de</strong> riz<br />
Espèces ligneuses érigtes. .... 14,09 1,07 18,12 8,99 3,63 K > N >Ca<br />
Recrûs <strong>de</strong> 14 mois<br />
Macaranga hurifolia ......... 8,79 0,57 10,51 11,52 2,79 Ca > K > N<br />
Espèces diverses.. ........... 40,83 2,27 42,47 27,50 9,37 K > N > Ca<br />
Recrû <strong>de</strong> 26 mois<br />
Macaranga hurifo<strong>la</strong> ......... 39,26 3,52 44,87 45,98 10,18 Ca > K > N<br />
Espèces diverses.. ........... 26,39 1,29 29,40 17,68 4,38 K > N > Ca<br />
Recrûs <strong>de</strong> 4 ans<br />
Macaranga liurifolia ......... 74,71 6,25 87,79 97,50 23,02 Ca > K > N<br />
Espèces diverses.. ........... 22,65 1,32 18,76 14,52 2,55 N > K > Ca<br />
Recrû <strong>de</strong> 6 ans 1/2<br />
Macaranga hurifolia ......... 42,14 3,53 59,26 90,76 15,85 Ca> K > N<br />
Espèces diverses.. ........... 87,14 5,06 79,08 86,77 14,02 N > Ca > K<br />
Recrû <strong>de</strong> 15 ans<br />
Espèces diverses.. ........... 388,14 16,51 209,82 341,79 67,19 N > Ca> K<br />
Excepté le cas du champ <strong>de</strong> riz à <strong>la</strong> récolte, où le riz renferme 53 % <strong>de</strong> <strong>la</strong> minéralomasse<br />
végétale épigée, <strong>la</strong> fraction <strong>la</strong> plus importante <strong>de</strong>s éléments minéraux totaux<br />
se trouve <strong>dans</strong> les tissus ligneux <strong>de</strong>s espèces ligneuses érigées. I1 en est <strong>de</strong> même <strong>de</strong>s<br />
<strong>bioéléments</strong> pris séparément, excepté l’azote plus abondamment stocké <strong>dans</strong> <strong>la</strong><br />
biomasse foliaire au sta<strong>de</strong> 14 mois <strong>et</strong> <strong>dans</strong> les lianes au sta<strong>de</strong> 6 ans 1/2.<br />
Vol. 6 (20), no 3 - 1985
242 T. JAFFRÉ<br />
III. ACCUMULATION<br />
ANNUELLE MOYENNE DES BIOÉLÉMENTS DE LA BIOMASSE ÉPIG&<br />
AU COURS DE LA SUCCESSION SECONDAIRE<br />
L’estimation <strong>de</strong> l’accumu<strong>la</strong>tion annuelle moyenne <strong>de</strong>s <strong>bioéléments</strong> à différents<br />
sta<strong>de</strong>s <strong>de</strong> <strong>la</strong> succession a été obtenue en divisant le poids <strong>de</strong> chaque bioélément par<br />
l’âge du recrû du sta<strong>de</strong> considéré (tableau IV).<br />
-.<br />
.<br />
TABLEAU IV. - Itnmobilisation annuelle moyenne <strong>de</strong>s <strong>bioéléments</strong><br />
calculée à différents cîges <strong>de</strong> Ia succession secondaire.<br />
Élément s<br />
minéraux<br />
kg/ha/an<br />
Champ<br />
<strong>de</strong> riz<br />
sur brûlis<br />
Recrûs forestiers après récolte du riz<br />
Intervalles <strong>de</strong> temps<br />
(Récolte du riz)<br />
-6+0 O+14mois O+26mois 0+4ans O+6ans1/2 0+15ans<br />
N 86,66 67,59 44,86 35,25 36,37 30,99<br />
P 5,92 3,93 3,18 2,63 2,21 1,38<br />
K 135,9 79,04 60,04 44,lO 37,48 18,26<br />
Na 0,68 0,82 0,84 0,58 0,63 0,57<br />
Ca 33,32 49,07 36,78 37,98 49,68 30,77<br />
Mg 19,16 15,62 9,47 8,46 6.99 5,60<br />
Total.. ....... 281,6 21 6,l 155,2 129,O 133,4 87,57<br />
L’importance <strong>de</strong> l’accumu<strong>la</strong>tion moyenne annuelle du phosphore, du potassium,<br />
du magnésium <strong>et</strong>, à une exception près, <strong>de</strong> l’azote est d’autant plus élevée qu’elle<br />
correspond à <strong>de</strong>s recrfis plus jeunes. C<strong>et</strong>te observation rejoint celle formulée par NYE<br />
& GREENLAND à propos <strong>de</strong>s données recueillies à Yangambi au Zaïre par BARTHO-<br />
LOMEW <strong>et</strong> al. (1953).<br />
Dans c<strong>et</strong>te <strong>de</strong>rnière étu<strong>de</strong>, les valeurs <strong>de</strong> l’accumu<strong>la</strong>tion annuelle moyenne <strong>de</strong><br />
l’azote, du phosphore <strong>et</strong> du potassium au cours <strong>de</strong>s 5 premières années sont, à l’image<br />
<strong>de</strong> l’accroissement annuel moyen <strong>de</strong> <strong>la</strong> biomasse épigée, très supérieures aux valeurs<br />
correspondant aux 4 premières années <strong>dans</strong> <strong>la</strong> présente étu<strong>de</strong> (tableau V). Par<br />
contre, <strong>la</strong> valeur <strong>de</strong> l’accumu<strong>la</strong>tion annuelle moyenne <strong>de</strong> <strong>la</strong> somme <strong>de</strong>s cations Ca<br />
<strong>et</strong> Mg est sensiblement moins élevée à Yangambi qu’à Taï. C<strong>et</strong>te différence traduit <strong>la</strong><br />
TABLEAU V. - Coniparaison <strong>de</strong> I’accroissenient annuel mo-yen <strong>de</strong> <strong>la</strong> biomasse épigée <strong>et</strong> <strong>de</strong> I’inimobilisation<br />
annuelle moyenne <strong>de</strong> <strong>bioéléments</strong>, <strong>dans</strong> <strong>de</strong>ux recrlis forestiers du Zaïre <strong>et</strong> <strong>de</strong> Ia Côted’Ivoire.<br />
Accroissement Immobilisation annuelle moyenne<br />
annuel moyen kg/ha/an b<br />
<strong>de</strong> <strong>la</strong> biomasse épigée<br />
kg/ha/an N P K CafMg<br />
Zaïre (Yangambi), 5 ans (BARTHO-<br />
LOMEW <strong>et</strong> al., 1953). ........... 15 340 61,20 4,20 64,4 43,20<br />
Côte-d’Ivoire (Taï), 4 ans, présente<br />
étu<strong>de</strong> ......................... 5 400 35,25 2,63 44,4 46,42<br />
Acta G!%cologica/G?cologia P<strong>la</strong>ntaruin<br />
,._ z
STOCKS DE BIOÉLÉMENTS DE RECRÛS FORESTIERS 243<br />
spécificité biochimique <strong>de</strong>s <strong>de</strong>ux peuplements pionniers, le peuplement <strong>de</strong> Macarariga<br />
hurifolia <strong>de</strong> Taï se caractérisant par rapport au peuplement <strong>de</strong> Musanga cecropioi<strong>de</strong>s<br />
<strong>de</strong> Yangambi par une accumu<strong>la</strong>tion plus intense <strong>de</strong> <strong>la</strong> somme <strong>de</strong>s cations Ca <strong>et</strong> Mg.<br />
IV. COMPARAISON DU STOCK DE BIOÉLÉMENTS DE LA BIOMASSE ÉPICÉE DE RECRUS FORES-<br />
TIERS ET DE FORÊTS EN ZONE INTERTROPICALE<br />
Les données rassemblées <strong>dans</strong> le tableau VI montrent que d’une manière générale<br />
les premiers sta<strong>de</strong>s <strong>de</strong> <strong>la</strong> reconstitution <strong>de</strong> <strong>la</strong> forêt présentent un stock <strong>de</strong> potassium<br />
supérieur au stock <strong>de</strong> calcium, l’inverse s’observant pour les recrûs plus âg6s<br />
<strong>et</strong> les forêts.<br />
Les valeurs moyennes du poids <strong>de</strong> chaque bioélément <strong>de</strong>s recrûs <strong>de</strong> 10 mois<br />
à Izaba1 au Guatema<strong>la</strong> (TERCAS 6c POPENOE, 1971) sont très supérieures, sauf pour le<br />
calcium, à celles <strong>de</strong>s recrûs <strong>de</strong> 14 mois en Côte-d’Ivoire. Ces différences tiennent à une<br />
biomasse plus importante <strong>et</strong> à <strong>de</strong>s teneurs plus élevées en tous les <strong>bioéléments</strong> minéraux,<br />
excepté le calcium. Elles ne sont pas sans re<strong>la</strong>tion avec les conditions édaphiques.<br />
En eff<strong>et</strong> les sols d’Izabal sont en moyenne mieux pourvus que ceux <strong>de</strong> Taï en Cléments<br />
nutritifs. On notera, en outre, que certains sols d’Izabal présentent un excès <strong>de</strong> magnésium,<br />
ce qui explique l’importance du stock <strong>de</strong> c<strong>et</strong> Clément, notamment par rapport<br />
au stock <strong>de</strong> calcium dont l’absorption par les p<strong>la</strong>ntes est entravée par un excès <strong>de</strong><br />
magnésium (cas <strong>de</strong>s sols serpentineux).<br />
Parmi les recrûs <strong>de</strong> 15 à 18 ans, celui étudié à Magdalena en Colombie (FOLSTER<br />
<strong>et</strong> al., 1976) renferme, exception faite pour le phosphore, les quantités les plus importantes<br />
<strong>de</strong> tous les déments analysés. L’importance du stock en <strong>bioéléments</strong> tient ici<br />
davantage à <strong>la</strong> valeur élevée <strong>de</strong> <strong>la</strong> biomasse épigée qu’aux concentrations en <strong>bioéléments</strong><br />
<strong>de</strong>s tissus végétaux. A l’inverse, le recrû <strong>de</strong> 15 ans <strong>de</strong> Taï en Côte-d’Ivoire<br />
renferme <strong>de</strong>s quantités re<strong>la</strong>tivement importantes d’azote <strong>et</strong> <strong>de</strong> calcium en dépit<br />
d’une biomasse peu élevée comparativement à celle <strong>de</strong>s recrûs <strong>de</strong> 16 ans <strong>et</strong> <strong>de</strong> 18 ans<br />
<strong>de</strong> Colombie <strong>et</strong> du Zaïre. Ces trois recrûs se développant sur <strong>de</strong>s sols comparables,<br />
les différences observées <strong>dans</strong> les <strong>stocks</strong> <strong>de</strong> <strong>bioéléments</strong> résultent principalement <strong>de</strong> <strong>la</strong><br />
productivité <strong>de</strong>s espèces constitutives <strong>de</strong>s recrûs <strong>et</strong> <strong>de</strong> leur capacité à accumuler les<br />
éléments minéraux <strong>dans</strong> leurs tissus.<br />
L’importance re<strong>la</strong>tive <strong>de</strong>s <strong>bioéléments</strong> <strong>dans</strong> <strong>la</strong> biomasse épigée exprimée par<br />
somme du poids <strong>de</strong>s <strong>bioéléments</strong> N, P, K, Ca, Mg x 100décroît<br />
le rapport<br />
biomasse épigée<br />
manière assez générale tout au long <strong>de</strong> <strong>la</strong> succession secondaire jusqu’au sta<strong>de</strong> <strong>de</strong><br />
maturité <strong>de</strong> <strong>la</strong> forêt, mais <strong>de</strong>meure très variable d’une région à l’autre. Ainsi, les<br />
valeurs obtenues respectivement pour <strong>de</strong>s recrûs <strong>de</strong> 15, 16 <strong>et</strong> 18 ans en Côte-d’Ivoire,<br />
en Colombie <strong>et</strong> au Zaïre sont-elles inférieures à celles obtenues pour une forêt <strong>de</strong><br />
40 à 50 ans au Ghana.<br />
CONCLUSION<br />
La présente étu<strong>de</strong> montre que les recrûs forestiers installés sur brûlis <strong>de</strong> défrichement<br />
<strong>de</strong> <strong>la</strong> forêt primaire, après un seul cycle <strong>de</strong> culture, ten<strong>de</strong>nt au cours <strong>de</strong> leur<br />
développement à reconstituer les réserves <strong>de</strong> <strong>bioéléments</strong> <strong>de</strong> <strong>la</strong> végétation.<br />
Le stock <strong>de</strong>s <strong>bioéléments</strong> contenus <strong>dans</strong> <strong>la</strong> biomasse épigée s’accroît tout au<br />
long <strong>de</strong> <strong>la</strong> succession secondaire, mais l’accumu<strong>la</strong>tion <strong>de</strong>s différents Cléments évolue<br />
en fonction <strong>de</strong>s variations <strong>de</strong> poids <strong>et</strong> <strong>de</strong> composition <strong>minérale</strong> <strong>de</strong>s différentes compo-<br />
Vol. 6 (20), no 3 - 1985
TABLEAU VI. - Comparaison du stock <strong>de</strong>s principaicx <strong>bioéléments</strong> <strong>de</strong> <strong>la</strong> biomasse épigée, <strong>de</strong> recrûs forestiers <strong>et</strong> <strong>de</strong> forêts en zone intertropicale.<br />
Biomasse N P K Ca Mg Totals SX100<br />
t/ha kglha kglha kg/ha kg/ha kglha kglha biomasse<br />
E3<br />
P<br />
*p.<br />
F<br />
Guatema<strong>la</strong> (TERGAS, POPENOE, 1971)<br />
(valeurs moyennes pour 10 recrûs <strong>de</strong><br />
10 mois) ..........................<br />
Côte-d’Ivoire<br />
Champ <strong>de</strong> riz (sta<strong>de</strong> initial). .......<br />
Recrû <strong>de</strong> 14 mois.. .............<br />
Recrû <strong>de</strong> 26 mois.. .............<br />
Recrû <strong>de</strong> 4 ans ................<br />
Recrû <strong>de</strong> 6 ans 1/2 .............<br />
Recrû <strong>de</strong> 15 ans ................<br />
CGte-d’Ivoire (BERNHARD-REVERSAT<br />
<strong>et</strong> al., 1975)<br />
Forêt du Banco.. ...............<br />
Forêt <strong>de</strong> Yap0 ..................<br />
Colombie (FOLSTER <strong>et</strong> al., 1976)<br />
Recrû <strong>de</strong> 2 ans... ..............<br />
Recrû <strong>de</strong> 5 ans.. ...............<br />
Recrû <strong>de</strong> 16 ans .................<br />
Forêt ...........................<br />
Forêt ..........................<br />
Zaïre (BARTHOLOMEW <strong>et</strong> al., 1953)<br />
Recrû <strong>de</strong> 2 ans .................<br />
Recrû <strong>de</strong> 5 ans .................<br />
Recrû <strong>de</strong> 8 ans .................<br />
Recrû <strong>de</strong> 18 ans.. ...............<br />
Ghana (NYE, 1958)<br />
Forêt secondaire 20 ans environ.. Forêt secondaire 20 ans environ.. .<br />
Ghana (GREENLAND & KOWAL, 1960)<br />
Forêt secondaire 40-50 ans.. ......<br />
9,71<br />
3,26<br />
8,85<br />
14,05<br />
21,61<br />
38,37<br />
77,65<br />
370 (*)<br />
330 (*I<br />
19<br />
68<br />
203<br />
185<br />
326<br />
10,92<br />
76.69<br />
121,69<br />
121,07<br />
119<br />
119<br />
235,5<br />
130<br />
43<br />
79<br />
98<br />
141<br />
236<br />
465<br />
1150<br />
8 50<br />
162<br />
357<br />
713<br />
74 1<br />
1 O01<br />
98<br />
302<br />
326<br />
444<br />
400<br />
506<br />
1471<br />
10<br />
3<br />
4,6<br />
7<br />
10,5<br />
14<br />
21<br />
90<br />
70<br />
16<br />
22<br />
55<br />
27<br />
38<br />
17<br />
21<br />
25<br />
69<br />
27<br />
36<br />
93<br />
112<br />
68<br />
92<br />
130<br />
176<br />
244<br />
274<br />
520<br />
350<br />
119<br />
320<br />
496<br />
277<br />
3 89<br />
117<br />
322<br />
658<br />
305<br />
265<br />
424<br />
727<br />
61<br />
17<br />
57<br />
80<br />
1 52<br />
323<br />
462<br />
1 O00<br />
1670<br />
88<br />
181<br />
558<br />
432<br />
809<br />
63<br />
- 216<br />
431<br />
378<br />
67<br />
10<br />
18<br />
21<br />
34<br />
45<br />
84<br />
430<br />
170<br />
26<br />
40<br />
156<br />
133<br />
225<br />
353 172<br />
439 197<br />
1868 267<br />
380<br />
141<br />
251<br />
336<br />
514<br />
862<br />
1306<br />
3 190<br />
3 110<br />
41 1<br />
920<br />
1978<br />
1615<br />
2 462<br />
295<br />
865<br />
1 440<br />
1196<br />
1217<br />
1602<br />
4 426<br />
3,91<br />
4,3<br />
2,84<br />
2,39<br />
2,38<br />
2,25<br />
1,68<br />
0,86<br />
0,94<br />
2,16<br />
1,35<br />
0,97<br />
0,87<br />
0,76<br />
2,70<br />
1,13<br />
1,18<br />
0,99<br />
1,02<br />
1,35<br />
1,88<br />
N> K> Mg> Ca<br />
K>N>Ca<br />
K>N>Ca<br />
K>N>Ca<br />
K>Ca>N<br />
Ca>K>N<br />
N>Ca>K<br />
N > Ca> K 9<br />
Ca>N>K<br />
s<br />
N> K Ca<br />
N> K > Ca<br />
N> Ca> K<br />
N> Ca> K<br />
N> Ca> K<br />
K>N> Ca+Mg<br />
K>N> Ca+Mg<br />
K> Ca+Mg> N<br />
N> Ca+Mg>K<br />
N> Ca> K<br />
N> Ca> K<br />
Ca> N> K<br />
(*) Biomasse 6pig6e partielle (arbres seulement).<br />
I,-- b.
STOCKS DE BIOJ~L~MENTS DE RECRÛS FORESTIERS 245<br />
r<br />
4<br />
3<br />
santes <strong>de</strong> <strong>la</strong> biomasse. Parmi celles-ci, les Marantacées <strong>et</strong> Zingibéracées accumulent<br />
le potassium, alors que les tissus foliaires <strong>de</strong>s espèces ligneuses sont marqués par une<br />
prédominance <strong>de</strong> l’azote. Les teneurs en calcium <strong>de</strong>s tissus ligneux <strong>de</strong> Macaranga<br />
hurifolia sont supérieures aux teneurs en tous les autres <strong>bioéléments</strong> <strong>et</strong> sont également,<br />
pour un sta<strong>de</strong> donné, plus élevées que les teneurs en calcium <strong>de</strong>s tissus ligneux <strong>de</strong>s<br />
espèces diverses ligneuses.<br />
La végétation <strong>de</strong>s premiers sta<strong>de</strong>s <strong>de</strong> <strong>la</strong> reconstitution qui se distingue <strong>de</strong> <strong>la</strong><br />
végétation <strong>de</strong>s sta<strong>de</strong>s plus âgés par une proportion plus importante <strong>de</strong> tissus foliaires,<br />
<strong>de</strong>s Marantacées <strong>et</strong> Zingibéracées <strong>et</strong> <strong>de</strong>s tiges peu lignifiées, s’en différencie aussi<br />
du point <strong>de</strong> vue chimique par <strong>de</strong>s concentrations plus élevées en <strong>bioéléments</strong>, principalement<br />
en potassium, en azote <strong>et</strong> en phosphore. I1 en résulte une accumu<strong>la</strong>tion<br />
plus intense <strong>de</strong>s <strong>bioéléments</strong> au cours <strong>de</strong>s premiers sta<strong>de</strong>s <strong>de</strong> <strong>la</strong> reconstitution.<br />
’ Les sta<strong>de</strong>s plus âgés sont marqués, en raison d’une importance accrue <strong>de</strong>s tissus<br />
ligneux, par une prédominance du calcium <strong>et</strong> <strong>de</strong> l’azote sur les autres éléments.<br />
L’importance <strong>de</strong>s <strong>stocks</strong> <strong>de</strong> <strong>bioéléments</strong> <strong>dans</strong> <strong>la</strong> végétation à différents sta<strong>de</strong>s<br />
<strong>de</strong> <strong>la</strong> succession secondaire est <strong>la</strong>rgement fonction <strong>de</strong>s caractéristiques <strong>de</strong>s espèces<br />
constitutives <strong>de</strong>s recrûs, mais elle dépend aussi <strong>de</strong>s conditions édaphiques, ces<br />
<strong>de</strong>rnières agissant à <strong>la</strong> fois directement sur l’approvisionnement <strong>de</strong>s p<strong>la</strong>ntes en éléments<br />
minéraux <strong>et</strong> indirectement en favorisant l’imp<strong>la</strong>ntation d’espèces plus ou moins<br />
productives <strong>et</strong> plus ou moins exigeantes en certains éléments minéraux <strong>dans</strong> leurs<br />
tissus.<br />
BIBLIOGRAPHIF.<br />
= .-.<br />
BARTHOLOMEW W. V., MEYER J. & LAUDELOUT H., 1953. - Mineral nutrient immobilisatioiz un<strong>de</strong>j<br />
forest and grass fallow in the Yangambi (Belgian Congo) region. Brussels, INEAC, Série sci.<br />
na 57, 27 p.<br />
BERNHARD-REVERSAT F., HUTTEL C. & LEMBE G., 1975. - Recherches sur l’kcosystème <strong>de</strong> <strong>la</strong> forêt<br />
subkquatoriale <strong>de</strong> Basse Côte-d’Ivoire. La terre <strong>et</strong> <strong>la</strong> Vie, 29, 169-264.<br />
FOLSTER H., DE LAS SALAS G. & KHANNA P., 1976. - A tropical evergreen forest site with perched<br />
water table, Magdalena valley, Columbia. Biomass and bioelements inventory of primary and<br />
secondary veg<strong>et</strong>ation. Ecol. Pldnt., 11 (4), 297-320.<br />
FRITSCH E., 1982. - Évolution <strong>de</strong>s sols sous recrû forestier après mise en culture traditionnelle <strong>dans</strong><br />
le sud-ouest <strong>de</strong> <strong>la</strong> Côte-d’Ivoire. Rapport O. R. S. T. O. M., multigr., 74 p.<br />
GOLLEY F. B., MCGINNIS J. T., CLEMENTS R. G., CHILD G. I. & DUEVER M. J., 1975. - Mineral<br />
cycling in a tropical moist forest ecosystem Univ. of Georgia Press, Athens, 248 p.<br />
GUILLAUMET J. L., ALEXANDRE D. Y., KAHN F. & DE NAMUR Ch., 1978. - Observations sur les<br />
premiers sta<strong>de</strong>s <strong>de</strong> <strong>la</strong> reconstitution <strong>de</strong> <strong>la</strong> forêt <strong>de</strong>nse humi<strong>de</strong> [sud-ouest <strong>de</strong> <strong>la</strong> Côte-d’Ivoire).<br />
Cah. ORSTOM, sér. Biol., XIII, no 3, 189-270.<br />
Gouz~ M., 1973. - L’analyse <strong>minérale</strong> <strong>de</strong>s produits naturels. Organisation <strong>et</strong> mktho<strong>de</strong>s pour un<strong>la</strong>boratoire-d’analyse<br />
en skrie. Tome III. Sols. Roches. Minkraux, 308 p. Tome IV. Eaux.<br />
Végktaux. Eléments traces. Solutions titrées. Rapport ORSTOM, multigr., 338 p.<br />
GREENLAND D. J. & KOWAL J. M. L., 1960. - Nutrient content of the moist tropical forest of<br />
Ghana. P<strong>la</strong>nt and Soil, XII (2), 154-174.<br />
JAFPR~ T. & DE NAMUR Ch., 1983. - Évolution <strong>de</strong> <strong>la</strong> biomasse vegktale épigée au cours <strong>de</strong> <strong>la</strong> suc,<br />
cession secondaire <strong>dans</strong> le sud-ouest <strong>de</strong> <strong>la</strong> Côte-d’Ivoire. Acta Ecologica, Ecol. P<strong>la</strong>nt., 4 (18),<br />
na 3, 259-272.<br />
NYE P. H., 1958. -The re<strong>la</strong>tive importance of fallows and soils in storing p<strong>la</strong>nt nutrient in Ghana.<br />
J. W. Afr. Sci. Assoc., 4, 31-49.<br />
NYE P. H. & GREENLANG D. J., 1960. - The soil un<strong>de</strong>r shifting cultivation. Technical Communication,<br />
no 51, Commonwealth Bureau of Soils, Harpen<strong>de</strong>n, 156 p.<br />
Vol. 6 @O), no 3 - 1985
246 T. JAFFRÉ<br />
ORSTOM-UNESCO, 1983. -l Recherches sur les ressourceb naturelles. XM. Écosystbmes forestiers<br />
tropicaux d'Afrique, 473 p.<br />
STARK N., 1970. - The nutrient content of p<strong>la</strong>nts and soils from Brazil and Surinam. Biotropica,<br />
2, 51-60.<br />
TERGAS L. E. & POPENOE H. L., 1971. - Young secondary veg<strong>et</strong>ation and soil interactions in Izabal,<br />
Guatema<strong>la</strong>. P<strong>la</strong>nt and SoiI, 34, 675-690.<br />
Acta CEcologica/OZcologia P<strong>la</strong>ntarum