nonstationarity, covariance estimation and state-space ... - EPFL
nonstationarity, covariance estimation and state-space ... - EPFL
nonstationarity, covariance estimation and state-space ... - EPFL
You also want an ePaper? Increase the reach of your titles
YUMPU automatically turns print PDFs into web optimized ePapers that Google loves.
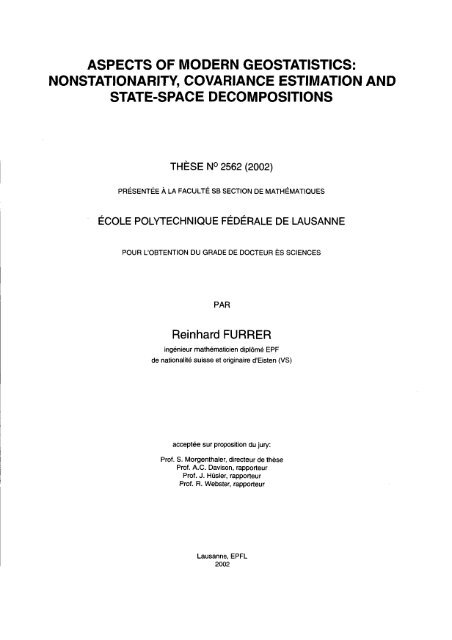
ASPECTS OF MODERN GEOSTATISTICS:<br />
NONSTATIONARITY, COVARIANCE ESTIMATION AND<br />
STATE-SPACE DECOMPOSITIONS<br />
THÈSE No 2562 (2002)<br />
PRÉSENTÉE A LA FACULTÉ SB SECTION DE MATHÉMATIQUES<br />
ÉCOLE POLYTECHNIQUE FÉDÉRALE DE LAUSANNE<br />
POUR L'OBTENTION DU GRADE DE DOCTEUR ÈS SCIENCES<br />
PAR<br />
Reinhard FURRER<br />
ingénieur mathématicien diplômé EPF<br />
de nationalité suisse et originaire dlEisten (VS)<br />
acceptée sur proposition du jury:<br />
Prof. S. Morgenthaler, directeur de thèse<br />
Prof. A.C. Davison, rapporteur<br />
Prof. J. Hüsler, rapporteur<br />
Prof. R. Webster, rapporteur<br />
Lausanne, <strong>EPFL</strong><br />
2002
A bstract<br />
Geostatistical data are measurements taken at fixed locations in a spatial domain. Generally the latter are<br />
spatially continuous, as is typically the case in mining engineering, geology, soi1 science, <strong>and</strong> hydrology.<br />
Geostatistical models are based on the concept of spatial or spatio-temporal processes <strong>and</strong> aim to describe<br />
the underlying dependence structure. Spatial variability is modeled as a function of the distance between<br />
sampling sites. Called the 'variogram' or 'covariogram', this function is used to apply statistical methods<br />
such as <strong>estimation</strong> <strong>and</strong>/or prediction, referred to as 'kriging' in the geostatistical context. To quantify the<br />
spatio-temporal dependence, <strong>estimation</strong> techniques relying on certain hypotheses of stationarity (seldom<br />
met in reality) are applied.<br />
Nonstationarity <strong>and</strong> <strong>covariance</strong> <strong>estimation</strong> are the underlying topics of the present thesis, which consists<br />
of four chapters.<br />
The first chapter gives a concise overview of geostatistical definitions <strong>and</strong> notation used throughout the<br />
thesis. Prior to generalizing the concepts to multivariate <strong>and</strong> spatio-temporal processes, they are explained<br />
on spatial processes.<br />
There exist many different forms of <strong>nonstationarity</strong>. Two of them are discussed in the second chapter.<br />
First, the case where the mean of the process depends on the location is studied. The identification of<br />
a trend is a nontrivial problem <strong>and</strong> we emphasize that there exists no trend <strong>estimation</strong> procedure for<br />
spatial processes with unknown dependence structure. Exploratory tools for the empirical variogram or<br />
for the observed process, as well as a commonly used parametric <strong>and</strong> nonparametric method for trend<br />
<strong>estimation</strong> are illustrated. A simple method that evolved out of the corisequences of visual data analysis is<br />
developed, namely variogram <strong>estimation</strong> based on 'local trend <strong>estimation</strong>'. The latter separates the domain<br />
in several subdomains, or patches, on which an individual trend is estimated, <strong>and</strong> the residuals are combined<br />
throughout the entire domain to allow global <strong>estimation</strong> <strong>and</strong>/or inference. Simulations show that a simple<br />
<strong>and</strong> almost arbitrary subdivision is already sufficient to improve the results of variogram <strong>estimation</strong>.<br />
Moreover, the method does not break down when the (heuristic) decomposition does not coincide with<br />
the (true) separation of the populations. Even if the true trend is not linear the method performs better<br />
than other well-known parametric or nonparametric trend <strong>estimation</strong> techniques. To underline these<br />
<strong>state</strong>ments the method is applied to real data. A second form of <strong>nonstationarity</strong> is the dependence of the<br />
<strong>covariance</strong> structure on the location. Under this circumstance classical covariogram <strong>estimation</strong> techniques<br />
are not applicable. For example, in atmospheric science one can easily imagine situations where the spatial<br />
dependence changes with time or where the maximum magnitude of variability may alter in time. For<br />
such phenornena new models are needed. Hence the remaining part of the second chapter discusses a<br />
new method of valid covariogram construction for nonstationary spatio-temporal processes. These new<br />
covariogram models are illustrated with simulations <strong>and</strong> an application to a dataset is given.<br />
Several statistical tools are based on the <strong>covariance</strong> matrix of the underlying process. An example of<br />
such a method is (functional) principal components analysis, which aims to represent a set of possibly<br />
vii
viii<br />
--<br />
Abstract<br />
correlated. variables into uncorrelated orthogonal components. These uncorrelated components can be<br />
construc.ted successively, each one extracting a maximal amount of the remaining variance. This often<br />
leads to an appreciable reduction in dimensionality, replacing the original variables by a few components.<br />
To calculate the orthogonal components the <strong>covariance</strong> matrix of a multivariate or spatio-temporal process<br />
is required. The latter is rarely known <strong>and</strong> therefore has to be estimated. As mentionecl, an important<br />
aspect o:f geostatistical datais dependence over <strong>space</strong> as well as over time. This has to be taken into account<br />
when esti:mating the <strong>covariance</strong> matrix <strong>and</strong> the natural estimator of the <strong>covariance</strong> matrix is introduced<br />
in the third chapter. It is shown that it is biased under spatio-temporal dependence. This bias is studied<br />
under two different asymptotic models, namely increasing the number of observations in the domain <strong>and</strong><br />
increasirig the domain by increasirig the number of locations. Using the first asymptotic mode1 we derive<br />
a fast <strong>and</strong> accurate bias correction, whereas the second asymptotic model serves to quantify the speed<br />
of convergence of the bias <strong>and</strong> the <strong>covariance</strong> of the components of the estimated <strong>covariance</strong> matrix. As<br />
shown, under mild hypotheses the asymptotic normality of the estimated <strong>covariance</strong> matrix holds <strong>and</strong> can<br />
be used .tc) test whether the eigenvectors of the estimated <strong>and</strong> the true <strong>covariance</strong> matrices are significantly<br />
different. This is revealed by examples, emphasizing the need for a bias correction. Furthermore, the<br />
theoretica.1 results are illustrated with Monte Carlo simulation studies <strong>and</strong> again with an application to<br />
real data.<br />
The niost commonly used decomposition to extract stationary parts of a process is based on the<br />
separatiori into different scales: (deterministic) large-scale variation, smooth small-scale variation, micro-<br />
scale variation <strong>and</strong> a measurement error. Although such additive partitioning is of considerable utility it<br />
also has several drawbacks, so an alternative analysis based on <strong>state</strong>-<strong>space</strong> decompositions is presented<br />
in the fclurth chapter. The <strong>space</strong> equation is a process governed by the <strong>state</strong> equation <strong>and</strong> an additional<br />
observational error, where the <strong>state</strong> at the point is a weighted mean of its neighborhood <strong>state</strong>s described<br />
by a kernel function plus a spatial process. The new model takes account of diverse shapes of trends <strong>and</strong><br />
one doer; not have to decide whether the process is stationary or not. As other existing decompositions<br />
can be reconstructed by the new representation, it can be seen as a generalization of existing ones. The<br />
decomposition results in a Fredholm integral equation of the second kind. By imposing separable kernels<br />
this integral equation has an explicit solution, <strong>and</strong> the model is defined by the parametrized covariogram of<br />
the spatial process <strong>and</strong> the parameters defining the kernel. In Our distribution-free model we will explore<br />
different rnethods based on minimal distances <strong>and</strong> moment equations for the parameter <strong>estimation</strong>, <strong>and</strong>, by<br />
generalking the concept of M-estimators to the dependent setting consistency for these new estimators is<br />
proven. The efficiency of the proposed method is discussed <strong>and</strong> the results are compared to other commonly<br />
used mcldels by means of extensive Monte Carlo simulations <strong>and</strong> applications to real datasets. Despite<br />
its complexity the new model furnishes an efficient <strong>and</strong> competitive approach throughout the simulations,<br />
which show that for most parameters this new estimator is more precise than the ordinary least squares<br />
estimator.
Version abrégée<br />
Les données géostatistiques sont constituées de mesures recueillies à des endroits déterminés dans<br />
le domaine spatial. Généralement elles sont continues spatialement ; des exemples typiques comprennent<br />
l'ingénierie minière, la géologie, la pédologie et l'hydrologie. Les modèles géostatistiques se basent sur le<br />
concept de processus spatial ou spatio-temporel et ont pour but de décrire la structure de dépendance sous-<br />
jacente. La variabilité spatiale est modélisée comme une fonction de la distance entre les sites échantillonnés.<br />
Cette fonction appelée 'variogramme' ou 'covariogramme' est utilisée afin d'appliquer des méthodes sta-<br />
tistiques comme l'<strong>estimation</strong> et/ou la prédiction, dénommée 'krigeage' dans le contexte géostatistique.<br />
Pour quantifier les dépendances spatio-temporelles, des techniques d'<strong>estimation</strong> se basant sur certaines<br />
hypothèse de stationnarité (rarement vérifiées dans la réalité) sont appliquées.<br />
La non-stationnarité et l'<strong>estimation</strong> de la <strong>covariance</strong> sont les thèmes sous-jacents de cette thèse qui est<br />
constituée de quatre chapitres.<br />
Le premier chapitre présente un survol court et concis des définitions et notations géostatistiques<br />
utilisées dans cette thèse. Préalables à la généralisation des concepts aux processus multivariés et spatio-<br />
temporels, elles sont établies relativement aux processus spatiaux univariés.<br />
Il existe beaucoup de différentes sortes de non-stationnarité, deux d'entre elles sont discutées dans<br />
le deuxième chapitre. Dans un premier temps le cas où la moyenne du processus dépend du site est<br />
étudiée. L'identification d'une tendance n'est pas un problème simple et nous soulignons qu'il n'existe pas<br />
de procédure d'<strong>estimation</strong> de la tendance pour les processus ponctuels dont la structure de dépendance<br />
est inconnue. Des outils exploratoires pour le variogramme empirique ou pour le processus observé, tout<br />
comme les méthodes paramétriques et non-paramétriques communément utilisées pour l'<strong>estimation</strong> de la<br />
tendance sont illustrées. Une méthode simple déduite de l'analyse visuelle des données est développée, à<br />
savoir l'<strong>estimation</strong> du variogramme basée sur 'l'<strong>estimation</strong> locale de la tendance'. Cette dernière sépare<br />
le domaine en plusieurs sous-doniaines ou morceaux, sur lesquels une tendance propre est estimée; les<br />
résidus sont combinés sur le domaine entier pour permettre une <strong>estimation</strong> et une inférence globales. Des<br />
simulations montrent qu'une subdivision simple et presque arbitraire suffit déjà à améliorer les résultats de<br />
l'<strong>estimation</strong> du variogramme. De plus la méthode fonctionne même lorsque la décomposition (heuristique)<br />
ne coïncide pas avec la (vraie) séparation des populations. Même dans le cas où la tendance n'est pas<br />
linéaire, la méthode donne de meilleurs résultats que les méthodes connues d'<strong>estimation</strong> paramétriques et<br />
non-paramétriques de la tendance. Pour souligner ces affirmations la méthode est appliquée à des données<br />
réelles. Une seconde forme de non-stationnarité est constituée par la dépendance de la structure de cova-<br />
riance par rapport au site. Dans ces circonstances les techniques d'<strong>estimation</strong> classiques ne peuvent pas<br />
s'appliquer. Par exemple, dans les sciences de l'atmosphère, il est facilement imaginable de rencontrer des<br />
situations où la dépendance spatiale change au cours du temps ou encore où la magnitude de variabilité<br />
maximale se modifie dans le temps. Pour de tels phénomènes le développement de nouveaux modèles est<br />
nécessaire. Par conséquent la partie restante du premier chapitre présente une nouvelle méthode valable
X<br />
-- Version abrégée<br />
pour la construction du covariogramme pour des processus spatio-temporels non-stationnaires. Ces nou-<br />
veaux modèles de covariogramme sont illustrés à l'aide de simulations et d'une application à un jeu de<br />
données.<br />
Plusieurs outils statistiques utilisent la matrice de <strong>covariance</strong> du processus sous-jacent. Un exemple<br />
d'une telle méthode est l'analyse en composantes principales (fonctionnelle) servant à représenter un en-<br />
semble de variables potentiellement corrélées par le biais de composantes orthogonales non corrélées. Ces<br />
composantes non corrélées peuvent être construites successivement, chacune extrayant une quantité maxi-<br />
male de la variance restante. Cela conduit souvent à une réduction appréciable de la dimension en rem-<br />
plaçant les variables par un nombre restreint de composantes. Pour calculer les composantes orthogonales<br />
la matrice de <strong>covariance</strong> d'un processus multivarié ou spatio-temporel est nécessaire. Cette dernière est<br />
rarement, connue et par conséquent doit être estimée. Comme précisé précédemment, une importante ca-<br />
ractéristique des données géostatistiques est leur dépendance à la fois spatiale et temporelle. Par conséquent<br />
cette caractéristique doit être prise en compte en estimant la matrice de <strong>covariance</strong>; un estimateur naturel<br />
de la <strong>covariance</strong> est présenté dans le troisième chapitre. Nous montrons qu'il est biaisé dans le cas d'une<br />
dépendance spatio-temporelle. Ce biais est étudié à l'aide de deux méthodes asymptotiques, à savoir en<br />
augmentant le nombre d'observations dans le domaine et en augmentant le domaine par le biais d'un ac-<br />
croissement du nombre de sites. En utilisant le premier modèle asymptotique nous obtenons une rapide et<br />
précise correction du biais, t<strong>and</strong>is que le second modèle asymptotique sert à quantifier la vitesse de conver-<br />
gence du biais et de la <strong>covariance</strong> des éléments de la matrice de <strong>covariance</strong> estimée. Nous démontrons<br />
que, sou:$ de légères hypothèses, la matrice de <strong>covariance</strong> estimée suit asymptotiquement une distribution<br />
normale. Cette propriété peut être utilisée pour tester si les vecteurs propres de la matrice de <strong>covariance</strong><br />
estimée et ceux de la vraie matrice de <strong>covariance</strong> sont significativement différents. Ce résultat est montré à<br />
l'aide d'exemples soulignant la nécessité de corriger le biais. De plus les propriétés théoriques sont illustrées<br />
à l'aide de simulations Monte-Carlo et à nouveau avec une application à des données réelles.<br />
La décomposition la plus fréquente pour extraire les parties stationnaires d'un processus utilise la<br />
séparation selon différentes échelles : une variation (déterministe) à longue échelle, une variation lissée à<br />
petite échelle, une variation à micro-échelle et une erreur de mesure. Bien qu'une telle partition additive<br />
soit d'une utilité considérable, elle comporte également plusieurs inconvénients. C'est pourquoi une ana-<br />
lyse alternative utilisant une décomposition en e<strong>space</strong> d'états est présentée dans le quatrième chapitre.<br />
L'équation d'e<strong>space</strong> est un processus régit par une équation d'état et une erreur d'observation addition-<br />
nelle, ou l'état en un point est une moyenne pondérée de ces états voisins décrite par une fonction de<br />
noyau plus un processus spatial. Le nouveau modèle prend en compte diverses formes de tendance et il<br />
n'est paf3 nécessaire de décider si le processus est stationnaire ou non. Comme d'autres décompositions<br />
existantes peuvent être reconstruites par la nouvelle représentation, elle peut être considérée comme une<br />
généralisation des méthodes existantes. La décomposition aboutit à une équation intégrale de Fredholm du<br />
second type. En imposant la séparabilité des noyaux cette équation intégrale possède une solution explicite<br />
et le modèle est défini par le covariogramme paramétrisé du processus spatial et les para.mètres définissant<br />
le noyau. Dans notre modèle libre de distribution nous explorons diverses méthodes basés sur les distances<br />
minimales et les équations des moments pour l'<strong>estimation</strong> des paramètres, et en généralisant le concept des<br />
M-estimateurs au concept de dépendance, la consistance de ces nouveaux estimateurs est prouvée. L'effi-<br />
cacité de la méthode proposée est discutée et les résultats sont comparés à d'autres modèles fréquemment<br />
utilisés pa.r le biais de simulations Monte Car10 étendues et d'applications à des jeux de données réelles.<br />
Malgré sa complexité le nouveau modèle fournit une approche efficace et compétitive dans toutes les si-<br />
mulations. Ce dernier montre également que pour la plupart des paramètres ce nouvel estimateur est plus<br />
précis que les estimateurs basés sur les moindres carrés ordinaires.
Kurzfassung<br />
Als geostatistische Daten bezeichnet man alle Arten von Messungen, die an einem bestimmten Orten<br />
in einem festgelegten raumlichen Gebiet vorgenommen wurden. Diese Gebiete sind gewohnlich stetig,<br />
wie zum Beispiel in der Geologie, der Hydrologie, den Erdwisssenschaften und im Bergwesen. Model-<br />
le für geostatistische Daten basieren auf raumlichen oder hum-Zeitprozessen, welche die innewohnende<br />
Abhanigkeitsstruktur zu beschreiben versuchen, zum Beispiel wird die raumliche Variabilitat (Kovarianz)<br />
durch eine Funktion der Stichprobenorte beschrieben. Diese Funktion wird üblicherweise Variogramm oder<br />
Kovariogramm genannt, ihre Verwendung zur Schatzung undIoder Vorhersage ist ein grundlegendes Ele-<br />
ment der Geostatistik. Die meisten Techniken zur Schatzung der Raum-Zeitabhanigkeitsstruktur basieren<br />
auf der Annahme, dass der zugrundeliegende Prozess stationar ist, diese Annahme entspricht jedoch nur<br />
selten der Realitat. Nichtstationaritat und Kovarianzschatzung bilden den roten Faden dieser Dissertation,<br />
die in die im Folgenden kurz zusammengefassten vier Kapitel aufgeteilt ist.<br />
Das erste Kapitel gibt einen kurzen Überblick über geostatistische Definitionen und Schreibweisen,<br />
welche spater gebraucht werden. Es wird mit raumlichen Prozessen begonnen und sukzessive zu mehrdi-<br />
mensionalen und Raum-Zeitprozessen verallgemeinert.<br />
Es existieren viele verschiedene Formen von Nichtstationaritat, von denen zwei im zweiten Kapitel<br />
genauer betrachtet werden. Im ersten Fall, Trend gennant, hiingt der Mittelwert des Prozesses vom Ort<br />
im Raum ab. Die Identifizierung eines Trends ist ein nichttriviales Problem und es wird versucht auf-<br />
zuzeigen, dass es keine optimale Trendschatzung gibt, wenn die zugrundeliegende Abhangigkeitsstruktur<br />
nicht bekannt ist. Wir zeigen einige explorative Datenanalysemethoden für empirische Variogramme und<br />
beobachtete Prozesse. Im Weiteren werden st<strong>and</strong>ardmassige parametrische und nichtparametrische Trend-<br />
anpassungsmethoden erlautert. Von diesen Methoden ausgehend wird eine neue, einfache Denkweise zur<br />
Variogrammschatzung beschrieben, 'Lokale Trendschatzung' genannt. Diese teilt das Gebiet in mehrere<br />
Untergebiete ein, auf welchen der Trend geschatzt wird. Die Residuen werden zusammengefasst und er-<br />
lauben eine globale Schatzung undIoder statistische Schlussfolgerungen. Simulationen zeigen, dass eine<br />
einfache und heuristische Aufteilung zu Verbesserung der Variogrammschatzung führt. Wenn der wahre<br />
(unbekannte) Trend nicht linear ist oder wenn die heuristische Aufteilung nicht der wahren (unbekannten)<br />
Aufteilung entspricht, ist die Methode besser als parametrische und nichtparametrische Trendschatzung,<br />
wie in Simulationen und in einer Anwendung gezeigt wird. Eine zweite Art der Nichtstationaritat ist die<br />
Abhangigkeit der Form der Kovarianzstruktur vom Messort oder von der Messzeit, unter diesen Umst<strong>and</strong>en<br />
ist die klassische Variogrammschatzung nicht moglich. Im Zusammenhang mit Untersuchungen der At-<br />
mosphare kann zum Beispiel die Grosse der Variabilitat der Daten von der Zeit abhangen, für solche<br />
Phanomene werden neue Modelle gebraucht. Im letzten Teil des zweiten Kapitels wird eine neue Methode<br />
zur Konstruktion von gültigen, nichtseparierbaren Kovariogrammen für nichtstationare Raum-Zeitprozesse<br />
hergeleitet. Diese neuen Kovariogramme werden mit Simulationen und einer Anwendung illustriert.<br />
Viele statistische Anwendungen basieren auf der Kovarianzmatrix des modellierten Prozesses. Ein<br />
klassisches Beispiel einer solchen Methode ist (funktionale) Hauptkomponentenanalyse, welche eine Menge
xii Kurzfassunn<br />
von korrelierten Variablen in unkorrelierte, orthogonale Komponenten transformiert. Diese unkorrelierten<br />
Komponenten konnen sukzessive konstruiert werden, jede extrahiert den maximalen Anteil der Restva-<br />
riabilitat. Dieser Ansatz dient haufig zur Dimensionsreduzion, indem die ursprünglichen Variablen durch<br />
einige wenige orthogonale Komponenten ersetzt werden. Um diese Kompenenten zu berechnen wird die<br />
Kovariaiizmatrix des Raum-Zeitprozesses gebraucht, von welcher oft nur eine Schatzung vorh<strong>and</strong>en ist.<br />
Da geostatistische Daten eine innewohnende Abhanigkeitsstruktur über Raum und Zeit besitzen, muss<br />
diese in der Schatzung der Kovarianzmatrix berücksichtigt werden. Im dritten Kapitel wird der natürliche<br />
Schatzer unter Raum-Zeitkorrelation untersucht und gezeigt, dass dieser Schatzer einem systematischen<br />
Fehler unterliegt. Die Verzerrung wird unter zwei verschiedenen asymptotischen Modellen betrachtet: Die<br />
Anzahl Beobachtungen nimmt entweder in einem festgelegten Gebiet oder in einem entsprechend sich ver-<br />
grossernden Gebiet zu. Unter dem ersten Blickwinkel wird eine schnelle und prazise Verzerrungskorrektur<br />
hergeleitet, in der zweiten Situation wird die Konvergenzrate der Terme der geschatzten Matrix bestimmt.<br />
Unter schwachen Voraussetzungeri wird asymptotische Normalitat des Schatzers gezeigt. Dieses Resul-<br />
tat ist riotwendig für Tests von Eigenvektoren der wahren und geschatzten Eigenwerte. Hierzu werden<br />
Beispiele beh<strong>and</strong>elt, die signifikante Unterschiede zwischen diesen Eigenvektoren aufweisen und somit die<br />
Notwendigkeit der Verzerrungskorrektur bestatigen. Die theoretischen Resultate werden mit Simulationen<br />
und Anwendungen auf realen Daten illustriert.<br />
Die am haufigsten genutzte Zerlegung zur Extraktion von stationaren Teilen eines Prozesses basiert auf<br />
einer additiven Trennung der Streuung: (deterministische) Variation in grossem Ausmass, glatte Variation<br />
in kleinem Ausmass, Variation im Mikroausmass und schliesslich ein Messfehler. Obwohl diese Zerlegung<br />
von grosser praktischer Bedeutung ist, hat sie mehrere Schwachpunkte. Eine neue und alternative Darstel-<br />
lung basierend auf einer Zerlegung des Zust<strong>and</strong>sraumes ist im vierten Kapitel beschrieben. Hierzu wird der<br />
Prozess beschrieben durch zwei Gleichungen, der Raumgleichung und der Zust<strong>and</strong>sgleichung. Die Raum-<br />
gleichung zerlegt den Gesamtprozess in einen von der Zust<strong>and</strong>sgleichung beschriebenen Teil und einen<br />
Messfehler, wahrend die Zust<strong>and</strong>sgleichun ein durch einen Kern gewichtetes Mittel und einen stationaren<br />
raumlichen Prozess enthalt. Diescs neue Modell kann verschiedene Formen von Trends beschreiben, des-<br />
halb wird eine subjektive Entscheidung bezüglich des Trends überflüssig. Zusatzlich konnen mit dem neuen<br />
Modell existierende Zerlegungen beschrieben werden, so dass die Zust<strong>and</strong>sraumzerlegung als eine Verallge-<br />
meinerung betrachtet werden kanu. Die Zust<strong>and</strong>sgleichung ist eine Fredholmsche Integralgleichung zweiter<br />
Art, wird ein separierbarer Kern vorausgesetzt, hat diese Gleichung eine explizite Losung und das Modell<br />
ist durc:h das parametrisierte Kovariogramm des stationaren raumlichen Prozesses und die Parameter des<br />
Kerns vollst<strong>and</strong>ig beschrieben. Trotz seiner Komplexitat ist dieser neue Ansatz effizient und kompetitiv,<br />
da die Sc'hatzung der meisten Parameter praziser ist als die Methode der kleinsten Quadrate.
Riassunto<br />
1 dati geostatistici sono costituiti da misure eseguite in punti definiti ne1 dominio spaziale. Solitamente<br />
sono continui spazialmente. L'ingegneria mineraria, la geologia, la geotecnica e l'idrologia sono degli<br />
esempi tipici. 1 modelli geostatistici si basano su1 concetto di processo spaziale O spazio-temporale e<br />
servono a descriverne la struttura di dipendenze. La variabilità spaziale è rappresentata da una funzione<br />
della distanza tra i luoghi di misura. Questa funzione è chiamata 'variogramma' O 'covariogramma' ed è<br />
utilizzata per applicare metodi statistici come la stima e/o la previsione, chiamati 'kriging' ne1 contesto<br />
geostatistico. Per quantificare le dipendenze spazio-temporali, si applicano delle tecniche di stima che si<br />
basano su ipotesi stazionarie che in pratica si verificano solo raramente.<br />
La non stazionarietà e la stima della cowrianza sono i temi di fondo di questa tesi che è costituita da<br />
quattro capitoli.<br />
Il primo capitolo presenta una panoramica breve e coincisa delle definizioni geostatistiche usate in questa<br />
tesi. E una premessa necessaria alla generalizzazione dei concetti ai processi multivariati e spazio-temporali;<br />
è stabilita in base ai processi spaziali univariati.<br />
Esistono molti tipi differenti di non stazionarietà, due dei quali sono trattati ne1 secondo capitolo. In un<br />
primo tempo ci si occupa del caso in cui la media del processo dipende da1 luogo. L'identificazione di una<br />
tendenza non è un problema semplice e si sottolinea che non esistono procedure di stima della tendenza<br />
per processi puntiformi la cui struttura di dipendenza non è nota. Si illustrano inoltre degli strumenti d'e-<br />
splorazione del variogramma empirico O del processo in esame, e dei metodi parametrici e non parametrici<br />
usati correntemente per la stima della tendenza. Si sviluppa un metodo semplice che deriva dall'analisi<br />
visuale dei dati, ossia la stima del variogramma basata sulla 'stima locale della tendenza'. Quest'ultima<br />
separa il dominio in diversi sottodominii O parti, nei quali si stima una tendenza propria; i residui vengono<br />
in seguito combinati sull'intero dominio per permettere una stima globale. Delle simulazioni mostrano<br />
che una suddivisione semplice e quasi arbitraria è già sufficiente per migliorare i risultati della stima del<br />
variogramma. In più, il metodo funziona anche quarido la scomposizione (euristica) non coincide con la<br />
(vera) separazione delle popolazioni. Anche ne1 caso in cui la tendenza non è lineare questo metodo for-<br />
nisce risultati migliori dei metodi già noti di stima parametrica e non parametrica della tendenza. Per<br />
verificare queste affermazioni il metodo viene applicato a dei dati reali. Una seconda forma di non stazio-<br />
narietà è costituita dalla dipendenza dalla struttura di covarianza rispetto al luogo. In queste circostanze<br />
le tecniche classiche di stima non si possono applicare. Per esempio, nelle scenze dell'atmosfera, si possono<br />
trovare facilmente situazioni nelle quali la dipendenza spaziale varia ne1 tempo O dove la magnitudine della<br />
massima variabilità si modifica ne1 tempo. Per tali fenomeni è necessario sviluppare nuovi modelli. Con-<br />
seguentemente la parte restante del primo capitolo presenta un nuovo metodo, valido per la creazione del<br />
covariogramma per dei processi spazio-temporali non stazionari. Questi nuovi niodelli vengono illustrati<br />
tramite simulazioni e un'applicazione ad un insieme di dati.
xiv Riassunto<br />
Diversi strumenti statistici usano la matrice di covarianza del processo di fondo. Un esempio di un<br />
tale metodo è l'analisi delle componenti principali (funzionali) che servono a rappresentare un insieme di<br />
variabili potenzialmente correlate tramite delle componenti ortogonali non correlate. Queste componenti<br />
non correlate possono venir costituite successivamente, in modo che ogniuna estragga la massima quantità<br />
di variariza rimanente. Questo porta spesso ad una riduzione notevole della dimensione sostituendo le<br />
variabili con un numero ristretto di componenti. Per calcolare le componenti ortogonali è necessaria<br />
la matrice di covarianza di un processo multivariato O spazio-temporale, ma quest'ultima è raramente<br />
conosciuta e bisogna quindi stimarla. Come precedentemente precisato, una caratteristica importante<br />
dei dati geostatistici è la loro dipendenza spaziale e temporale. Bisonga quindi tener conto di questa<br />
caratteristica per stimare la matrice di covarianza; uno stimatore naturale della covarianza viene presentato<br />
ne1 terzcl capitolo. Mostriamo che non è affidabile ne1 cas0 di una dipendenza spazio-temporale. Questo<br />
grazie a dei metodi asintotici, ossia aument<strong>and</strong>o il numero di osservazioni ne1 dominio O ingr<strong>and</strong>endo il<br />
dominio aument<strong>and</strong>o il numero di luoghi. Us<strong>and</strong>o il primo metodo asintotico otteniamo una correzione<br />
rapida e precisa dell'errore, mentre il secondo serve a quantificare la velocità di convergenza degli elementi<br />
della matrice di covarianza stimata. Dimostriamo inoltre, con delle ipotesi leggere, che la matrice di<br />
covarianza stimata segue asintoticamente una distribuzione normale. Questa proprietà pub essere usata<br />
per controllare se i vettori propri della matrice di cowrianza stimata e quelli della vera matrice di covarianza<br />
si differenziano in maniera significativa. Questo risultato è illustrato tramite degli esempi, e le proprietà<br />
teoriche sono illustrate con delle simulazioni di Monte-Carlo e con un'applicazione a dei dati reali.<br />
La scomposizione più frequente per estrarre le parti stazionarie di un processo usa la separazione a<br />
scale difl-èrenti: una variazione (determinista) a larga scala, una variazione lisciata a scla più piccola, una<br />
variaziorie a micro-scala e un errore di misura. Anche se una tale ripartizione è di notevole aiuto, comporta<br />
anche diversi inconvenienti. Per questa ragione si presenta ne1 quarto capitolo un'analisi alternativa che<br />
usa una scomposizione ne110 spazio degli stati. L7equazione di spazio è un processo retto da un'equazione<br />
di stato e da un errore d'osservazione addizionale, dove 10 stato in un punto è una media ponderata<br />
degli stati vicini che è descritta da una funzione 'kernel' e da un processo spaziale. Il nuovo modello<br />
tiene conto di diverse forme di tendenza e non è necessario decidere se il processo è stazionario O no.<br />
Siccome altre scomposizioni esistenti possono essere ricostruite con la nuova rappresentazione, si pub<br />
considerarla una generalizzazione dei metodi esistenti. La scomposizione porta a un'equazione integrale<br />
di Fredholm di secondo tipo. Imponendo la separazione dei 'kernel' questa equazione integrale possiede<br />
una soluzione esplicita e il modello è definito da1 covariogramma parametrico del processo spaziale e i<br />
parametri definiscono il 'kernel'. Ne1 nostro modello esploriamo diversi metodi basati sulle distanze minime<br />
e le equitzioni dei momenti per la stima dei parametri e, generalizz<strong>and</strong>o il concetto degli M-stimatori al<br />
concetto di dipendenza, si prova la consistenza di questi nuovi stimatori. Si discute l'efficacia del metodo<br />
proposto e si confrontano i risultati con quelli di altri modelli usati correntemente tramite simulazioni<br />
estese di Monte Carlo e applicazioni con dati concreti. Malgrado la sua comlessità il nuovo modello risulta<br />
efficace t: competitivo in tutte le simulazioni. Si rivela inoltre più preciso degli stimatori basati sui minimi<br />
quadrati ordinari per la maggior parte dei parametri.
Contents<br />
Acknowledgernents<br />
Abstract<br />
Version abrégée<br />
Kurzfassung<br />
Riassunto<br />
Contents<br />
List of Figures<br />
List of Tables<br />
Prologue<br />
Overview of Geostatistical Data Analysis <strong>and</strong> Modeling 1<br />
.........................................<br />
1.1 Historical Overview 1<br />
............................................<br />
1.1.1 Genesis 1<br />
..........................................<br />
1.1.2 Quo Vadis 2<br />
.....................................<br />
1.2 Univariate Spatial Processes 3<br />
.................................<br />
1.2.1 Stationarity <strong>and</strong> Ergodicity 4<br />
1.2.2 Anisotropy .......................................... 5<br />
..................................<br />
1.2.3 Additive Decompositions 5<br />
.............................<br />
1.2.4 Characterization Using Variograms 6<br />
............................<br />
1.2.5 Characterization Using Covariograms 8<br />
1.3 Estimation of the Second Moment Structure ............................ 9<br />
..................................<br />
1.3.1 Estimation of Variograms 9<br />
..................................<br />
1.3.2 Variogram Model Fitting 11<br />
..........................................<br />
1.4 Spatial Prediction 12<br />
............................................<br />
1.4.1 Kriging 12<br />
vii<br />
ix<br />
xi<br />
...<br />
Xlll<br />
xv<br />
xix<br />
xxi<br />
xxiii
xvi Contents<br />
1.4.2 Other Interpolation Approaches . .............................. 13<br />
1.4.3 Stability of Kriging ..................................... 14<br />
1.5 h9ultivariate Spatial Processes ................................... 15<br />
1.6 Spatio-Temporal Processes ..................................... 16<br />
2 Nonstationarity Issues in Geostatistical Modeling 19<br />
2.1 T'rend Detection <strong>and</strong> Global Fitting . ................................ 19<br />
2.1.1 Exploratory Examination of the Process .......................... 20<br />
2.1.2 Fitting Parametric Models ................................. 24<br />
2.1.3 Fitting Nonparametric Models ............................... 26<br />
2.2 Local Trend Estimation ....................................... 27<br />
2.2.1 Simulations ......................................... 29<br />
2.2.2 Application ......................................... 29<br />
2.2.3 Local Variogram <strong>estimation</strong> . ................................ 34<br />
2.3 Covariograms of Nonstationary Spatio-Temporal Processes .................... 35<br />
2.3.1 Spectral Representation ................................... 35<br />
2.3.2 Simulations ......................................... 38<br />
2.3.3 Application ......................................... 40<br />
3 Covariance Estimation of Geostatistical Data 45<br />
3.1 Motivation .............................................. 45<br />
3.2 The Estimator Û .......................................... 46<br />
3.3 Asymptotic Considerations ..................................... 49<br />
3.3.1 Limiting Bias ........................................ 50<br />
3.3.2 Asymptotic Bias ....................................... 53<br />
3.3.3 R<strong>and</strong>om <strong>and</strong> lrregular Locations .............................. 57<br />
3.4 Eigenvalues <strong>and</strong> Eigenvectors of U ................................. 59<br />
3.4.1 AsymptoticDistribution ................................... 59<br />
3.4.2 Confidence Cones ...................................... 63<br />
3.5 Simulations ............................................. 66<br />
3.6 Application . ............................................. 71<br />
4 State-Space Decomposition of Geostatistical Processes<br />
4.1 Motivation . .............................................<br />
4.2 State-Space Decompositions ....................................<br />
4.2.1 State Equation with a Degenerate Kernel .........................<br />
4.2.2 Other Types of State Equations ..............................<br />
4.3 Parameter Estimation ........................................<br />
4.3.1 Moment Equations .....................................<br />
4.3.2 Consistency .........................................<br />
4.3.3 lnference ...........................................<br />
4.3.4 OLS, WLS, GLS <strong>and</strong> Robust Estimation ..........................<br />
.........................................<br />
4.4 lllustrative Examples<br />
4.4.1 Three Parameter Model . ..................................<br />
4.4.2 Gaussian Process with N = 1 . ...............................
Contents xvii<br />
4.5 Simulations ............................................. 91<br />
4.5.1 Numerical lntegration .................................... 91<br />
4.5.2 Estimation of Cij ...................................... 92<br />
4.5.3 Studies on the lmplementation of SSD ........................... 93<br />
4.5.4 Trend Contamination <strong>and</strong> True /3 # O ........................... 96<br />
4.6 Application . ............................................. 97<br />
4.6.1 Prediction .......................................... 97<br />
4.6.2 SIC97 Data ......................................... 98<br />
4.6.3 Lake Geneva Data . ..................................... 99<br />
4.7 Summary <strong>and</strong> Outlook ....................................... 101<br />
Epilogue<br />
Appendix 105<br />
A Datasets 105<br />
A.l SIC97 Data ............................................. 105<br />
A.2 Lake Geneva Data .......................................... 106<br />
A.3 Ozone Data ............................................. 108<br />
B Supplementary Simulation Results 111<br />
B.l Nonstationary Issues . ........................................ 112<br />
B.l.l Trend Detection ....................................... 112<br />
B.1.2 Local Trend Estimation ................................... 113<br />
B.2 Functional Principal Components Analysis ............................. 114<br />
B.3 State-Space Representation ..................................... 116<br />
Glossary<br />
References<br />
Author lndex<br />
Subject lndex<br />
Curriculum Vitae


