THÈSE - Université de Franche-Comté
THÈSE - Université de Franche-Comté THÈSE - Université de Franche-Comté
Fig. 3. organ yield minen nfertil cutting k p ploughing broma Axis 2: 18.2 % sumgraz autgraz Thèse C. Morilhat 2005 123 grazing spgraz Axis 1: 31.6 %
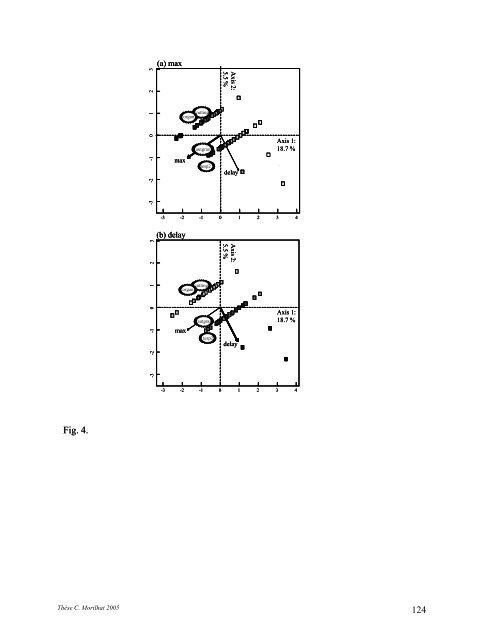
Fig. 4. -3 -2 -1 0 1 2 3 -3 -2 -1 0 1 2 3 (a) max max cutting organ autgraz tesp2 Axis 2: 5.5 % delay Axis 1: 18.7 % -3 -2 -1 0 1 2 3 4 (b) delay max cutting organ autgraz tesp2 Axis 2: 5.5 % delay Axis 1: 18.7 % -3 -2 -1 0 1 2 3 4 Thèse C. Morilhat 2005 124
- Page 75 and 76: 5.3.2.4. Relation entre populations
- Page 77 and 78: Pour cette raison, il a été déci
- Page 79 and 80: Influence des Groupes Fonctionnels
- Page 81 and 82: Figure 21. Un herbomètre (Fabricat
- Page 83 and 84: La relation entre les paramètres s
- Page 85 and 86: printemps suivant de M. arvalis ; l
- Page 87 and 88: 5.4.2.1.2. Estimation des densités
- Page 89 and 90: 5.4.2.2. Résultats 5.4.2.2.1. Eche
- Page 91 and 92: Tableau 14. Corrélations entre var
- Page 93 and 94: A. terrestris Nos résultats (Table
- Page 95 and 96: que dans les parcelles à bordures
- Page 97 and 98: micromammifère estimées dans la p
- Page 99 and 100: au point de ce jeu de variables a f
- Page 101 and 102: Summary 1. Small mammals are the mo
- Page 103 and 104: shown that farming practices can im
- Page 105 and 106: organization for crop protection) s
- Page 107 and 108: Correlations between population dyn
- Page 109 and 110: Influence of soil work on A. terres
- Page 111 and 112: wildlife by trampling, thus disturb
- Page 113 and 114: cannot thus be considered as an alt
- Page 115 and 116: Gilg, O., Hanski, I., & Sittler, B.
- Page 117 and 118: Meylan, A. & Höhn, H. (1991) Taupe
- Page 119 and 120: Table 1. Description of the 13 farm
- Page 121 and 122: Table 3. Correlations between farmi
- Page 123 and 124: Squared symbols are sampling parcel
- Page 125: Fig. 2. A. terrestris relative abun
- Page 129 and 130: 6.3. Relation entre populations de
- Page 131 and 132: Les travaux de terrain ont été r
- Page 133 and 134: communale) et intègre les DR de T.
- Page 135 and 136: Conclusion La précocité du démar
- Page 137 and 138: 7.2.2. Analyses pédologiques La va
- Page 139 and 140: 7.2.3. Analyse des données Pour ch
- Page 141 and 142: limon lf lg proftot (a) vers cn str
- Page 143 and 144: Les valeurs du maximum de densité
- Page 145 and 146: Tableau 19. Corrélations entre les
- Page 147 and 148: cinétiques de A. terrestris qu’i
- Page 149 and 150: 8. SEPTIÈME PARTIE : SYNTHÈSE et
- Page 151 and 152: des dynamiques de populations de A.
- Page 153 and 154: Perspectives de recherche Les résu
- Page 155 and 156: T. europaea et M. arvalis Malgré l
- Page 157 and 158: Tableau 18. Corrélations entre les
- Page 159 and 160: Figure 16. Cercle des corrélations
- Page 161 and 162: Bergeron, J.M. & Jodoin, L. (1983)
- Page 163 and 164: Crick, H.Q.P., Baillie, S.R., Balme
- Page 165 and 166: Duchaufour, P. (1995) Pédologie :
- Page 167 and 168: echinococcosis: strategy for eradic
- Page 169 and 170: Hedin, L., Kerguelen, M., & De Mont
- Page 171 and 172: Korpimaki, E., Brown, P.R., Jacob,
- Page 173 and 174: Moissenet, M.F. (1994) Prairies et
- Page 175 and 176: R-Development-Core-Team (2004) R: A
Fig. 4.<br />
-3 -2 -1 0 1 2 3<br />
-3 -2 -1 0 1 2 3<br />
(a) max<br />
max<br />
cutting<br />
organ<br />
autgraz<br />
tesp2<br />
Axis 2:<br />
5.5 %<br />
<strong>de</strong>lay<br />
Axis 1:<br />
18.7 %<br />
-3 -2 -1 0 1 2 3 4<br />
(b) <strong>de</strong>lay<br />
max<br />
cutting<br />
organ<br />
autgraz<br />
tesp2<br />
Axis 2:<br />
5.5 %<br />
<strong>de</strong>lay<br />
Axis 1:<br />
18.7 %<br />
-3 -2 -1 0 1 2 3 4<br />
Thèse C. Morilhat 2005 124


