Plan régional de la qualité de l'air en Normandie 2010 - 2015 (.pdf)
Plan régional de la qualité de l'air en Normandie 2010 - 2015 (.pdf) Plan régional de la qualité de l'air en Normandie 2010 - 2015 (.pdf)
82 PRQA EN NORMANDIE Le Tableau 11 illustre les évolutions annuelle et journalière type observées pour l’ozone. 70 60 50 40 30 20 10 0 janvier µg/m 3 février mars avril Tableau 11 - Profils moyens d'évolution de l’ozone (source: données 2001-2007 fournies par Air C.O.M. et Air Normand) Profil moyen annuel Evolution annuelle O 3 mai juin juillet août Moyenne des stations de mesures Le profil annuel des concentrations moyenne en ozone montre une forte disparité entre la période estivale et la période hivernale. Celle-ci s’explique par l’origine photochimique (liée au rayonnement solaire) de la production de ce polluant. septembre octobre novembre décembre 100 Partie 1 : Inventaire et Enjeux Inventaire et Enjeux en Normandie 90 80 70 60 50 40 30 20 10 0 µg/m 3 01:00 02:00 03:00 04:00 05:00 06:00 Profils moyens journaliers Profils moyens journalier O 3 07:00 08:00 09:00 10:00 11:00 12:00 Moyenne des stations de mesures en 2003 Moyenne des stations de mesures en 2007 Le profil moyen journalier des concentrations en ozone montre également une disparité entre les concentrations mesurées en fin de matinée et l’après midi, lorsque le rayonnement solaire est le plus important, et la nuit ou le début de matinée. Le profil des courbes « en cloche » est associé aux conditions optimales de formation de l’ozone. La comparaison des courbes pour les années 2003 et 2007 montre, à échelle équivalente, que les teneurs enregistrées en 2003 ont atteint des niveaux sensiblement supérieurs à ceux enregistrés en 2007, du fait de conditions de formation beaucoup plus favorables lors de la canicule 13:00 14:00 15:00 16:00 17:00 18:00 19:00 20:00 21:00 22:00 23:00 00:00
PRQA EN NORMANDIE Partie 1 : Inventaire et Enjeux Inventaire et Enjeux en Normandie 83
- Page 32 and 33: 32 PRQA EN NORMANDIE D.2.2. Impacts
- Page 34 and 35: 34 PRQA EN NORMANDIE E.2. Quels son
- Page 36 and 37: 36 PRQA EN NORMANDIE Conclusions of
- Page 38 and 39: 38 PRQA EN NORMANDIE L’homme est
- Page 41: PRQA EN NORMANDIE LES OUTILS DE GES
- Page 44 and 45: 44 PRQA EN NORMANDIE G.2. Maîtrise
- Page 46 and 47: 46 PRQA EN NORMANDIE • La loi 200
- Page 48 and 49: 48 PRQA EN NORMANDIE Les orientatio
- Page 50 and 51: 50 PRQA EN NORMANDIE H.3. Prévenir
- Page 52 and 53: 52 PRQA EN NORMANDIE Une évaluatio
- Page 54 and 55: 54 PRQA EN NORMANDIE H.5. Fixer les
- Page 56 and 57: 56 PRQA EN NORMANDIE I. Les outils
- Page 58 and 59: 58 PRQA EN NORMANDIE • Campagnes
- Page 60 and 61: 60 PRQA EN NORMANDIE - En ce qui co
- Page 62 and 63: 62 Les réseaux de surveillance de
- Page 64 and 65: 64 PRQA EN NORMANDIE J. Les outils
- Page 66 and 67: 66 PRQA EN NORMANDIE • Les grands
- Page 68 and 69: 68 PRQA EN NORMANDIE THEMES COHEREN
- Page 71 and 72: PRQA EN NORMANDIE L. Etat des lieux
- Page 73 and 74: Polluant Dioxyde de soufre (SO (SO2
- Page 75 and 76: SO 2 (µg/m 3 ) 50 40 30 20 10 0 L.
- Page 77 and 78: PRQA EN NORMANDIE Partie 1 : Invent
- Page 79 and 80: PM10 (µg/m 3 ) 50 40 30 20 10 0 PR
- Page 81: PRQA EN NORMANDIE Récapitulatif Po
- Page 86 and 87: Monoxyde de carbone (µg/m 3 ) 800
- Page 88 and 89: 88 PRQA EN NORMANDIE L.1.8. Les pol
- Page 90 and 91: 2006 2005 2004 2003 2002 2001 90 PR
- Page 92 and 93: 92 PRQA EN NORMANDIE Concernant les
- Page 94 and 95: 94 PRQA EN NORMANDIE peuvent prése
- Page 96 and 97: 96 PRQA EN NORMANDIE L.5. Les enjeu
- Page 98 and 99: 98 PRQA EN NORMANDIE Les oxydes d
- Page 100 and 101: 100 PRQA EN NORMANDIE Le méthane (
- Page 102 and 103: 102 PRQA EN NORMANDIE Les particule
- Page 104 and 105: 104 PRQA EN NORMANDIE M.2.2. Bilan
- Page 106 and 107: 106 PRQA EN NORMANDIE secteurs (aut
- Page 108 and 109: 108 PRQA EN NORMANDIE Figure 28 - R
- Page 110 and 111: 110 PRQA EN NORMANDIE M.3.4. Action
- Page 112 and 113: 112 PRQA EN NORMANDIE menées par l
- Page 114 and 115: 114 PRQA EN NORMANDIE M.4.3. Outils
- Page 116 and 117: 116 PRQA EN NORMANDIE A propos des
- Page 118 and 119: 118 PRQA EN NORMANDIE Quelques rés
- Page 120 and 121: 120 PRQA EN NORMANDIE Dans le bilan
- Page 122 and 123: 122 PRQA EN NORMANDIE Réglementati
- Page 124 and 125: 124 • Concernant le chauffage ind
- Page 126 and 127: 126 PRQA EN NORMANDIE - Qualité de
- Page 128 and 129: 128 PRQA EN NORMANDIE - Pour les ac
- Page 130 and 131: 130 PRQA EN NORMANDIE de taille plu
82<br />
PRQA EN NORMANDIE<br />
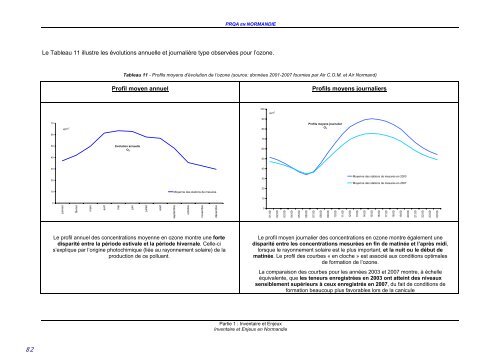
Le Tableau 11 illustre les évolutions annuelle et journalière type observées pour l’ozone.<br />
70<br />
60<br />
50<br />
40<br />
30<br />
20<br />
10<br />
0<br />
janvier<br />
µg/m 3<br />
février<br />
mars<br />
avril<br />
Tableau 11 - Profils moy<strong>en</strong>s d'évolution <strong>de</strong> l’ozone (source: données 2001-2007 fournies par Air C.O.M. et Air Normand)<br />
Profil moy<strong>en</strong> annuel<br />
Evolution annuelle<br />
O 3<br />
mai<br />
juin<br />
juillet<br />
août<br />
Moy<strong>en</strong>ne <strong>de</strong>s stations <strong>de</strong> mesures<br />
Le profil annuel <strong>de</strong>s conc<strong>en</strong>trations moy<strong>en</strong>ne <strong>en</strong> ozone montre une forte<br />
disparité <strong>en</strong>tre <strong>la</strong> pério<strong>de</strong> estivale et <strong>la</strong> pério<strong>de</strong> hivernale. Celle-ci<br />
s’explique par l’origine photochimique (liée au rayonnem<strong>en</strong>t so<strong>la</strong>ire) <strong>de</strong> <strong>la</strong><br />
production <strong>de</strong> ce polluant.<br />
septembre<br />
octobre<br />
novembre<br />
décembre<br />
100<br />
Partie 1 : Inv<strong>en</strong>taire et Enjeux<br />
Inv<strong>en</strong>taire et Enjeux <strong>en</strong> <strong>Normandie</strong><br />
90<br />
80<br />
70<br />
60<br />
50<br />
40<br />
30<br />
20<br />
10<br />
0<br />
µg/m 3<br />
01:00<br />
02:00<br />
03:00<br />
04:00<br />
05:00<br />
06:00<br />
Profils moy<strong>en</strong>s journaliers<br />
Profils moy<strong>en</strong>s journalier<br />
O 3<br />
07:00<br />
08:00<br />
09:00<br />
10:00<br />
11:00<br />
12:00<br />
Moy<strong>en</strong>ne <strong>de</strong>s stations <strong>de</strong> mesures <strong>en</strong> 2003<br />
Moy<strong>en</strong>ne <strong>de</strong>s stations <strong>de</strong> mesures <strong>en</strong> 2007<br />
Le profil moy<strong>en</strong> journalier <strong>de</strong>s conc<strong>en</strong>trations <strong>en</strong> ozone montre égalem<strong>en</strong>t une<br />
disparité <strong>en</strong>tre les conc<strong>en</strong>trations mesurées <strong>en</strong> fin <strong>de</strong> matinée et l’après midi,<br />
lorsque le rayonnem<strong>en</strong>t so<strong>la</strong>ire est le plus important, et <strong>la</strong> nuit ou le début <strong>de</strong><br />
matinée. Le profil <strong>de</strong>s courbes « <strong>en</strong> cloche » est associé aux conditions optimales<br />
<strong>de</strong> formation <strong>de</strong> l’ozone.<br />
La comparaison <strong>de</strong>s courbes pour les années 2003 et 2007 montre, à échelle<br />
équival<strong>en</strong>te, que les t<strong>en</strong>eurs <strong>en</strong>registrées <strong>en</strong> 2003 ont atteint <strong>de</strong>s niveaux<br />
s<strong>en</strong>siblem<strong>en</strong>t supérieurs à ceux <strong>en</strong>registrés <strong>en</strong> 2007, du fait <strong>de</strong> conditions <strong>de</strong><br />
formation beaucoup plus favorables lors <strong>de</strong> <strong>la</strong> canicule<br />
13:00<br />
14:00<br />
15:00<br />
16:00<br />
17:00<br />
18:00<br />
19:00<br />
20:00<br />
21:00<br />
22:00<br />
23:00<br />
00:00


