Plan régional de la qualité de l'air en Normandie 2010 - 2015 (.pdf)
Plan régional de la qualité de l'air en Normandie 2010 - 2015 (.pdf)
Plan régional de la qualité de l'air en Normandie 2010 - 2015 (.pdf)

Create successful ePaper yourself
Turn your PDF publications into a flip-book with our unique Google optimized e-Paper software.
PRQA EN NORMANDIE<br />
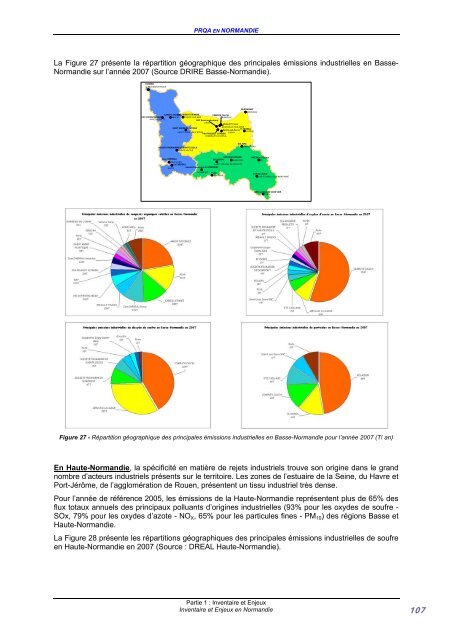
La Figure 27 prés<strong>en</strong>te <strong>la</strong> répartition géographique <strong>de</strong>s principales émissions industrielles <strong>en</strong> Basse-<br />
<strong>Normandie</strong> sur l’année 2007 (Source DRIRE Basse-<strong>Normandie</strong>).<br />
COGEMA<br />
BEAUMONT-HAGUE<br />
BURONOMIC<br />
HONFLEUR<br />
CARGILL FRANCE UCL ISIGNY STE MERE<br />
CIMENTS CALCIA<br />
CPC COTENTIN HELIO BAUPTE ISIGNY-SUR-MER<br />
RANVILLE<br />
HAYE-DU-PUITS<br />
NXP Semiconducteurs<br />
CAEN<br />
R<strong>en</strong>ault Trucks<br />
BLAINVILLE-SUR-ORNE<br />
SAINT ANDRE PLASTIQUE<br />
PLYSOROL<br />
Saint-Louis Sucre<br />
LISIEUX<br />
SAINT-ANDRE-DE-L'EPINE<br />
CAGNY<br />
PSA PEUGEOT CITROEN<br />
CORMELLES-LE-ROYAL<br />
SOCIETE FROMAGERE DE SAINTE CECILE<br />
SAINTE-CECILE<br />
SOLAIPA<br />
VIMOUTIERS<br />
Jean CHEREAU<br />
AVRANCHES<br />
AMCOR FLEXIBLES<br />
BOLAIDOR ARGENTAN<br />
KME Brass France<br />
RAI<br />
Jean CHEREAU<br />
SAINT-HILAIRE-DE-BRIOUZE<br />
DUCEY<br />
Société Fromagère <strong>de</strong> DOMFRONT<br />
DOMFRONT PCAS<br />
COUTERNE<br />
ETS CAILLAUD<br />
SAINT-LANGIS-LES-MORTAGNE<br />
METALLISATION SOUS VIDE<br />
THEIL<br />
Figure 27 - Répartition géographique <strong>de</strong>s principales émissions industrielles <strong>en</strong> Basse-<strong>Normandie</strong> pour l’année 2007 (T/ an)<br />
En Haute-<strong>Normandie</strong>, <strong>la</strong> spécificité <strong>en</strong> matière <strong>de</strong> rejets industriels trouve son origine dans le grand<br />
nombre d’acteurs industriels prés<strong>en</strong>ts sur le territoire. Les zones <strong>de</strong> l’estuaire <strong>de</strong> <strong>la</strong> Seine, du Havre et<br />
Port-Jérôme, <strong>de</strong> l’agglomération <strong>de</strong> Rou<strong>en</strong>, prés<strong>en</strong>t<strong>en</strong>t un tissu industriel très <strong>de</strong>nse.<br />
Pour l’année <strong>de</strong> référ<strong>en</strong>ce 2005, les émissions <strong>de</strong> <strong>la</strong> Haute-<strong>Normandie</strong> représ<strong>en</strong>t<strong>en</strong>t plus <strong>de</strong> 65% <strong>de</strong>s<br />
flux totaux annuels <strong>de</strong>s principaux polluants d’origines industrielles (93% pour les oxy<strong>de</strong>s <strong>de</strong> soufre -<br />
SOx, 79% pour les oxy<strong>de</strong>s d’azote - NOX, 65% pour les particules fines - PM10) <strong>de</strong>s régions Basse et<br />
Haute-<strong>Normandie</strong>.<br />
La Figure 28 prés<strong>en</strong>te les répartitions géographiques <strong>de</strong>s principales émissions industrielles <strong>de</strong> soufre<br />
<strong>en</strong> Haute-<strong>Normandie</strong> <strong>en</strong> 2007 (Source : DREAL Haute-<strong>Normandie</strong>).<br />
Partie 1 : Inv<strong>en</strong>taire et Enjeux<br />
Inv<strong>en</strong>taire et Enjeux <strong>en</strong> <strong>Normandie</strong> 107