Proceedings of the Second Mediterranean Symposium on Marine
Proceedings of the Second Mediterranean Symposium on Marine
Proceedings of the Second Mediterranean Symposium on Marine

Create successful ePaper yourself
Turn your PDF publications into a flip-book with our unique Google optimized e-Paper software.
PROCEEDINGS OF THE SECOND MEDITERRANEAN SYMPOSIUM ON MARINE VEGETATION (ATHENS, 12-13 DECEMBER 2003)<br />
194<br />
Six samplings were carried out between<br />
summer 1998 and spring 2002 (August 98,<br />
March 99, June 99, June 01, September 01 and<br />
March 02) in order to m<strong>on</strong>itor <str<strong>on</strong>g>the</str<strong>on</strong>g> marine<br />
benthic vegetati<strong>on</strong> characteristics. The sampling<br />
was destructive (1 random sample from a<br />
permanent stati<strong>on</strong>-square 5 x 5 m per sampling<br />
period) <strong>on</strong> a quadrate 20cm x 20cm, which is<br />
c<strong>on</strong>sidered to be <str<strong>on</strong>g>the</str<strong>on</strong>g> minimal sampling area in<br />
<str<strong>on</strong>g>the</str<strong>on</strong>g> case <str<strong>on</strong>g>of</str<strong>on</strong>g> <str<strong>on</strong>g>the</str<strong>on</strong>g> <str<strong>on</strong>g>Mediterranean</str<strong>on</strong>g> infralittoral<br />
communities.<br />
Phytobenthos community structure was<br />
analyzed in terms <str<strong>on</strong>g>of</str<strong>on</strong>g> species number, total<br />
coverage, Shann<strong>on</strong>-Weaver diversity (H’, log2<br />
basis) and Pielou evenness (J’) indices.<br />
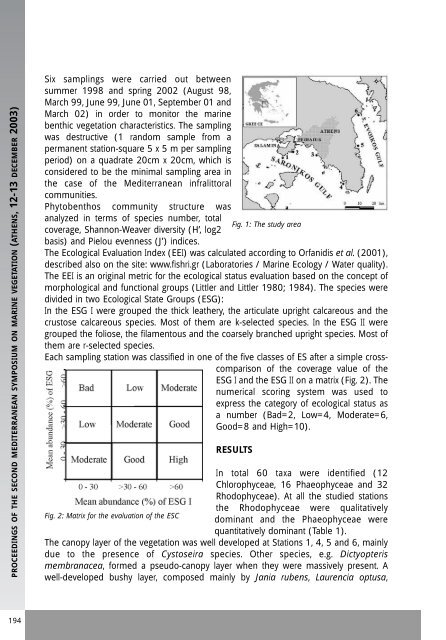
Fig. 1: The study area<br />
The Ecological Evaluati<strong>on</strong> Index (EEI) was calculated according to Orfanidis et al. (2001),<br />
described also <strong>on</strong> <str<strong>on</strong>g>the</str<strong>on</strong>g> site: www.fishri.gr (Laboratories / <strong>Marine</strong> Ecology / Water quality).<br />
The EEI is an original metric for <str<strong>on</strong>g>the</str<strong>on</strong>g> ecological status evaluati<strong>on</strong> based <strong>on</strong> <str<strong>on</strong>g>the</str<strong>on</strong>g> c<strong>on</strong>cept <str<strong>on</strong>g>of</str<strong>on</strong>g><br />
morphological and functi<strong>on</strong>al groups (Littler and Littler 1980; 1984). The species were<br />
divided in two Ecological State Groups (ESG):<br />
In <str<strong>on</strong>g>the</str<strong>on</strong>g> ESG I were grouped <str<strong>on</strong>g>the</str<strong>on</strong>g> thick lea<str<strong>on</strong>g>the</str<strong>on</strong>g>ry, <str<strong>on</strong>g>the</str<strong>on</strong>g> articulate upright calcareous and <str<strong>on</strong>g>the</str<strong>on</strong>g><br />
crustose calcareous species. Most <str<strong>on</strong>g>of</str<strong>on</strong>g> <str<strong>on</strong>g>the</str<strong>on</strong>g>m are k-selected species. In <str<strong>on</strong>g>the</str<strong>on</strong>g> ESG II were<br />
grouped <str<strong>on</strong>g>the</str<strong>on</strong>g> foliose, <str<strong>on</strong>g>the</str<strong>on</strong>g> filamentous and <str<strong>on</strong>g>the</str<strong>on</strong>g> coarsely branched upright species. Most <str<strong>on</strong>g>of</str<strong>on</strong>g><br />
<str<strong>on</strong>g>the</str<strong>on</strong>g>m are r-selected species.<br />
Each sampling stati<strong>on</strong> was classified in <strong>on</strong>e <str<strong>on</strong>g>of</str<strong>on</strong>g> <str<strong>on</strong>g>the</str<strong>on</strong>g> five classes <str<strong>on</strong>g>of</str<strong>on</strong>g> ES after a simple crosscomparis<strong>on</strong><br />
<str<strong>on</strong>g>of</str<strong>on</strong>g> <str<strong>on</strong>g>the</str<strong>on</strong>g> coverage value <str<strong>on</strong>g>of</str<strong>on</strong>g> <str<strong>on</strong>g>the</str<strong>on</strong>g><br />
ESG I and <str<strong>on</strong>g>the</str<strong>on</strong>g> ESG II <strong>on</strong> a matrix (Fig. 2). The<br />
numerical scoring system was used to<br />
express <str<strong>on</strong>g>the</str<strong>on</strong>g> category <str<strong>on</strong>g>of</str<strong>on</strong>g> ecological status as<br />
a number (Bad=2, Low=4, Moderate=6,<br />
Good=8 and High=10).<br />
RESULTS<br />
In total 60 taxa were identified (12<br />
Chlorophyceae, 16 Phaeophyceae and 32<br />
Rhodophyceae). At all <str<strong>on</strong>g>the</str<strong>on</strong>g> studied stati<strong>on</strong>s<br />
<str<strong>on</strong>g>the</str<strong>on</strong>g> Rhodophyceae were qualitatively<br />
Fig. 2: Matrix for <str<strong>on</strong>g>the</str<strong>on</strong>g> evaluati<strong>on</strong> <str<strong>on</strong>g>of</str<strong>on</strong>g> <str<strong>on</strong>g>the</str<strong>on</strong>g> ESC<br />
dominant and <str<strong>on</strong>g>the</str<strong>on</strong>g> Phaeophyceae were<br />
quantitatively dominant (Table 1).<br />
The canopy layer <str<strong>on</strong>g>of</str<strong>on</strong>g> <str<strong>on</strong>g>the</str<strong>on</strong>g> vegetati<strong>on</strong> was well developed at Stati<strong>on</strong>s 1, 4, 5 and 6, mainly<br />
due to <str<strong>on</strong>g>the</str<strong>on</strong>g> presence <str<strong>on</strong>g>of</str<strong>on</strong>g> Cystoseira species. O<str<strong>on</strong>g>the</str<strong>on</strong>g>r species, e.g. Dictyopteris<br />
membranacea, formed a pseudo-canopy layer when <str<strong>on</strong>g>the</str<strong>on</strong>g>y were massively present. A<br />
well-developed bushy layer, composed mainly by Jania rubens, Laurencia optusa,