

1957 - United Nations Statistics Division
1957 - United Nations Statistics Division
1957 - United Nations Statistics Division

You also want an ePaper? Increase the reach of your titles
YUMPU automatically turns print PDFs into web optimized ePapers that Google loves.
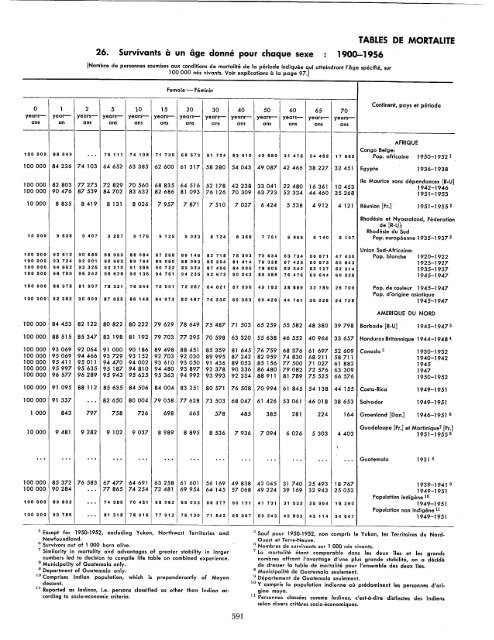
26. Survivants a un age donne pour chaque sexe<br />
TABLES DE MORTALITE<br />
1900-1956<br />
[Nombre de personnes soumises aux conditions de mortalite de la periode indiquee qui atteindront l'Eige specifie, sur<br />
100 000 nes vivants. Voir explications a la page 97.]<br />
Female - ,Feminin<br />
0 1 2 5 1-0 15 20 30 40 50 60 65 70<br />
years- year- years- years- years- years- years- years- years- years- years- years- yearsans<br />
an ans ans ans ans ans ans ans ans ans ans ans<br />
------------------------<br />
Continent, pays et periode<br />
AFRIQUE<br />
Congo Beige:<br />
100 000 88 549 ... 78 111 74 108 71 735 58 573 61 724 53 910 43 880 31 475 24 452 17 865 Pop. africaine 1950-1952 1<br />
100000 84236 74103 64652 63385 62600 61 317 58280 54043 49087 42466 38227 32451 Egypte 1936-1938<br />
lie Maurice sans dependances [R.U]<br />
100000 82803 77273 72 829 70560 68835 64516 52178 42238 33041 22 480 16361 10453 1942-1946<br />
100000 90476 87539 84702 83632 82686 81 093 76126 70309 63723 52334 44460 35268 1951-1953<br />
10000 8835 8419 8131 8026 7957 7871 7510 7027 6424 5538 4912 4121 Reunion [Fr.] 1951-1955 2<br />
Rhodesie et Nyassaland, Federation<br />
de [R-U]:<br />
Rhodesie du Sud<br />
10 000 9 538 9 407 9 257 9 176 9 125 9 033 8 724 8 358 7 751 5 895 6 140 5 107 Pop. europeenne 1935-1937 2<br />
Union Sud.Africaine:<br />
100 000 92 612 90 689 88 999 88 084 87 268 86 146 82 718 78 303 72 634 63 734 56 871 47 430 Pop. blanche 1920-1922<br />
100000 93 724 92 001 90 603 89 764 89 060 88 083 85 304 81 414 76 338 67 423 60 573 50 843 1925-1927<br />
100000 94 652 93 325 92 210 91 355 90 722 89 939 87 466 84 005 78 605 69 342 62 127 52 314 1935-1937<br />
100 000 96 709 96 242 95 528 95 136 94 761 94 235 92 672 90 243 85 485 76 476 69 644 60 325 1945-1947<br />
100 000 86 975 81 907 78 321 76 544 75 091 72 287 64 621 67 090 49 182 38 889 32 789 25 700 Pop. de couleur 1945-1947<br />
Pop. d'origine asiatique<br />
100 000 92 382 90 009 87 625 86 148 84 973 82 487 76 230 69 353 60 426 44 761 35 026 24 728 1945-1947<br />
AMERIQUE DU NORD<br />
100000 84453 82 122 80822 80222 79629 78649 75487 71 503 65259 55582 48380 39798 Barbade [R-U] 1945-19473<br />
100000 88515 85347 83 198 81 192 79703 77 295 70598 63320 55638 46552 40964 33657 Honduras Britannique 1944-1948 4<br />
100000 93069 92064 91 000 90186 89498 88451 85359 81 645 76759 68376 61 697 52609 Canada 5 1930-1932<br />
100000 95069 94466 93729 93152 92703 92030 89995 87242 82959 74830 68211 58711 1940-1942<br />
100000 95411 95011 94470 94002 93610 93050 91 436 89053 85156 77500 71027 61 882 1945<br />
100000 95997 95635 95187 94810 94480 93897 92378 90336 86480 79082 72 576 63309 1947<br />
100000 96577 96289 95943 95625 95363 94992 93993 92354 88911 81 789 75525 66576 1950-1952<br />
100000 91095 88112 85635 84506 84004 83251 80571 76508 70994 61 845 54138 44155 Costa-Rica 1949-1951<br />
100000 91 337 ... 82650 80004 79058 77 628 73503 68047 61426 53061 46018 38653 Salvador 1949-1951<br />
1000 843 797 758 726 698 665 578 485 385 281 224 164 Groenland [Dan.] 1946-1951 6<br />
Guadeloupe [Fr.] et Martinique 7 [Fr.]<br />
10000 9481 9282 9102 9037 8989 8895 8536 7936 7094 6026 5303 4403 1951-1955 2<br />
... ... ... .. . ... ... ... .. . ... ... . " .. . ... Guatemala 1921 8<br />
100000 85372 76583 67477 64691 63258 61 601 56169 49838 42045 31 740 25493 18767 1939-1941 9<br />
100000 90284 ... 77 865 74254 72 481 69954 64145 57068 49224 39169 32943 25052 1949-1951<br />
Population indigene 10<br />
100 000 89 892 ... 74 980 70 451 68 082 65 033 58 377 50 191 41 731 31 532 25 904 18 360 1949-1951<br />
Population non indigene 11<br />
100 000 90 785 ... 81 318 78 916 77 912 76 139 71 542 65 967 59 243 49 803 43 114 34 547 1949-1951<br />
5 Except for 1950-1952, excluding Yukon, Northwest Territories and<br />
Newfoundland.<br />
6 Survivors out of 1 000 born alive.<br />
7 Similarity in mortality and advantages of greater stability in larger<br />
numbers led to decision to compile life table on combined experience.<br />
S Municipality of Guatemala only.<br />
9 Department of Guatemala only.<br />
10 Comprises Indian population, which is preponderantly of Mayan<br />
descent.<br />
11 Reported as ladinos, i.e. persons classified as other than Indian according<br />
to socio·economic criteria.<br />
591<br />
\<br />
5 Sauf pour 1950-1952, non compris Ie Yukon, les Territoires du Nord<br />
Ouest et Terre-Neuve.<br />
6 Nombres de survivants sur 1 000 nes vivants.<br />
7 La mortalite etant comparable dans les deux i1es et les grands<br />
nombres offrant I'avantage d'une plus grande stabilite, on a decide<br />
de dresser la table de mortalite pour "ensemble des deux iles.<br />
S Municipalite de Guatemala seulement.<br />
9 Departement de Guatemala seulement.<br />
10 Y compris la population indienne ou predominent les personnes d'ori.<br />
gine maya.<br />
11 Persannes c1assees comme ladino., c'est-c.-dire distincles des Indiens<br />
selon divers criteres socio-economiques.


