

1957 - United Nations Statistics Division
1957 - United Nations Statistics Division
1957 - United Nations Statistics Division

You also want an ePaper? Increase the reach of your titles
YUMPU automatically turns print PDFs into web optimized ePapers that Google loves.
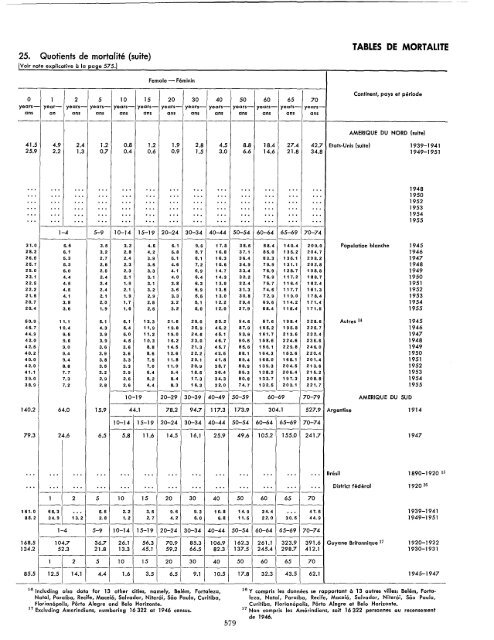
25. Quotients de mortalite (suite)<br />
[Voir note explicative a la page 575]<br />
Female - Feminin<br />
0 1 2 5 10 15 20 30 40 50 60 65 70<br />
years- year- years- years- years- years- years- years- years- years- years- years- yearsans<br />
an ans ans ans ans ans ans ans ans ans ans ans<br />
------------------------------------<br />
TABLES DE MORTALITE<br />
Continent, pays et periode<br />
AMERIQUE DU NORD (suite)<br />
41.5 4.9 2.4 1.2 0.8 1.2 1.9 2.8 4.5 8.8 18.4 27.4 42.7 Etats-Unis (suite) 1939-1941<br />
25.9 2.2 1.3 0.7 0.4 0.6 0.9 1.5 3.0 6.6 14.6 21.8 34.8 1949-1951<br />
... .. . ... ... .. ,<br />
... .,. ... ... .. ,<br />
'" ., . " . '" ... ... ... ... 1948<br />
'" ... '" ... " . ... '" ... 1950<br />
'" .. . ... ... ... ... ... ... ... ... '" ., . ... 1952<br />
... .,. ... '" .. ,<br />
'" ., . . " '" '" " . ... ... 1953<br />
'" ... '" .. . ... . " ... '" .. . '" . " ... " . 1954<br />
" . .. . ... . " ... '" ... .. . .. . ... ... ... " . 1955<br />
------------------------------------<br />
1-4 5-9 10-14 15-19 20-24 30-34 40-44 50-54 60-64 65-69 70-74<br />
------------------------<br />
31.0 6.5 3.5 3.2 4.5 6.1 9.6 17.8 38.5 88.4 140.4 209.0 Population blanche 1945<br />
28.2 6.1 3.2 2.8 4.2 5.8 8.7 16.8 37.1 85.0 135.2 204.7 1946<br />
26.6 5.3 2.7 2.4 3.9 5.1 8.1 16.3 36.4 83.3 135.1 208.2 1947<br />
25.7 5.3 2.6 2.3 3.6 4.6 7.2 15.6 34.9 79.9 131.1 202.8 1948<br />
25.0 5.0 2.5 2.3 3.3 4.1 6.9 14.7 33.4 76.9 128.7 198.8 1949<br />
23.1 4.4 2.4 2.1 3.1 4.0 6.4 14.3 32.2 76.9 117.2 188.7 1950<br />
22.5 4.5 2.4 1.9 3.1 3.8 6.3 13.9 32.4 75.7 116.4 182.4 1951<br />
22.2 4.5 2.4 2.1 3.2 3.6 5.9 13.5 31.3 74.6 117.7 181.3 1952<br />
21.5 4.1 2.1 1.9 2.9 3.3 5.5 13.0 30.8 72.9 119.0 178.4 1953<br />
20.7 3.8 2.0 1.7 2.5 3.2 5.1 12.2 29.4 69.6 114.2 171.4 1954<br />
20.4 3.6 1.9 1.6 2.6 3.2 5.0 12.0 27.9 68.4 115.4 171.5 1955<br />
50.9 11.1 5.1 6.1 13.3 21.6 29.0 50.2 94.6 57.6 198.4 228.6 Autres 14 1945<br />
45.7 10.4 4.3 5.4 11.9 19.8 25.9 46.2 87.9 155.2 195.8 225.7 1946<br />
44.9 9.5 3.9 5.0 11.2 19.0 24.6 45.1 93.6 161.7 213.6 232.4 1947<br />
42.0 9.6 3.9 4.5 10.3 16.2 23.0 46.7 90.5 158.6 224.6 236.6 1948<br />
42.5 9.0 3.6 3.6 8.8 14.5 21.3 46.7 85.5 156.1 229.8 246.0 1949<br />
40.2 9.4 3.9 3.6 8.6 12.6 22.2 43.5 88.1 164.3 153.6 220.4 1950<br />
40.0 9.4 3.8 3.3 7.5 11.8 20.1 41.8 89.4 165.0 165.1 201.4 1951<br />
42.0 8.8 3.5 3.3 7.0 11.0 20.9 38.7 88.9 139.3 204.5 213.6 1952<br />
41.1 7.7 3.2 2.9 6.4 9.4 18.5 35.4 85.3 138.2 205.4 215.2 1953<br />
39.0 7.3 2.9 2.6 5.2 8.4 17.3 34.3 80.8 133.7 197.3 208.8 1954<br />
38.9 7.2 2.8 2.6 4.4 8.3 16.3 32.0 74.7 132.5 203.1 221.7 1955<br />
---------------------------<br />
10-19 20-29 30-39 40-49 50-59 60-69 70-79 AMERIQUE DU SUD<br />
------<br />
140.2 64.0 15.9 44.1 78.2 94.7 117.3 173.9 304.1 527.9 Argentine 1914<br />
---------------------------<br />
10-14 15-19 20-24 30-34 40-44 50-54 60-64 65-69 70-74<br />
---------------------------<br />
79.3 24.6 6.5 5.8 11.6 14.5 16.1 25.9 49.6 105.2 155.0 241.7 1947<br />
'" .. , ... '" '" '" ... '" '" . " ... .. . ... Bresil 1890-1920 15<br />
... .. . ... '" ... " . .., ... '" . " ... ... ... District fed eral 1920 16<br />
------------------------------------<br />
1 2 5 10 15 20 30 40 50 60 65 70<br />
------------------------------------<br />
151.0 65.3 ... 5.5 2.2 3.5 9.6 9.3 10.8 14.9 24.4 .. , 47.5 1939-1941<br />
88.2 34.9 13.2 2.8 1.2 2.7 4.2 5.0 5.8 11.5 22.0 30.5 44.9 1949-1951<br />
------------------------------------<br />
1-4 5-9 10-14 15-19 20-24 30-34 40-44 50-54 60-64 65-69 70-74<br />
---------------------------<br />
168.5 104.7 36.7 26.1 56.3 70.9 85.3 106.9 162.3 261.1 323.9 391.6 Guyane Britannique 17 1920-1922<br />
134.2 52.3 21.8 13.3 45.1 59.2 66.5 82.3 137.5 245.4 298.7 412.1 1930-1931<br />
------------------------------------<br />
1 2 5 10 15 20 30 40 50 60 65 70<br />
------------------------------------<br />
B5.5 12.5 14.1 4.4 1.6 3.5 6.5 9.1 10.5 17.B 32.3 43.5 62.1 1945-1947<br />
16 Including also data for 13 other cities, namely, Belem, Fortaleza,<br />
Natal, Paraiba, Recife, Macei6, Salvador, Niter6i, Sao Paulo, Curitiba,<br />
Florian6polis, Porto Alegre and Bela Horizonte.<br />
17 Excluding Amerindians, numbering 16322 at 1946 census.<br />
579<br />
16 Y compris les donnees se rapportant a 13 autres villes: Belem, Fortaleze,<br />
NatalI' Paraibo, Recife, Maceio, Salvador, Niter6i, Sao Paulo,<br />
Curitiba, Florianapolis, Porto Alegre et Bela Horizonte.<br />
17 Non compris les Amerindiens, soit 16322 personnes au recensement<br />
de 1946.


