

1957 - United Nations Statistics Division
1957 - United Nations Statistics Division
1957 - United Nations Statistics Division

Create successful ePaper yourself
Turn your PDF publications into a flip-book with our unique Google optimized e-Paper software.
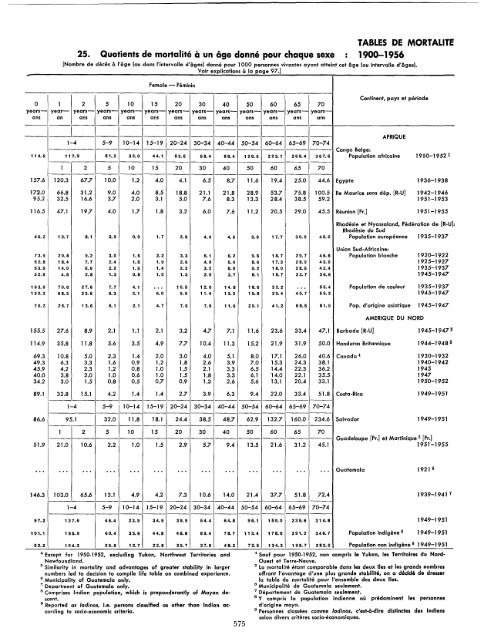
TABLES DE MORTALITE<br />
25. Quotients de mortalite a un age donne pour chaque sexe 1900-1956<br />
[Nombre de deces a I'oge (ou dans I'intervalle d'oges) donne pour 1000 personnes vivantes ayant atteint cet oge (ou intervalle d'ogesl.<br />
Voir explications a la page 97 J<br />
Female - Feminin<br />
0 1 2 5 10 15 20 30 40 50 60 65 70<br />
years- year- years- years- years- years- years- years- years- years- years- years- yearsans<br />
an ans ans ans ans ans ans ans ans ans ans ans<br />
------------------------------------<br />
Continent, pays et periode<br />
--------------------------------------- AFRIQUE<br />
1-4 5-9 10-14 15-19 20-24 30-34 40-44 50-54 60-64 65-69 70-74<br />
--------------------------- Congo Beige:<br />
114.5 117.9 51.2 32.0 44.1 53.6 68.4 86.4 126.9 223.1 269.4 367.5 Population africaine 1950-1952 1<br />
------------------------------------<br />
1 2 5 10 15 20 30 40 50 60 65 70<br />
------------------------------------<br />
157.6 120.3 67.7 10.0 1.2 4.0 4.1 6.5 8.7 11.6 19.4 25.0 44.6 Egypte 1936-1938<br />
172.0 66.8 31.2 9.0 4.0 8.5 18.8 21.1 21.8 28.9 53.7 75.8 100.5 lie Maurice sans dep. [R-U] 1942-1946<br />
95.2 32.5 16.6 3.7 2.0 3.1 5.0 7.6 8.3 13.3 28.4 38.5 59.2 1951-1953<br />
116.5 47.1 19.7 4.0 1.7 1.8 3.2 6.0 7.6 11.2 20.5 29.0 45.5 Reunion [Fr.] 1951-1955<br />
Rhodesie et Nyassaland, Federation de [R-U]:<br />
Rhodesie du Sud<br />
46.2 13.7 8.1 2.9 0.9 1.7 2.5 4.4 4.9 9.9 17.7 30.9 46.0 Population europeenne 1935-1937<br />
Union Sud-Africaine:<br />
73.9 20.8 9.2 3.0 1.6 2.2 3.3 5.1 6.2 9.5 18.7 29.7 45.6 Population blanche 1920-1922<br />
62.8 18.4 7.7 2.4 1.5 1.9 2.6 4.0 5.4 8.6 17.3 28.9 43.0 1925-1927<br />
53.5 14.0 5.6 2.2 1.5 1.4 2.3 3.2 5.0 9.2 18.0 28.5 42.4 1935-1937<br />
32.9 4.8 2.8 1.3 0.8 1.0 1.3 2.0 3.7 8.1 15.7 23.7 36.6 1945-1947<br />
163.0 70.5 27.6 7.7 4.1 ... 10.5 12.0 14.8 18.6 32.2 ... 55.4 Population de couleur 1935-1937<br />
130.3 58.3 23.6 6.3 3.1 6.0 9.9 11.4 13.3 19.8 29.4 40.7 59.2 1945-1947<br />
76.2 25.7 13.6 5.1 2.1 4.7 7.6 7.5 11.6 20.1 41.2 58.5 81.9 Pop. d'origine asiatique 1945-1947<br />
AMERIQUE DU NORD<br />
155.5 27.6 8.9 2.1 1.1 2.1 3.2 4.7 7.1 11.6 23.6 33.4 47.1 Barbade [R-U] 1945-1947 2<br />
114.9 35.8 11.8 5.6 3.5 4.9 7.7 10.4 11.3 15.2 21.9 31.9 50.0 Honduras Britannique 1944-1948 3<br />
69.3 10.8 5.0 2.3 1.4 2.0 3.0 4.0 5.1 8.0 17.1 26.0 40.6 Canada 4 1930-1932<br />
49.3 6.3 3.3 1.6 0.9 1.2 1.8 2.6 3.9 7.0 15.3 24.3 38.1 1940-1942<br />
45.9 4.2 2.3 1.2 0.8 1.0 1.5 2.1 3.3 6.5 14.4 22.3 36.2 1945<br />
40.0 3.8 2.0 1.0 0.6 1.0 1.5 1.8 3.3 6.1 14.0 22.1 35.5 1947<br />
34.2 3.0 1.5 0.8 0.5 0.7 0.9 1.3 2.6 5.6 13.1 20.4 33.1 1950-1952<br />
89.1 32.8 15.1 4.2 1.4 1.4 2.7 3.9 6.3 9.4 22.0 33.4 51.8 Costa-Rica 1949-1951<br />
------------------------------------<br />
1-4 5-9 10-14 15-19 20-24 30-34 40-44 50-54 60-64 65-69 70-74<br />
---------------------------<br />
86.6 95.1 32.0 11.8 18.1 24.4 38.5 48.7 62.9 132.7 160.0 234.6 ·Salvador 1949-1951<br />
------------------------------------<br />
1 2 5 10 15 20 30 40 50 60 65 70<br />
------------------------------------ Guadeloupe [Fr.] et Martinique 5 [Fr.]<br />
51.9 21.0 10.6 2.2 1.0 1.5 2.9 5.7 9.4 13.5 21.6 31.2 45.1 1951-1955<br />
... ... ... ... ... ... '" ... ... ... ... ... ... Guatemala 1921 6<br />
146.3 103.0 65.6 13.1 4.9 4.2 7.3 10.6 14.0 21.4 37.7 51.8 72.4 1939-1941 7<br />
------------------------------------<br />
1-4 5-9 10-14 15-19 20-24 30-34 40-44 50-54 60-64 65-69 70-74<br />
---------------------------<br />
97.2 137.5 46.4 23.9 34.9 39.9 54.4 64.8 95.1 159.0 239.6 314.8 1949-1951<br />
101.1 155.9 60.4 33.6 44.8 48.8 69.4 78.7 113.4 178.5 291.2 346.7 Population indigene 8 1949-1951<br />
92.2 104.3 29.5 12.7 22.8 29.7 37.6 48.2 72.5 134.3 198.7 283.0 Population non indigene 9 1949-1951<br />
4 Except for 1950-1952, excluding Yukon, Northwest Territories and<br />
Newfoundland.<br />
5 Similarity in mortality and advantages of greater stability in larger<br />
numbers led to decision to compile life table on combined experience.<br />
6 Municipality of Guatemala only.<br />
7 Department of Guatemala only.<br />
8 Comprises Indian population, which is preponderantly of Mayan descent.<br />
9 Reported as ladinos, i.e. persons classified as other than Indian according<br />
to socio-economic criteria.<br />
575<br />
4 Sauf pour 1950-1952, non compris Ie Yukon, les Territoires du Nord<br />
Ouest et Terre-Neuve.<br />
5 La mortalite etant comparable dans les deux iles et les grands nombres<br />
offrant j'avantage d'une plus grande stabilite, on a decide de dresser<br />
la table de mortalite pour I'ensemble des deux iles.<br />
6 Municipalite de Guatemala seulement.<br />
7 Departement de Guatemala seulement.<br />
8 Y compris la population indienne ou predominent les personnes<br />
d'origine maya.<br />
9 Personnes classees comme ladinos, c'est-a-dire distinctes des Indiens<br />
selon divers criteres socio-economiques.


