

1957 - United Nations Statistics Division
1957 - United Nations Statistics Division
1957 - United Nations Statistics Division

Create successful ePaper yourself
Turn your PDF publications into a flip-book with our unique Google optimized e-Paper software.
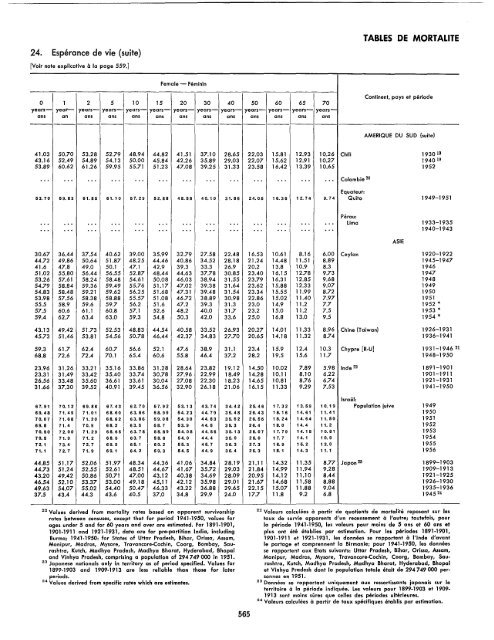
24. Esperance de vie (suite)<br />
[Voir note explicative a la page 559.]<br />
Female - Feminin<br />
0 1 2 5 10 15 20 30 40 50 60 65 70<br />
years- year--- years- years- years- years- years- years- years- years- years- years- yearsans<br />
an ans ans ans ans ans ans ans ans ans ans ans<br />
------------------------------------<br />
TABLES DE MORTALITE<br />
Continent, pays et periode<br />
AMERIQUE DU SUD {suite}<br />
41.03 50.70 53.28 52.79 48.94 44.82 41.51 37.10 28.65 22.03 15.81 12.93 10.26 Chili 1930 19<br />
43.16 52.49 54.89 54.13 50.00 45.84 42.26 35.89 29.03 22.07 15.62 12.91 10.27 1940 19<br />
53.89 60.62 61.26 59.95 55.71 51.23 47.08 39.25 31.33 23.58 16.42 13.39 10.65 1952<br />
.. , ., . ... ... ... ... ... .. . .. . ... ... ... ... Colombie 20<br />
Equateur:<br />
53.70 59.83 61.85 61.10 57.29 52.88 48.58 40.10 31.86 24.05 16.36 12.74 9.74 Quito 1949-1951<br />
Perou:<br />
.. . ... ... ... ... ... ... ... .. . ... ... ... ... Lima 1933-1935<br />
.. . ... .. . ... ... ... ... .. . ... ... ... ... ., . 1940-1943<br />
30.67 36.44 37.54 40.62 39.00 35.99 32.79 27.58 22.48 16.53 10.61 8.16 6.00 Ceylan 1920-1922<br />
44.72 49.86 50.64 51.87 48.25 44.46 40.86 34.52 28.18 21.24 14.48 11.51 8.89 1945-1947<br />
41.6 47.8 49.0 50.1 47.1 42.9 39.3 33.3 26.9 20.2 13.8 10.9 8.3 1946<br />
51.02 55.80 56.44 56.55 52.87 48.44 44.63 37.78 30.85 23.40 16.15 12.78 9.73 1947<br />
53.26 57.61 58.24 58.48 54.61 50.08 46.03 38.94 31.55 23.79 16.31 12.85 9.68 1948<br />
54.79 58.84 59.36 59.49 55.76 51.17 47.02 39.38 31.64 23.62 15.88 12.33 9.07 1949<br />
54.83 58.48 59.21 59.62 56.25 51.68 47.31 39.48 31.54 23.34 15.55 11.99 8.72 1950<br />
53.98 57.56 58.38 58.88 55.57 51.08 46.72 38.89 30.98 22.86 15.02 11.40 7.97 1951<br />
55.5 58.9 59.6 59.7 56.2 51.6 47.2 39.3 31.3 23.0 14.9 11.2 7.7 1952 *<br />
57.5 60.6 61.1 60.8 57.1 52.6 48.2 40.0 31.7 23.2 15.0 11.2 7.5 1953 *<br />
59.4 62.7 63.4 63.0 59.3 54.8 50.3 42.0 33.6 25.0 16.8 13.0 9.5 1954 *<br />
43.13 49.42 51.73 52.53 48.83 44.54 40.58 33.52 26.93 20.27 14.01 11.33 8.96 Chine {Taiwan} 1926-1931<br />
45.73 51.46 53.81 54.56 50.78 46.44 42.37 34.83 27.70 20.65 14.18 11.32 8.74 1936-1941<br />
59.3 61.7 62.4 60.7 56.6 52.1 47.6 38.9 31.1 23.4 15.9 12.4 10.3 Chypre [R-U] 1931-1946 21<br />
68.8 72.6 72.4 70.1 65.4 60.6 55.8 46.4 37.2 28.2 19.5 15.6 11.7 1948-1950<br />
23.96 31.26 33.21 35.16 33.86 31.28 28.64 23.82 19.12 14.50 10.02 7.89 5.98 Inde 22 1891-1901<br />
23.31 31.49 33.42 35.40 33.74 30.78 27.96 22.99 18.49 14.28 10.11 8.10 6.22 1901-1911<br />
26.56 33.48 35.60 36.61 33.61 30.04 27.08 22.30 18.23 14.65 10.81 8.76 6.74 1921-1931<br />
31.66 37.30 39.52 40.91 39.45 36.56 32.90 26.18 21.06 16.15 11.33 9.29 7.53 1941-1950<br />
Israel:<br />
67.91 70.12 69.86 67.43 62.70 57.92 53.13 43.74 34.42 25.46 17.32 13.69 10.19 Population juive 1949<br />
69.48 71.49 71.01 68.60 63.86 58.99 54.23 44.79 35.48 26.43 18.16 14.61 11.41 1950<br />
70.07 71.68 71.20 68.62 63.86 59.08 54.30 44.83 35.62 26.66 18.24 14.64 11.50 1951<br />
69.8 71.4 70.9 68.2 63.5 58.7 53.9 44.5 35.3 26.4 18.0 14.4 11.2 1952<br />
70.50 72.00 71.29 68.65 63.78 58.89 54.08 44.56 35.13 26.07 17.79 14.15 10.81 1953<br />
70.5 71.9 71.2 68.5 63.7 58.8 54.0 44.4 35.0 26.0 17.7 14.1 10.9 1954<br />
72.1 73.4 72.7 69.9 65.1 60.2 65.3 45.7 36.3 27.3 18.9 15.2 12.0 1955<br />
71.1 72.7 71.9 69.1 64.2 59.3 64.5 44.9 35.4 26.3 18.1 14.3 11.1 1956<br />
44.85 51.17 52.06 51.97 48.34 44.36 41.06 34.84 28.19 21.11 14.32 11.35 8.77 Japan 23 1899-1903<br />
44.73 51.24 52.55 52.61 48.51 44.67 41.67 35.72 29.03 21.84 14.99 11.94 9.28 1909-1913<br />
43.20 49.42 50.86 50.71 47.00 43.12 40.38 34.69 28.09 20.95 14.12 11.10 8.44 1921-1925<br />
46.54 52.10 53.37 53.00 49.18 45.11 42.12 35.98 29.01 21.67 14.68 11.58 8.88 1926-1930<br />
49.63 54.07 55.02 54.40 50.47 46.33 43.22 36.88 29.65 22.15 15.07 11.88 9.04 1935-1936<br />
37.5 43.4 44.3 43.6 40.5 37.0 34.8 29.9 24.0 17.7 11.8 9.2 6.8 1945 24<br />
22 Values derived fram mortality rates based on apparent survivorship<br />
rotes between censuses, except that for period 1941-1950, values for<br />
ages under 5 and for 60 years and over are estimated. For 1891-1901,<br />
1901.1911 and 1921-1931, data are far pre-partition India, including<br />
Burma; 1941-1950: for States of Uttar Pradesh, Bihar, Orissa, Assam,<br />
Manipur, Madras, Mysore, Travancore-Cochin, Coorg, Bombay, Saurashtra,<br />
Kutch, Madhya Pradesh, Madhya Bharat, Hyderabad, Bhopal<br />
and Vinhya Pradesh, comprising a population of 294749 000 in 1951.<br />
23 Japanese nationals only in territory as of period specified. Values far<br />
1899-1903 and 1909-1913 are less reliable than those for later<br />
pe"iods.<br />
24 Values derived from specific rates which are estimates.<br />
565<br />
ASIE<br />
22 Valeurs calculees a partir de quotients de mortalite reposant sur les<br />
faux de survie apparents d/un recensement a I'autre; toutefois, pour<br />
la periode 1941.1950, les valeurs pour moins de 5 ans et 60 ans et<br />
plus ant ete etablies par estimation. Pour les periodes 1891-1901,<br />
1901-1911 et 1921-1931, les donnees se rapportent a l'lnde d'avont<br />
Ie partage et comprennent la Birmanie; pour 1941-1950, les donnees<br />
se rapportent aux 'Etats suivants: Uttar Pradesh, Bihar, Orissa, Assam,<br />
Manipur, Madras, Mysore, Travancore-Cochin, Coorg, Bombay, Saurashtra,<br />
Kutch, Madhya Pradesh, Madhya Bharat, Hyderabad, Bhopal<br />
et Vinhya Pradesh dont la population totale etaH de 294749000 personnes<br />
en 1951.<br />
23 Donnees se rapportant uniquement aux ressortissants iaponais sur Ie<br />
territoire a la periode indiquee. Les valeurs pour 1899.1903 et 1909·<br />
1913 sont moins sures que celles des periodes ulterieures.<br />
24 Valeurs calculees a partir de taux specifiques etablis par estimation.


