

1957 - United Nations Statistics Division
1957 - United Nations Statistics Division
1957 - United Nations Statistics Division

Create successful ePaper yourself
Turn your PDF publications into a flip-book with our unique Google optimized e-Paper software.
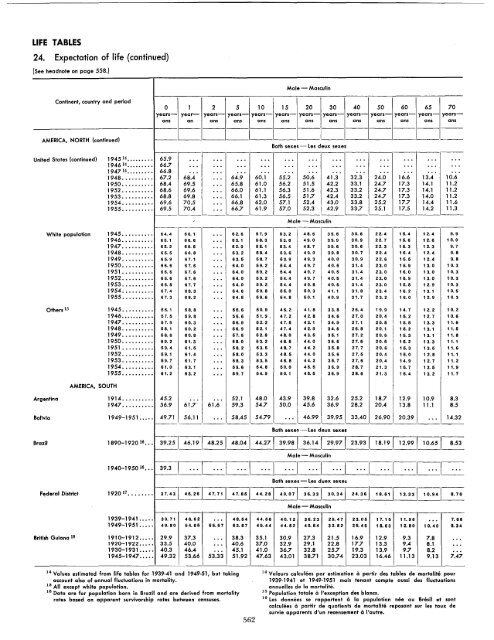
LIFE TABLES<br />
24. Expectation of life (continued)<br />
[See headnote on page 558.]<br />
Continent, country and period<br />
AMERICA, NORTH (continued)<br />
Male - Masculin<br />
0 1 2 5 10 15 20 30 40 50 60 65 70<br />
years- year- years- years- years- years- years- years- years- years- years- years- yeorsans<br />
an ans ans ans ans ans ans ans ans ans ans ans<br />
------------------------------------<br />
---------------------------------------<br />
Both sexes-les deux sexes<br />
---------------------------------------<br />
<strong>United</strong> States (continued) 1945 14 ••••••••• 65.9 .. . ... .. . .. . ... ... .. . ... ... ... .. . ...<br />
1946 14 ••••••••• 66.7 ... ... ... .. . ... ... ... ... ... .. . .. . ...<br />
1947 14 ......... 66.8 ... .. . ... ... .. . ... ... .. . ... .. . ... ...<br />
1948•.•••••••• 67.2 68.4 ... 64.9 60.1 55.2 50.6 41.3 32.3 24.0 16.6 13.4 10.6<br />
1950•••••.•.•. 68.4 69.5 ... 65.8 61.0 56.2 51.5 42.2 33.1 24.7 17.3 14.1 11.2<br />
1952 ..•••••••• 68.6 69.6 ... 66.0 61.1 56.3 51.6 42.3 33.2 24.7 17.3 14.1 11.2<br />
1953..•••••••. 68.8 69.8 ... 66.1 61.3 56.5 51.7 42.4 33.2 24.7 17.3 14.0 11.2<br />
1954•.••.••••• 69.6 70.5 ·.. 66.8 62.0 57.1 52.4 43.0 33.8 25.2 17.7 14.4 11.6<br />
1955••••.••••. 69.5 70.4 ·.. 66.7 61.9 57.0 52.3 42.9 33.7 25.1 17.5 14.2 11.3<br />
---------------------------------------<br />
, Male - Masculin<br />
---------------------------------------<br />
White population 1945..•••••••. 64.4 66.1 ... 62.6 57.9 53.2 48.6 39.5 30.6 22.4 15.4 12.4 9.9<br />
1946•••.•••••. 65.1 66.6 ... 63.1 58.3 53.6 49.0 39.9 30.9 22.7 15.6 12.6 10.0<br />
1947•.•••••••. 65.2 66.5 ... 62.9 58.1 63.4 48.7 39.6 30.6 22.3 15.3 12.3 9.7<br />
1948••.•..•••• 65.6 66.8 ... 63.2 58.4 53.6 49.0 39.8 30.7 22.4 16.4 12.4 9.8<br />
1949•.••.••••• 65.9 67.1 ... 63.6 68.7 63.9 49.3 40.0 30.9 22.6 16.6 12.4 9.8<br />
1950.......... 66.6 67.6 ... 64.0 59.2 64.4 49.7 40.5 31.4 23.0 16.9 13.0 10.3<br />
1951 .......... 66.6 67.6 ... 64.0 59.2 64.4 49.7 40.6 31.4 23.0 16.0 13.0 10.3<br />
1952.••.••.••. 66.6 67.6 ... 64.0 69.2 64.4 49.7 40.6 31.4 23.0 16.9 13.0 10.3<br />
1953..••••.... 66.8 67.7 ... 64.0 59.2 64.4 49.8 40.6 31.4 23.0 16.8 12.9 10.3<br />
1954.......... 67.4 68.3 ... 64.6 69.8 66.0 50.3 41.1 31.8 23.4 16.2 13.1 10.5<br />
1955 •••.••••.• 67.3 68.2 ... 64.5 69.6 54.8 60.1 40.9 31.7 23.2 16.0 12.9 10.3<br />
Others 15 1945.•.•••..•. 66.1 68.8 ... 66.6 60.9 46.2 41.8 33.8 26.4 19.9 14.7 12.2 10.2<br />
1946........... 57.5 69.8 ... 56.6 61.9, 47.2 42.8 34.6 27.0 20.4 16.2 12.7 10.6<br />
1947..•.•.••.. 67.9 60.3 ·.. 66.9 62.2 47.6 43.1 34.9 27.1 20.6 16.6 13.3 11.6<br />
1948.••.•....• 68.1 60.2 ·.. 66.9 62.1 47.4 42.9 34.6 26.8 20.1 16.2 13.1 11.6<br />
AMERICA, SOUTH<br />
1949..••••..•• 68.6 60.8 ... 67.6 62.8 48.0 43.6 36.1 27.2 20.6 16.3 13.1 11.8<br />
1950•.••.••.•• 69.2 61.3<br />
'"<br />
68.0 53.2 48.6 44.0 36.6 27.6 20.5 16.2 13.3 11.1<br />
1951 ••.••••••. 69.4 61.6 ... 68.2 63.6 48.7 44.2 36.8 27.7 20.6 16.3 13.6 11.6<br />
1952..•••••.•. 69.1 61.4 ... 68.0 63.3 48.5 44.0 35.6 27.6 20.4 16.0 12.8 11.1<br />
1953•••••.•.•• 69.7 61.7 ... 58.3 63.6 48.8 44.2 36.7 27.6 20.4 14.9 12.7 11.2<br />
1954•••••••.•. 61.0 63.1 ·.. 69.6 64.8 50.0 46.6 36.9 28.7 21.3 16.7 13.5 11.9<br />
1955•••.•••••• 61.2 63.2 ... 69.7 54.9 60.1 45.5 36.9 28.6 21.3 16.4 13.2 11.7<br />
Argentina 1914.•••••••.• 45.2 .. . ... 52.1 48.0 43.9 39.8 32.6 25.2 18.7 12.9 10.9 8.3<br />
1947••.•.•.••• 56.9 61.7' 61.6 59.3 54.7 50.0 45.6 36.9 28.2 20.4 13.8 11.1 8.5<br />
Bolivia 1949-1951 ..... 49.71 56.11 .. . 58.45 54.79 ... 46.99 39.95 33.40 26.90 20.39 ... 14.32<br />
---------,------------------------------<br />
Both sexes - les deux sexes<br />
Brazil 1890-1920 16 ... 39.251 46.191 48.25' 48.041 44.271 39.981 36.141 29.97' 23.931 18.,9' 12.991 10.651 8.53<br />
Male - Masculin<br />
1940-1950 16 ••• 39.3 I ... I ... I ... I ... , ... I ... I ... I ... I ... I ... I ... I ...<br />
Both sexes-les duex sexes<br />
F,!deral District 1920 17 •••••••• 37. 43 1 46. 26 1 47.71 I 47. 86 1 44. 28 1 4 0. 07 1 36.331 3 o. 34 1 24. 36 1 1 8.61 I 1 3.331 10.941 8.76<br />
Male - Masculin<br />
---------------------------------------<br />
1939-1941 ..... 39.71 48.62 ... 48.64 44.66 40.12 36.23 29.47 23.06 17.16 11.96 ... 7.66<br />
1949-1951..... 49.80 64.66 66.67 63.87 49.44 44.82 40.64 32.82 26.45 18.63 12.80 10.40 8.34<br />
British Guiana 18 1910-1912..... 29.9 37.3 ... 38.3 35.1 30.9 27.3 21.5 16.9 12.9 9.3 7.8 ...<br />
1920-1922..... 33.5 40.0 ... 40.6 37.0 32.9 29.1 22.8 17.7 13.3 9.4 8.1 ...<br />
1930-1931 ..... 40.3 46.4 ... 45.1 41.0 36.7 32.8 25.7 19.3 13.9 9.7 8.2 ...<br />
1945-1947..... 49.32 53.66 53.33 51.92 47.63 43.01 38.71 30.74 23.03 16.46 11.13 9.13 7.47<br />
14 Values estimated from life tables for 1939-41 and 1949-51, but taking<br />
account also of annual fluctuations in mortal,ity.<br />
15 All except white population.<br />
16 Data are for population born in Brazil and are derived from mortality<br />
rates based on apparent survivorship rates between censuses.<br />
S62<br />
14 Valeurs calculees par estimation a partir des tables de mortalite pour<br />
1939-1941 el 1949-1951 mais tenant comple aussi des fluctuations<br />
annuelles de 10 morlalile.<br />
15 Population totoIe a I'exception des blancs.<br />
16 les donnees se rapportent a 10 populalion nee au Bresil et sont<br />
calculees a partir de quotients de martalite reposant sur les taux de<br />
survie apparents diu" recensement a ('autre.


