

1957 - United Nations Statistics Division
1957 - United Nations Statistics Division
1957 - United Nations Statistics Division

Create successful ePaper yourself
Turn your PDF publications into a flip-book with our unique Google optimized e-Paper software.
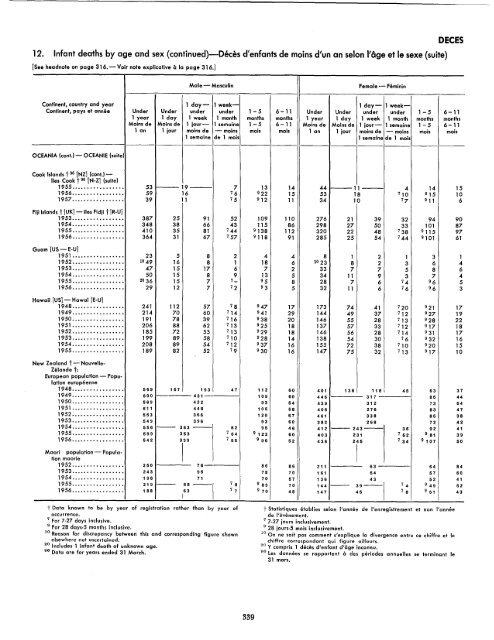
12. Infant deaths by age and sex (continued)-Deces d'enfants de mains dlun an selon Ilage et Ie sexe (suite)<br />
[See headnote on page 316. - Voir note explicative a 10 page 316.]<br />
Male - Masculin female - feminin<br />
DECES<br />
Continent, country and year 1 day- 1 week- I day- 1 week-<br />
Continent, pays et annee Under Under under under 1-5 6-11 Under Under under under 1-5 6-11<br />
1 year 1 day 1 week 1 month months months 1 year 1 day 1 week 1 month months months<br />
Mains de Mains de 1 jour- 1 semoine 1-5 6-11 Mains de Mains de 1 jour- 1 semaine 1-5 6-11<br />
1 an 1 jour mains de - moins mois mois 1 an 1 jour mains de - moins mois mois<br />
1 semaine de 1 mois 1 semaine de 1 mois<br />
OCEANIA (cant.) - OCEANIE (suite)<br />
Cook Islands t 96 [NZ] (con!.)lies<br />
Cook t 96 [N-Z] (suite)<br />
1955•••.•••••••••.•.• 53 ---19--- 7 13 14 441-11--- 4 14 15<br />
1956•.••••••••••••••• 59 16 76 922 15 53 18 710 915 10<br />
<strong>1957</strong>•.••••••••••••••• 39 11 75 912 11 34 10 77 911 6<br />
fiji Islands t [UK] -lies Fidji t [R-U]<br />
1953................. 387 25 91 52 109 110 276 21 39 32 94 90<br />
1954................. 348 38 66 43 115 86 298 27 50 33 101 87<br />
1955................. 410 35 81 744 9138 112 320 22 48 738 9115 97<br />
1956................. 364 31 67 757 9118 91 285 25 54 744 9101 61<br />
Guam [US - E-U]<br />
1951 ................. 23 5 8 2 4 4 8 1 2 1 3 1<br />
1952................. 10 49 16 8 1 18 6 10 23 8 2 3 6 4<br />
1953................. 47 15 17 6 7 2 33 7 7 5 8 6<br />
1954................. 50 15 8 9 13 5 34 11 9 3 7 4<br />
1955................. 20 36 15 7 7_ 95 8 28 7 6 74 96 5<br />
1956................. 29 12 7 72 93 5 32 11 6 76 96 3<br />
Hawaii [US] - Hawa; [E-Uj<br />
1948.•••••••••••••••• 241 112 57 78 947 17 173 74 41 720 921 17<br />
1949..•••••••••••••.• 214 70 60 714 941 29 144 49 37 712 927 19<br />
1950................. 191 78 39 716 938 20 146 55 28 713 928 22<br />
1951 ................. 206 88 62 713 925 18 137 57 33 712 917 18<br />
1952................. 185 72 53 713 929 18 146 56 28 714 931 17<br />
1953.•.••.•.••.•.••.. 199 89 58 710 928 14 138 54 30 76 932 16<br />
1954................. 208 89 54 712 937 16 155 72 38 710 920 15<br />
1955................. 189 82 52 79 930 16 147 75 32 713 917 10<br />
New Zealand t - Nouvelle-<br />
Zelande t:<br />
European population - Population<br />
europeenne<br />
1948•••.•••••.•.•••.• 569 157 193 47 112 50 401 138 118 45 53 37<br />
1949.............. '" 500 431 109 50 446 317 85 44<br />
1950.....••.•••••..•. 569 422 93 64 439 312 73 54<br />
1951 ................. 611 448 105 58 406 276 83 47<br />
1952••.••..•••.•••••• 553 366 120 67 461 338 85 38<br />
1953................. 549 396 93 60 382 268 72 42<br />
1954..•.•••••••.••••• 556 --- 363 --- 52 95 46 412 --- 243--- 36 92 41<br />
1955................. 599 353 7 64 9 122 60 403 231 762 9 81 39<br />
1956.•.••.••••••••.•• 542 339 7 65 996 52 436 246 734 9 107 50<br />
I I<br />
Maori population - Population<br />
maorie<br />
1952.•..•••••••.•..•.<br />
1953.................<br />
1954...••.•.•.•••••.•<br />
1955.••.•...•••...••.<br />
250 78<br />
243 95<br />
198 71<br />
219 --- 58-I<br />
86<br />
78<br />
70<br />
86<br />
70<br />
57<br />
211 63<br />
161 54<br />
136 43<br />
64<br />
57<br />
52<br />
84<br />
50<br />
41<br />
7 8 9 83 70 144 --- 1956................. 188 63 7 7<br />
I<br />
9 70 48<br />
39-1<br />
147 45<br />
7 4<br />
7 8<br />
9 49<br />
9 51<br />
52<br />
43<br />
t Data known to be by year of registration rather than by year of<br />
occurrence.<br />
7 For 7-27 days inclusive.<br />
9 For 28 days.5 months inclusive.<br />
'0 Reason for discrepancy between this and corresponding figure shown<br />
elsewhere not ascertained.<br />
20 Includes 1 infant death of unknown age.<br />
96 Data are for years ended 31 March.<br />
339<br />
t Slalistiques etablles selon I'annee de I'enregistrement et non I'annee<br />
de I/evenement.<br />
77·27 jours inclusivement.<br />
9 28 jours-5 mois inclusivement.<br />
10 On ne sait pas comment s/explique 10 divergence entre ce chiffre et Ie<br />
chiffre correspondant qui figure ailleurs.<br />
20 Y compris 1 deces d'enfant d'oge inconnu.<br />
96 Les donnees se rapportent a des periodes annuelles se terminant Ie<br />
31 mars.


