

1957 - United Nations Statistics Division
1957 - United Nations Statistics Division
1957 - United Nations Statistics Division

Create successful ePaper yourself
Turn your PDF publications into a flip-book with our unique Google optimized e-Paper software.
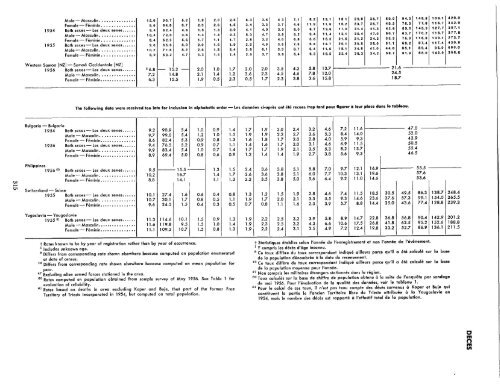
Male - Masculin ••••••••••••••. 12.0 90.7 5.2 1.8 2.0 2.5 6.3 3.6 4 3 7.1 8.2 19.1 18 1 29.8 36.7 69.9 94.3 145.8 109.1 420.0<br />
Female - Feminin •••••••••••••• 9.6 64.8 5.7 2.3 2.6 1.5 3.4 3.3 3.7 4.6 11.9 11.5 15.2 33.7 36.7 49.2 76.3 77.8 116.7 342.9<br />
1954 Bath sexes - Les deux sexes•••••• 9.4 62.4 4.6 1.5 1.3 2.0 4.1 4.0 3.9 8.0 6.7 13.6 17.0 31.4 41.3 42.6 69.0 145.9 127.7 307.1<br />
Male - Masculin ••••••••••••••. 10.4 72.0 3.6 1.3 1.4 2.3 5.3 4.7 3.8 9.2 9.4 11.4 13.1 39.4 47.0 50.7 63.7 17 O. 2 116.7 377.8<br />
Female - Feminin •••••••••••••• 8.4 52.3 5.6 1.7 1.1 1.7 2.8 3.2 4.0 6.8 3.6 16.3 21.6 21.2 34.2 33.3 75.0 115.8 139.1 273.7<br />
1955 Both sexes - Les deux sexes•••••• 9.6 65.6 5.0 2.0 1.6 1.9 3.2 4.9 3.5 7.5 6.4 14.7 20.1 30.8 38.0 61.1 68.2 87.4 117.4 430.8<br />
Male - Masculin .•••••••••••••• 10.2 77.6 5.2 2.6 1.8 2.4 3.6 6.1 3.3 8.7 6.4 11.6 18.1 24.8 41.0 44.6 65.1 89.4 96.0 600.0<br />
Female - Feminin •••••••••.•••. 8.9 63.2 4.7 1.3 1.4 1.4 2.9 3.7 3.6 6.4 6.3 18.5 22.4 38.3 34.2 68.7 61.9 86.0 142.9 365.6<br />
Western Samoa [NZ] - Samoa Occidentale [Nzl<br />
1956 Both sexes - Les deux sexes•••••• 86.8 - 15.2 - 2.0 1.0 1.7 2.0 2.0 3.5 4.2 5.8 13.7 21.6<br />
Male - Masculin ••••••••••••••• 7.2 14.8 2.1 1.4 1.2 3.6 2.3 4.5 4.6 7.8 12.0 24.5<br />
Female- Feminin ••••••••••••••• 6.3 15.5 1.9 0.5 2.3 0.5 1.7 2.3 3.8 3.6 15.8 18.7<br />
The following data were received too late for inclusion in alphabetic order - Les donnees ci-apres ant ete recues trap tard pour figurer a leur place dans Ie tableau.<br />
Bulgaria - Bulgarie<br />
1954 Both sexes - les deux sexes ••• , •• 9.2 90.9 5.4 1.0 0.9 1.4 1.7 1.9 2.0 2.4 3.2 4.6 7.2 11.6 47.0<br />
Male - Masculin ....•.•....••.. 9.7 99.0 5.4 1.2 1.0 1.5 1.9 1.9 2.2 2.7 3.6 5.3 8.4 14.0 52.0<br />
Female - Feminin •••••.••.•••••• 8.6 82.4 5.3 0.9 0.8 1.3 1.6 1.8 1.7 2.0 2.8 4.0 5.9 9.3 42.9<br />
1956 Both sexes - les deux sexes•••••• 9.4 76.5 5.2 0.9 0.7 1.1 1.4 1.6 1.7 2.0 3.1 4.6 6.9 11.5 50.5<br />
Male - Masculin •••••.••...•••• 9.9 83.4 5.4 1.0 0.7 1.4 1.7 1.7 1.9 2.1 3.5 5.3 8.2 13.7 55.4<br />
Female - Feminin ••••••.•.•.•••. 8.9 69.4 5.0 0.8 0.6 0.9 1.2 1.4 1.4 1.9 2.7 3.8 5.6 9.3 46.5<br />
Philippines<br />
1956 60 Both sexes - les deux sexes.••••. 9.5 ---15.5--- 1.3 1.5 2.4 3.6 3.8 5.1 5.8 7.0 9.7 12.1 16.9 55.5 -<br />
Male - Masculin ..••••••.•..••• 10.2 16.7 1.4 1.7 2.6 3.6 3.8 5.1 6.0 7.7 10.3 13.1 19.6 57.6<br />
Female - Feminin •••••.•.••••.•• 8.8 14.1 1.1 1.3 2.2 3.5 3.8 5.0 5.6 6.4 9.2 11.0 14.6 53.6<br />
Switzerland - Suisse<br />
1955 Both sexes - les deux sexes•••••• 10.1 27.4 1.6 0.6 0.4 0.8 1.3 1.2 1.5 1.9 2.8 4.6 7.4 11.5 18.5 30.5 49.5 86.3 138.7 248.4<br />
Male - Masculin ••••••••••••••• 10.7 30.1 1.7 0.8 0.5 1.1 1.9 1.7 2.0 2.1 3.3 5.5 9.3 14.6 23.6 37.6 57.3 99.1 154.0 265.5<br />
Female - Feminin............... 9.6 24.5 1.5 0.4 0.3 0.5 0.7 0.8 1.1 1.6 2.3 3.9 5.7 8.8 14.4 25.0 43.6 77.4 128.8 239.3<br />
Yugoslavia - Yougoslavie<br />
1955 61 Both sexes-les deux sexes•••.•• 11.3 114.6 10.1 1.5 0.9 1.3 1.9 2.2 2.5 3.2 3.9 5.8 8.9 14.7 22.8 36.8 56.8 90.4 142.9 201.2<br />
Male - Masculin •••••••••••••••• 11.6 119.8 9.5 1.5 1.0 1.4 1.9 2.3 2.5 3.2 4.3 6.6 10.6 17.5 26.8 41.8 62.5 95.2 152.6 188.8<br />
Female - Feminin••••••••••••••• 11.1 109.2 10.7 1.5 0.8 1.3 1.9 2.2 2.4 3.1 3.5 4.9 7.2 12.4 19.8 33.2 52.7 86.9 136.1 211.5<br />
t Rates known to be by year of registration rather than by year of occurrence.<br />
1 Includes unknown age.<br />
S Differs from corresponding rate shown elsewhere because computed on population enumerated<br />
at date of census.<br />
16 Differs from corresponding rate shawn elsewhere because computed on mean population for<br />
year.<br />
47 Excluding alien armed forces stationed in the area.<br />
60 Rates computed on population obtained from sample survey of May 1956. See Table 1 for<br />
evaluation of reliability.<br />
61 Rates based on deaths in area excluding Koper and Buie, that part of the former Free<br />
Territory of Trieste incorporated in 1954, but computed on total population.<br />
t Statistiques Mablies selon I'annee de I'enregistrement et non I'annee de I'evenement.<br />
1 Y compris les deces d'cge inconnu.<br />
S Ce taux differe du taux correspondant indique ailleurs parce qu'iI a ete calcule sur 10 base<br />
de 10 population denombree a 10 date du recensement.<br />
16 Ce taux differe du taux correspondant indique ailleurs parce qu'il a ete calcule sur 10 base<br />
de 10 population moyenne pour I'annee.<br />
47 Non compris les militaires etrangers stationnes dans 10 region.<br />
60 Taux calcules sur 10 base de chiffre de population obtenu a 10 suite de I'enquete par sandage<br />
de mai 1956. Pour I'evaluation de 10 qualite des donnees, voir Ie tableau l.<br />
61 Pour Ie calcul de ces taux, il n'est pas tenu compte des deces survenus a Koper et Buie qui<br />
constituent 10 partie Ie !'ancien Territoire Iibre de Trieste attribuee a 10 Yougoslavie en<br />
1954, mais Ie nombre des deces est rapport.. a I'effectif total de 10 population.<br />
C mnm<br />
en


