

1957 - United Nations Statistics Division
1957 - United Nations Statistics Division
1957 - United Nations Statistics Division

You also want an ePaper? Increase the reach of your titles
YUMPU automatically turns print PDFs into web optimized ePapers that Google loves.
year of 1.0 per 1,000 births for males and 0.8 per 1,000<br />
for females. Post-neo-natal mortality (1-11 months)<br />
showed a net annual decline of 1.9 for males and 1.5 for<br />
females. These figures confirm the impression that neonatal<br />
mortality has probably reached almost a minimum<br />
level under present circumstances in countries of low<br />
over-all infant mortality and is becoming more difficult<br />
to reduce. To decrease it still further, that is, to approach<br />
the success achieved in saving lives in early infancy, appears<br />
to demand new techniques.<br />
Mortality past infancy<br />
The inadequacies of the crude death rate for analysing<br />
changes in mortality have been set forth on p. 2. It was<br />
also noted in that section that according to the crude<br />
death rate, mortality had declined in all parts of the<br />
world - especially during the last decade - and appears<br />
to be continuing to decrease. To see whether these declines<br />
occurred throughout the age span or whether they<br />
reflect a combination of increasing mortality at some ages<br />
and decreases at others, the age specific death rates from<br />
Table 11 (p. 288) have been studied; these are the deaths<br />
in each age group per 1,000 population of the same age.<br />
First, it must be emphasized that age specific death rates<br />
are available for far fewer countries than are the crude<br />
rates. <strong>Statistics</strong> of deaths classified by age, together with<br />
a corresponding population for computing the specific<br />
rates, are not so widely available as are the total deaths<br />
and population. Further, to study a change over time,<br />
two sets of rates are required, separated by at least 5<br />
years. Rates by age for a year around 1948 and also for a<br />
current year are available for a maximum of 29 population<br />
groups and, with the exception of China (Taiwan),<br />
Japan, Israel, and Cyprus, these refer to countries of<br />
Europe, North America, and Oceania. For this reason,<br />
the following analysis of age as a factor in declining<br />
mortality cannot be interpreted on an international basis.<br />
It reflects only the experience of this rather limited group<br />
of areas for which data are available.<br />
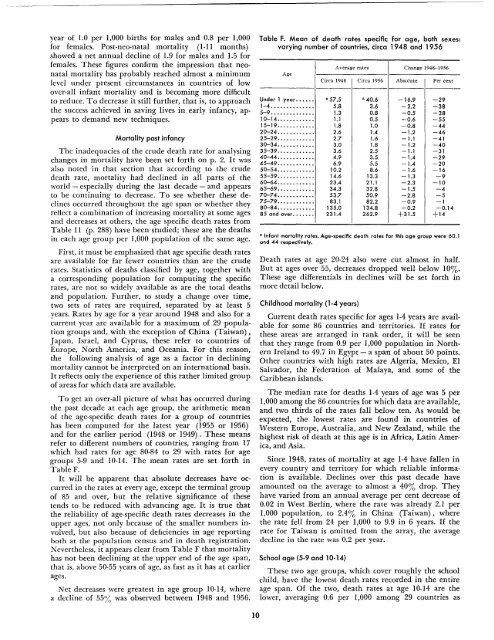
To get an over-all picture of what has occurred during<br />
the past decade at each age group, the arithmetic mean<br />
of the age-specific death rates for a group of countries<br />
has been computed for the latest year (1955 or 1956)<br />
and for the earlier period (1948 or 1949). These means<br />
refer to different numbers of countries, ranging from 17<br />
which had rates for age 80-84 to 29 with rates for age<br />
groups 5-9 and 10-14. The mean rates are set forth in<br />
Table F.<br />
It will be apparent that absolute decreases have occurred<br />
in the rates at every age, except the terminal group<br />
of 85 and over, but the relative significance of these<br />
tends to be reduced with advancing age. It is true that<br />
the reliability of age-specific death rates decreases in the<br />
upper ages, not only because of the smaller numbers involved,<br />
but also because of deficiencies in age reporting<br />
both at the population census and in death registration.<br />
Nevertheless, it appears clear from Table F that mortality<br />
has not been declining at the upper end of the age span,<br />
that is, above 50-55 years of age, as fast as it has at earlier<br />
ages.<br />
Net decreases were greatest in age group 10-14, where<br />
a decline of 55% was observed between 1948 and 1956.<br />
10<br />
Table F. Mean of death rates specific for age, both sexes:<br />
varying number of countries, circa 1948 and 1956<br />
Age<br />
Average rates Change 1948-1956<br />
Circa 1948 Circa 1956 Absolute Per cent<br />
-----<br />
Under 1 year•••••• "57.5 "40.6 -16.9 -29<br />
1-4.............. 5.8 3.6 -2.2 -38<br />
5-9.............. 1.3 0.8 -0.5 -38<br />
10-14............ 1.1 0.5 -0.6 -55<br />
15-19............ 1.8 1.0 -0.8 -44<br />
20-24............ 2.6 1.4 -1.2 -46<br />
25-29............ 2.7 1.6 -1.1 -41<br />
30-34............ 3.0 1.8 -1.2 -40<br />
35-39.......•.... 3.6 2.5 -1.1 -31<br />
40-44............ 4.9 3.5 -1.4 -29<br />
45-49............ 6.9 5.5 -1.4 -20<br />
50-54............ 10.2 8.6 -1.6 -16<br />
55-59............ 14.6 13.3 -1.3 -9<br />
60-64............ 23.4 21.1 -2.3 -10<br />
65-69............ 34.3 32.8 -1.5 -4<br />
70-74............ 53.7 50.9 -2.8 -5<br />
75-79............ 83.1 82.2 -0.9 -1<br />
80-84............ 135.0 134.8 -0.2 -0.14<br />
85 and over••••••. 231.4 262.9 +31.5 +14<br />
" Infant mortality rotes. Age-speciAc death rates for this age group were 60.1<br />
and 44 respectively.<br />
Death rates at age 20-24 also were cut almost in half.<br />
But at ages over 55, decreases dropped well below 10%.<br />
These age differentials in declines will be set forth in<br />
more detail below.<br />
Childhood mortality (1-4 years)<br />
Current death rates specific for ages 1-4 years are available<br />
for some 86 countries and territories. If rates for<br />
these areas are arranged in rank order, it will be seen<br />
that they range from 0.9 per 1,000 population in Northern<br />
Ireland to 49.7 in Egypt - a span of about 50 points.<br />
Other countries with high rates are Algeria, Mexico, E1<br />
Salvador, the Federation of Malaya, and some of the<br />
Caribbean islands.<br />
The median rate for deaths 1-4 years of age was 5 per<br />
1,000 among the 86 countries for which data are available,<br />
and two thirds of the rates fall below ten. As would be<br />
expected, the lowest rates are found in countries of<br />
Western Europe, Australia, and New Zealand, while the<br />
highest risk of death at this age is in Africa, Latin America,<br />
and Asia.<br />
Since 1948, rates of mortality at age 1-4 have fallen in<br />
every country and territory for which reliable information<br />
is available. Declines over this past decade have<br />
amounted on the average to almost a 40% drop. They<br />
have varied from an annual average per cent decrease of<br />
0.02 in West Berlin, where the rate was already 2.1 per<br />
1,000 population, to 2.4% in China (Taiwan), where<br />
the rate fell from 24 per 1,000 to 9.9 in 6 years. If the<br />
rate for Taiwan is omitted from the array, the average<br />
decline in the rate was 0.2 per year.<br />
School age (5-9 and 10-14)<br />
These two age groups, which cover roughly the school<br />
child, have the lowest death rates recorded in the entire<br />
age span. Of the two, death rates at age 10-14 are the<br />
lower, averaging 0.6 per 1,000 among 29 countries as


