

1957 - United Nations Statistics Division
1957 - United Nations Statistics Division
1957 - United Nations Statistics Division

Create successful ePaper yourself
Turn your PDF publications into a flip-book with our unique Google optimized e-Paper software.
of deaths. Certainly, it must be assumed that completeness<br />
of registration of deaths has improved during the<br />
last 20 years and, if lower rates persist, they must be<br />
reflections of lower mortality risk and of changes in<br />
population composition resulting from the high birth<br />
rates of the past decades.<br />
Actual percentage declines in mortality over the two<br />
decades were, in general, highest in countries where the<br />
1930-34 rate had been high to begin with, and correspondingly<br />
slighter declines were observed in Europe,<br />
North America, and Oceania, where rates were already<br />
low in the early period. For example, the rate for Northern<br />
Ireland was 18.2 in 1930-34; it declined 37.4% to<br />
11.4 in 1950-54. However, the rate for England and Wales<br />
which was already 12.0 in 1930-34 declined only 3.3%<br />
to 11.6 per 1,000. Similarly, the rate for Maoris in New<br />
Zealand, having been 15.5 in the early period, declined<br />
27.7% to 11.2, while that for the European population<br />
increased 10.8% from 8.3 to 9.2.<br />
Declines of over 40% were observed in 23 countries,<br />
and 14 of these were in countries where crude death rates<br />
in 1930-34 had been over 20 per 1,000. These countries<br />
of previous maximum death rates and maximum decline<br />
are scattered all over the world, including Mauritius,<br />
Egypt, Guatemala, Mexico, Ecuador, Barbados, Chile,<br />
Singapore, India, Ceylon, Romania, and China<br />
(Taiwan) .<br />
Expectation of life<br />
Reductions in mortality imply an increase in the<br />
chance of survival. These can be seen in the statistics of<br />
survivorship, beginning on p. 590, but they are more<br />
dramatically demonstrated in the increases in the average<br />
future lifetime expected at birth. Some idea of the gains<br />
made over the past 50 years can be obtained from the<br />
expectation-of-life values for 21 countries which have a<br />
series of life tables from the first decade of the 20th century<br />
to the present. These values, which are set forth in<br />
Table D below, have been taken from Table 24 (p. 558).<br />
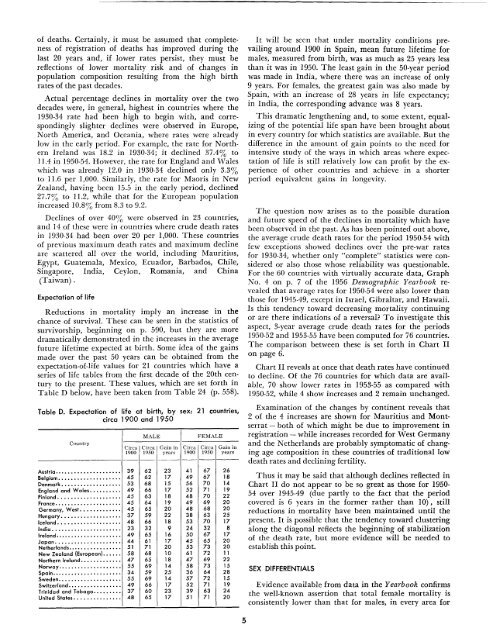
Table D. Expectation of life at birth, by sex: 21 countries,<br />
circa 1900 and 1950<br />
Country<br />
MALE FEMALE<br />
Circa Circa Gain in Circa Circa Gain in<br />
1900 1950 years 1900 1950 years<br />
------------<br />
Austria ••••••••••••••••••••• 39 62 23 41 67 26<br />
Belgium ••••••••••••••.•••.• 45 62 17 49 67 18<br />
Denmark ••••••••••••••••••• 53 68 15 56 70 14<br />
England and Wales•••••••••. 49 66 17 52 71 19<br />
Finland •.••••••••.••••••••• 45 63 18 48 70 22<br />
France.••.•.••.••.••••. ··· . 45 64 19 49 69 20<br />
Germany, West••••••••••••• 45 65 20 48 68 20<br />
Hungary•••••.••••••••••••• 37 59 22 38 63 25<br />
Iceland •••••••••••••••••••• 48 66 18 53 70 17<br />
India ..••••.•.••••••••••••• 23 32 9 24 32 8<br />
Ireland••••••••••••••••••••• 49 65 16 50 67 17<br />
Japan ..•.••••••••••••••••• 44 61 17 45 65 20<br />
Netherlands••••.•••••••••••. 51 71 20 53 73 20<br />
New Zealand (European)•••••. 58 68 10 61 72 11<br />
Northern Ireland•••.••••••••• 47 65 18 47 69 22<br />
Norway••.••••••••••••••••• 55 69 14 58 73 15<br />
Spain•••••••••••••••••••••• 34 59 25 36 64 28<br />
Sweden.••.•••••.•••••••••. 55 69 14 57 72 15<br />
Switzerland••..••••••••••.•. 49 66 17 52 71 19<br />
Trinidad and Tobago••••••••• 37 60 23 39 63 24<br />
<strong>United</strong> States•••••••••••.••• 48 65 17 51 71 20<br />
5<br />
It will be seen that under mortality conditions prevailing<br />
around 1900 in Spain, mean future lifetime for<br />
males, measured from birth, was as much as 25 years less<br />
than it was in 1950. The least gain in the 50-year period<br />
was made in India, where there was an increase of only<br />
9 years. For females, the greatest gain was also made by<br />
Spain, with an increase of 28 years in life expectancy;<br />
in India, the corresponding advance was 8 years.<br />
This dramatic lengthening and, to some extent, equalizing<br />
of the potential life span have been brought about<br />
in every country for which statistics are available. But the<br />
difference in the amount of gain points to the need for<br />
intensive study of the ways in which areas where expectation<br />
of life is still relatively low can profit by the experience<br />
of other countries and achieve in a shorter<br />
period equivalent gains in longevity.<br />
The question now arises as to the possible duration<br />
and future speed of the declines in mortality which have<br />
been observed in the past. As has been pointed out above,<br />
the average crude death rates for the period 1950-54 with<br />
few exceptions showed declines over the pre-war rates<br />
for 1930-34, whether only "complete" statistics were considered<br />
or also those whose reliability was questionable.<br />
For the 60 countries with virtually accurate data, Graph<br />
No. 4 on p. 7 of the 1956 Demographic Yearbook revealed<br />
that average rates for 1950-54 were also lower than<br />
those for 1945-49, except in Israel, Gibraltar, and Hawaii.<br />
Is this tendency toward decreasing mortality continuing<br />
or are there indications of a reversal? To investigate this<br />
aspect, 3-year average crude death rates for the periods<br />
1950-52 and 1953-55 have been computed for 76 countries.<br />
The comparison between these is set forth in Chart II<br />
on page 6.<br />
Chart H reveals at once that death rates have continued<br />
to decline. Of the 76 countries for which data are available,<br />
70 show lower rates in 1953-55 as compared with<br />
1950-52, while 4 show increases and 2 remain unchanged.<br />
Examination of the changes by continent reveals that<br />
2 of the 4 increases are shown for Mauritius and Montserrat<br />
- both of which might be due to improvement in<br />
registration - while increases recorded for West Germany<br />
and the Netherlands are probably symptomatic of changing<br />
age composition in these countries of traditional low<br />
death rates and declining fertility.<br />
Thus it may be said that although declines reflected in<br />
Chart II do not appear to be so great as those for 1950<br />
54 over 1945-49 (due partly to the fact that the period<br />
covered is 6 years in the former rather than 10), still<br />
reductions in mortality have been maintained until the<br />
present. It is possible that the tendency toward clustering<br />
along the diagonal reflects the beginning of stabilization<br />
of the death rate, but more evidence will be needed to<br />
establish this point.<br />
SEX DIFFERENTIALS<br />
Evidence available from data in the Yearbook confirms<br />
the well-known assertion that total female mortality is<br />
consistently lower than that for males, in every area for


