

1957 - United Nations Statistics Division
1957 - United Nations Statistics Division
1957 - United Nations Statistics Division

You also want an ePaper? Increase the reach of your titles
YUMPU automatically turns print PDFs into web optimized ePapers that Google loves.
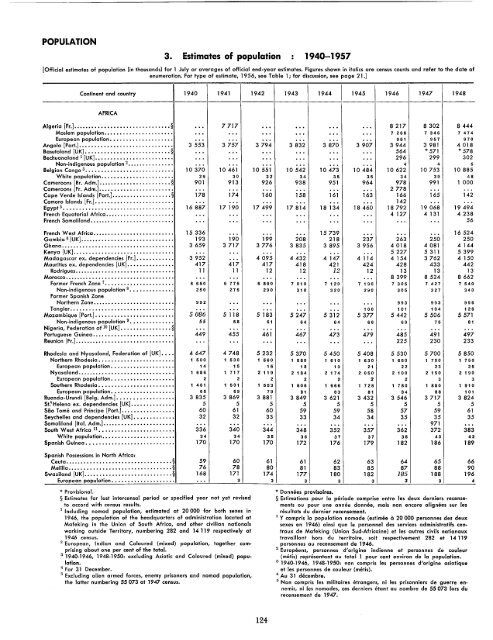
POPULATION<br />
3. Estimates of population 1940-<strong>1957</strong><br />
[Official estimates of population (in thousands) for 1 July or averages of official end-yeor estimates. Figures shown in italics are census counts and refer to the date of<br />
enumeration. For type of estimate, 1956, see Table 1; for discussion, see page 21.]<br />
Continent and country 1940 1941 1942 1943 1944 1945 1946 1947 1948<br />
AFRICA<br />
Algeria [Fr.] •••••••••••••••••.•.•....•.••••§ ·.. 7717 ... ... ... ... 8217 8302 8444<br />
Moslem population••••••.•........•.•••. ... ... ... ... ... ... 7 266 7 346 7 474<br />
European population••••.•••.••••....••. ... .. . ... ·.. ... ... 951 957 970<br />
Angola [Por!.] •.•.•••••••••............•.••. 3553 3757 3794 3832 3870 3907 3944 3981 4018<br />
Basutoland [UK] .•••••••••••..........•...•§ ... .. , ... ... ·.. ... 564 * 571 * 578<br />
Bechuanaland 1 [UK] •••••••••••••..........•• .. . ... ... ·.. ... ... 296 299 302<br />
Non-indigenous population 2••••••••••••••• ·.. ·.. ... ... .. . ... 4 4 5<br />
Belgian Congo 3•••••••••••••••••••••••••••• 10370 10461 10551 10542 10473 10484 10622 10753 10885<br />
White population.••••••••••••.......••• 29 30 32 34 35 35 34 39 48<br />
Cameroons [Br. Adm.] ...••••••••••........•• § 901 913 926 938 951 964 978 991 1 000<br />
Cameroons [Fr. Adm.] .•.••••••••......•...••. ·.. ·.. ... .. . .. . .. . 2778 ... ...<br />
Cape Verde Islands [Port.]...................§ 178 174 160 158 161 163 166 165 142<br />
Comoro Islands [Fr.] •.•••••••.•.•..........•. .. . ... ... .. . .. . ·.. 142 .. . ...<br />
Egypt 5 ••••••••••••••••••••••••••••••••••• 16887 17190 17499 17814 18134 18460 18792 19068 19494<br />
French Equatorial Africa••••................•• ... ... ... ·.. .. . ·.. 4127 4131 4238<br />
French Somaliland•••.•.•••...........•...••. ... ... ... .. . ·.. ... ... ... 56<br />
French West Africa .•.•••.•••••••••••••.••... 15336 .. . ... ... 15739 ... ... ... 16524<br />
Gambia 6 [UK] .••••••••••••••••••••••••••.•• 193 190 199 208 218 237 263 250 250<br />
Ghana.....•.••••••••••.••••••••••.••.•... 3659 3717 3776 3835 3895 3956 4018 4081 4144<br />
Kenya [UK] •.•.•.•.•••••••••...••••••.•.•.. .. . .. . ... ... .. . ·.. 5227 5311 5399<br />
Madagascar ex. dependencies [Fr.] ••••••••.•.• 3952 ... 4095 4432 4147 4114 4154 3762 4150<br />
Mauritius ex. dependencies [UK] •.•••.••••••••• 417 417 417 418 421 424 428 433 442<br />
Rodrigues..••.•.••••••••••••••••.••••..•• 11 11 12 12 12 12 13 13 13<br />
Morocco.•.•.•..••••••••••••••••••••••.•••• · " ·.. ... ... ... ... 8399 8524 8662<br />
Former French Zone 7•••••••••••••••••••••• 6 650 6 775 6 890 7 010 7 120 7 190 7 305 7 427 7 540<br />
Non-indigenous population 8•••••••••••••• 250 275 290 310 320 290 305 327 340<br />
Former Spanish Zone<br />
Northern Zone .•...••••••••••••••••••••. 992 ... ... ... .. . ... 993 993 996<br />
Tangier••.••.•.••••.••••.••••••••••.•••. ·.. ... ... ... ... 100 101 104 126<br />
Mozambique [Port.] ••••••••••••••••••••••••• 5086 5118 5183 5247 5312 5377 5442 5506 5571<br />
Non-indigenous populotion 9•••••••••••••• 55 58 61 64 64 66 69 75 81<br />
Nigeria, Federation of 10 [UK] •••••••••••••••• § ... ... ... .. . ·.. .. . .. . ... ...<br />
Portuguese Guinea .•.••••••••••••••••••••••. 449 455 461 467 473 479 485 491 497<br />
Reunion [Fr.] .•.••••••••••••••••••••••••.•.•. ·.. " . ... ... ... ... 225 230 233<br />
Rhodesia and Nyasaland, Federation of [UK] •••• 4647 4748 5232 5370 5450 5408 5530 5700 5850<br />
Northern Rhodesia ••.•••••••••••••••••.••• 1 500 1 530 1 560 1 580 1 610 1 630 1 650 1 700 1 750<br />
European population .••••••••••••••••••• 14 15 15 18 19 21 22 23 25<br />
Nyasaland......••••.••..•••••••••••••••. 1 686 1 717 2 119 2 184 2 174 2 050 2 100 2 150 2 190<br />
European population ..•••••••••••••.•.•. 2 2 2 2 2 2 2 3 3<br />
Southern Rhodesia •••.•••••.•••••••••••••• 1 461 1 501 1 553 1 606 1 666 1 728 1 780 1 850 1 910<br />
European population••••••••••••••••••.. 65 69 79 81 83 81 84 88 101<br />
Ruanda-Urundi [Belg. Adm.] ..••.•••.•••.•.••• 3835 3869 3881 3849 3621 3432 3546 3717 3824<br />
St.' Helena ex. dependencies [UK] •••••••••••••• 5 5 5 5 5 5 5 5 5<br />
Sao Tome and Principe [Por!.] ................. 60 61 60 59 59 58 57 59 61<br />
Seychelles and dependencies [UK] •••••••....•• 32 32 33 33 34 34 35 35 35<br />
Somaliland [Ital. Adm.] •.••••••••••••••••••••• ·.. ·.. ... ·.. ... .. . ... 971 ...<br />
South West Africa 11 •••••••••••••••••••••••• 336 340 344 348 352 357 362 372 383<br />
White population.••••••••••••........•• 34 34 35 36 37 37 38 40 42<br />
Spanish Guinea •••••.••••••••••••..•.•.•••• 170 170 170 172 176 179 182 186 189<br />
Spanish Possessions in North Africa:<br />
Ceuta.•...••••..•....••••••••.......•.•§ 59 60 61 61 62 63 64 65 66<br />
Melillo ..••.•••.••••••••••••••••........§ 76 78 80 81 83 85 87 88 90<br />
Swaziland [UK] ...••••••••••••••.•••...•..•§ 168 171 174 177 180 182 185 188 196<br />
European population•••••••.•••.•••••.•. ... 3 3 3 3 3 3 3 4<br />
* Provisional.<br />
§ Estimates for last intercensal period or specified year not yet revised<br />
to accord with census results.<br />
1 Including nomad population, estimated at 20000 for both sexes in<br />
1946, the population of the headquarters of administration located at<br />
Mafeking in lhe Union of South Africa, and other civilian nationals<br />
working outside Territory, numbering 282 and 14119 respectively at<br />
1946 census.<br />
2 European, Indian and Coloured (mixed) population, together com·<br />
prising about one per cent of the total.<br />
3 1940-1946, 1948-1950: excluding Asiatic and Coloured (mixed) population.<br />
4 For 31 December.<br />
5 Excluding alien armed forces, enemy prisoners and nomad population,<br />
the latter numbering 55073 at 1947 census.<br />
124<br />
* Donnees provisoires.<br />
§ Estimations pour 10 periode comprise entre les deux derniers recensements<br />
ou pour une annee dOnntle, mais non encore alignees sur les<br />
resultats du dernier recensement.<br />
1 Y compris la population nomade (estimee 020000 personnes des deux<br />
sexes en 1946) ains; que Ie personnel des services administratifs cen·<br />
traux de Mafeking (Union Sud-Africaine) et les autres civils nationaux<br />
travaillant hors du territoire, soit respectivement 2B2 et 14 119<br />
personnes au recensement de 1946.<br />
2 Europeens, personnes d'origine indienne et personnes de couleur<br />
(metis) representant au total 1 pour cent environ de 10 population.<br />
3 1940-1946, 1948.1950: non compris les personnes d'origine asiatique<br />
et les personnes de couleur (metis).<br />
4 Au 31 decembre.<br />
5 Non campris les militaires etrangers, ni les prisonniers de guerre ennemis,<br />
ni les nomades, ces derniers etant au nombre de 55 073 lars du<br />
recensement de 1947.


