
Create successful ePaper yourself
Turn your PDF publications into a flip-book with our unique Google optimized e-Paper software.
Rapport <strong>de</strong> gestion 3<br />
Environnement et développement durable : pilotage et performance<br />
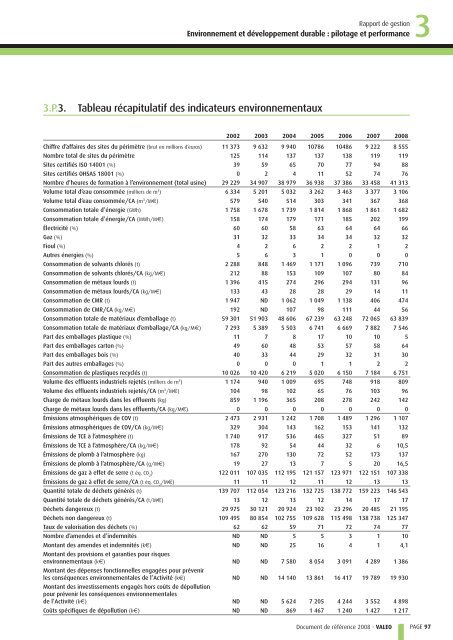
3.P.3. Tableau récapitulatif <strong>de</strong>s indicateurs environnementaux<br />
2002 2003 2004 2005 2006 2007 <strong>2008</strong><br />
Chiffre d’affaires <strong>de</strong>s sites du périmètre (brut en millions d’euros) 11 373 9 632 9 940 10786 10486 9 222 8 555<br />
Nombre total <strong>de</strong> sites du périmètre 125 114 137 137 138 119 119<br />
Sites certifiés ISO 14001 (%) 39 59 65 70 77 94 88<br />
Sites certifiés OHSAS 18001 (%) 0 2 4 11 52 74 76<br />
Nombre d’heures <strong>de</strong> formation à l’environnement (total usine) 29 229 34 907 38 979 36 938 37 386 33 458 41 313<br />
Volume total d’eau consommée (milliers <strong>de</strong> m3 ) 6 334 5 201 5 032 3 262 3 463 3 377 3 106<br />
Volume total d’eau consommée/CA (m3 /M€) 579 540 514 303 341 367 368<br />
Consommation totale d’énergie (GWh) 1 758 1 678 1 739 1 814 1 868 1 861 1 682<br />
Consommation totale d’énergie/CA (MWh/M€) 158 174 179 171 185 202 199<br />
Électricité (%) 60 60 58 63 64 64 66<br />
Gaz (%) 31 32 33 34 34 32 32<br />
Fioul (%) 4 2 6 2 2 1 2<br />
Autres énergies (%) 5 6 3 1 0 0 0<br />
Consommation <strong>de</strong> solvants chlorés (t) 2 288 848 1 469 1 171 1 096 739 710<br />
Consommation <strong>de</strong> solvants chlorés/CA (kg/M€) 212 88 153 109 107 80 84<br />
Consommation <strong>de</strong> métaux lourds (t) 1 396 415 274 296 294 131 96<br />
Consommation <strong>de</strong> métaux lourds/CA (kg/M€) 133 43 28 28 29 14 11<br />
Consommation <strong>de</strong> CMR (t) 1 947 ND 1 062 1 049 1 138 406 474<br />
Consommation <strong>de</strong> CMR/CA (kg/M€) 192 ND 107 98 111 44 56<br />
Consommation totale <strong>de</strong> matériaux d’emballage (t) 59 301 51 903 48 606 67 239 63 248 72 065 63 839<br />
Consommation totale <strong>de</strong> matériaux d’emballage/CA (kg/M€) 7 293 5 389 5 503 6 741 6 669 7 882 7 546<br />
Part <strong>de</strong>s emballages plastique (%) 11 7 8 17 10 10 5<br />
Part <strong>de</strong>s emballages carton (%) 49 60 48 53 57 58 64<br />
Part <strong>de</strong>s emballages bois (%) 40 33 44 29 32 31 30<br />
Part <strong>de</strong>s autres emballages (%) 0 0 0 1 1 2 2<br />
Consommation <strong>de</strong> plastiques recyclés (t) 10 026 10 420 6 219 5 020 6 150 7 184 6 751<br />
Volume <strong>de</strong>s effluents industriels rejetés (milliers <strong>de</strong> m3 ) 1 174 940 1 009 695 748 918 809<br />
Volume <strong>de</strong>s effluents industriels rejetés/CA (m3 /M€) 104 98 102 65 76 103 96<br />
Charge <strong>de</strong> métaux lourds dans les effluents (kg) 859 1 196 365 208 278 242 142<br />
Charge <strong>de</strong> métaux lourds dans les effluents/CA (kg/M€) 0 0 0 0 0 0 0<br />
Émissions atmosphériques <strong>de</strong> COV (t) 2 473 2 931 1 242 1 708 1 489 1 296 1 107<br />
Émissions atmosphériques <strong>de</strong> COV/CA (kg/M€) 329 304 143 162 153 141 132<br />
Émissions <strong>de</strong> TCE à l’atmosphère (t) 1 740 917 536 465 327 51 89<br />
Émissions <strong>de</strong> TCE à l’atmosphère/CA (kg/M€) 178 92 54 44 32 6 10,5<br />
Émissions <strong>de</strong> plomb à l’atmosphère (kg) 167 270 130 72 52 173 137<br />
Émissions <strong>de</strong> plomb à l’atmosphère/CA (g/M€) 19 27 13 7 5 20 16,5<br />
Émissions <strong>de</strong> gaz à effet <strong>de</strong> serre (t éq. CO ) 2 122 011 107 035 112 195 121 157 123 971 122 151 107 338<br />
Émissions <strong>de</strong> gaz à effet <strong>de</strong> serre/CA (t éq. CO /M€) 2 11 11 12 11 12 13 13<br />
Quantité totale <strong>de</strong> déchets générés (t) 139 707 112 054 123 216 132 725 138 772 159 223 146 543<br />
Quantité totale <strong>de</strong> déchets générés/CA (t/M€) 13 12 13 12 14 17 17<br />
Déchets dangereux (t) 29 975 30 121 20 924 23 102 23 296 20 485 21 195<br />
Déchets non dangereux (t) 109 495 80 854 102 755 109 628 115 498 138 738 125 347<br />
Taux <strong>de</strong> valorisation <strong>de</strong>s déchets (%) 62 62 59 71 72 74 77<br />
Nombre d’amen<strong>de</strong>s et d’in<strong>de</strong>mnités ND ND 5 5 3 1 10<br />
Montant <strong>de</strong>s amen<strong>de</strong>s et in<strong>de</strong>mnités (k€)<br />
Montant <strong>de</strong>s provisions et garanties pour risques<br />
ND ND 25 16 4 1 4,1<br />
environnementaux (k€)<br />
Montant <strong>de</strong>s dépenses fonctionnelles engagées pour prévenir<br />
ND ND 7 580 8 054 3 091 4 289 1 386<br />
les conséquences environnementales <strong>de</strong> l’Activité (k€)<br />
Montant <strong>de</strong>s investissements engagés hors coûts <strong>de</strong> dépollution<br />
pour prévenir les conséquences environnementales<br />
ND ND 14 140 13 861 16 417 19 789 19 930<br />
<strong>de</strong> l’Activité (k€) ND ND 5 624 7 205 4 244 3 552 4 898<br />
Coûts spécifiques <strong>de</strong> dépollution (k€) ND ND 869 1 467 1 240 1 427 1 217<br />
<strong>Document</strong> <strong>de</strong> <strong>référence</strong> <strong>2008</strong> - VALEO<br />
PAGE 97