Document de référence 2012 (PDF 1.92MB) - Valeo
Document de référence 2012 (PDF 1.92MB) - Valeo
Document de référence 2012 (PDF 1.92MB) - Valeo

Create successful ePaper yourself
Turn your PDF publications into a flip-book with our unique Google optimized e-Paper software.
7 CAPITAL<br />
PAGE 318<br />
ET ACTIONNARIAT<br />
Données boursières<br />
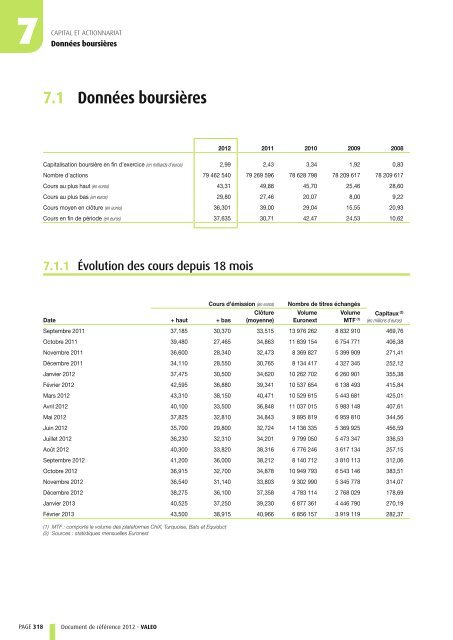
7.1 Données boursières<br />
<strong>Document</strong> <strong>de</strong> <strong>référence</strong> <strong>2012</strong> - VALEO<br />
<strong>2012</strong> 2011 2010 2009 2008<br />
Capitalisation boursière en fin d’exercice (en milliards d’euros) 2,99 2,43 3,34 1,92 0,83<br />
Nombre d’actions 79 462 540 79 269 596 78 628 798 78 209 617 78 209 617<br />
Cours au plus haut (en euros) 43,31 49,88 45,70 25,46 28,60<br />
Cours au plus bas (en euros) 29,80 27,46 20,07 8,00 9,22<br />
Cours moyen en clôture (en euros) 36,301 39,00 29,04 15,55 20,93<br />
Cours en fin <strong>de</strong> pério<strong>de</strong> (en euros) 37,635 30,71 42,47 24,53 10,62<br />
7.1.1 Évolution <strong>de</strong>s cours <strong>de</strong>puis 18 mois<br />
Cours d’émission (en euros) Nombre <strong>de</strong> titres échangés<br />
Capitaux<br />
Date<br />
(2)<br />
Clôture Volume Volume<br />
+ haut + bas (moyenne) Euronext MTF (en millions d’euros)<br />
(1)<br />
Septembre 2011 37,185 30,370 33,515 13 976 262 8 832 910 469,76<br />
Octobre 2011 39,480 27,465 34,863 11 839 154 6 754 771 406,38<br />
Novembre 2011 36,600 28,340 32,473 8 369 827 5 399 909 271,41<br />
Décembre 2011 34,110 28,550 30,765 8 134 417 4 327 345 252,12<br />
Janvier <strong>2012</strong> 37,475 30,500 34,620 10 262 702 6 260 901 355,38<br />
Février <strong>2012</strong> 42,595 36,880 39,341 10 537 654 6 138 493 415,84<br />
Mars <strong>2012</strong> 43,310 38,150 40,471 10 529 615 5 443 681 425,01<br />
Avril <strong>2012</strong> 40,100 33,500 36,848 11 037 015 5 983 148 407,61<br />
Mai <strong>2012</strong> 37,825 32,810 34,843 9 895 819 6 959 810 344,56<br />
Juin <strong>2012</strong> 35,700 29,800 32,724 14 136 335 5 369 925 456,59<br />
Juillet <strong>2012</strong> 36,230 32,310 34,201 9 799 050 5 473 347 336,53<br />
Août <strong>2012</strong> 40,300 33,820 38,316 6 776 246 3 617 134 257,15<br />
Septembre <strong>2012</strong> 41,200 36,000 38,212 8 140 712 3 810 113 312,06<br />
Octobre <strong>2012</strong> 36,915 32,700 34,878 10 949 793 6 543 146 383,51<br />
Novembre <strong>2012</strong> 36,540 31,140 33,803 9 302 990 5 345 778 314,07<br />
Décembre <strong>2012</strong> 38,275 36,100 37,358 4 783 114 2 768 029 178,69<br />
Janvier 2013 40,525 37,250 39,230 6 877 361 4 446 790 270,19<br />
Février 2013 43,500 38,915 40,966 6 856 157 3 919 119 282,37<br />
(1) MTF : comporte le volume <strong>de</strong>s plateformes ChiX, Turquoise, Bats et Equiduct<br />
(2) Sources : statistiques mensuelles Euronext