

143133381-Cinetica-de-la-hidrolisis-del-acetato-de-etilo

You also want an ePaper? Increase the reach of your titles
YUMPU automatically turns print PDFs into web optimized ePapers that Google loves.
Ct<br />
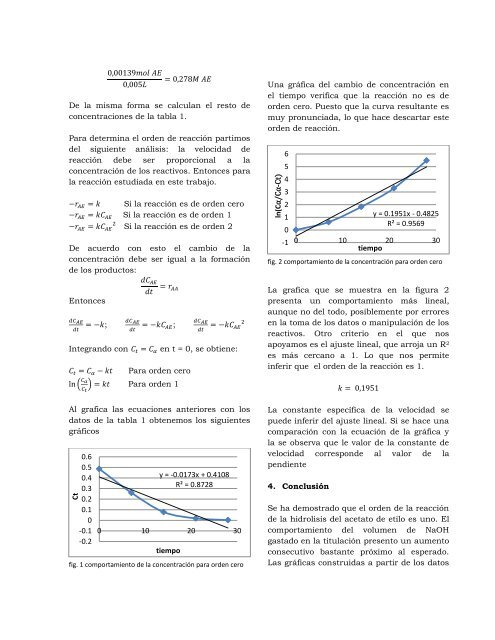
ln(Cα/Cα-Ct)<br />
De <strong>la</strong> misma forma se calcu<strong>la</strong>n el resto <strong>de</strong><br />
concentraciones <strong>de</strong> <strong>la</strong> tab<strong>la</strong> 1.<br />
Para <strong>de</strong>termina el or<strong>de</strong>n <strong>de</strong> reacción partimos<br />
<strong>de</strong>l siguiente análisis: <strong>la</strong> velocidad <strong>de</strong><br />
reacción <strong>de</strong>be ser proporcional a <strong>la</strong><br />
concentración <strong>de</strong> los reactivos. Entonces para<br />
<strong>la</strong> reacción estudiada en este trabajo.<br />
Si <strong>la</strong> reacción es <strong>de</strong> or<strong>de</strong>n cero<br />
Si <strong>la</strong> reacción es <strong>de</strong> or<strong>de</strong>n 1<br />
Si <strong>la</strong> reacción es <strong>de</strong> or<strong>de</strong>n 2<br />
De acuerdo con esto el cambio <strong>de</strong> <strong>la</strong><br />
concentración <strong>de</strong>be ser igual a <strong>la</strong> formación<br />
<strong>de</strong> los productos:<br />
Entonces<br />
Integrando con<br />
; ;<br />
Para or<strong>de</strong>n cero<br />
( ) Para or<strong>de</strong>n 1<br />
en t = 0, se obtiene:<br />
Una gráfica <strong>de</strong>l cambio <strong>de</strong> concentración en<br />
el tiempo verifica que <strong>la</strong> reacción no es <strong>de</strong><br />
or<strong>de</strong>n cero. Puesto que <strong>la</strong> curva resultante es<br />
muy pronunciada, lo que hace <strong>de</strong>scartar este<br />
or<strong>de</strong>n <strong>de</strong> reacción.<br />
6<br />
5<br />
4<br />
3<br />
2<br />
1<br />
0<br />
-1<br />
y = 0.1951x - 0.4825<br />
R² = 0.9569<br />
0 10 20 30<br />
tiempo<br />
fig. 2 comportamiento <strong>de</strong> <strong>la</strong> concentración para or<strong>de</strong>n cero<br />
La grafica que se muestra en <strong>la</strong> figura 2<br />
presenta un comportamiento más lineal,<br />
aunque no <strong>de</strong>l todo, posiblemente por errores<br />
en <strong>la</strong> toma <strong>de</strong> los datos o manipu<strong>la</strong>ción <strong>de</strong> los<br />
reactivos. Otro criterio en el que nos<br />
apoyamos es el ajuste lineal, que arroja un R 2<br />
es más cercano a 1. Lo que nos permite<br />
inferir que el or<strong>de</strong>n <strong>de</strong> <strong>la</strong> reacción es 1.<br />
Al grafica <strong>la</strong>s ecuaciones anteriores con los<br />
datos <strong>de</strong> <strong>la</strong> tab<strong>la</strong> 1 obtenemos los siguientes<br />
gráficos<br />
0.6<br />
0.5<br />
0.4<br />
0.3<br />
0.2<br />
0.1<br />
0<br />
-0.1<br />
-0.2<br />
y = -0.0173x + 0.4108<br />
R² = 0.8728<br />
0 10 20 30<br />
tiempo<br />
fig. 1 comportamiento <strong>de</strong> <strong>la</strong> concentración para or<strong>de</strong>n cero<br />
La constante específica <strong>de</strong> <strong>la</strong> velocidad se<br />
pue<strong>de</strong> inferir <strong>de</strong>l ajuste lineal. Si se hace una<br />
comparación con <strong>la</strong> ecuación <strong>de</strong> <strong>la</strong> gráfica y<br />
<strong>la</strong> se observa que le valor <strong>de</strong> <strong>la</strong> constante <strong>de</strong><br />
velocidad correspon<strong>de</strong> al valor <strong>de</strong> <strong>la</strong><br />
pendiente<br />
4. Conclusión<br />
Se ha <strong>de</strong>mostrado que el or<strong>de</strong>n <strong>de</strong> <strong>la</strong> reacción<br />
<strong>de</strong> <strong>la</strong> <strong>hidrolisis</strong> <strong>de</strong>l <strong>acetato</strong> <strong>de</strong> <strong>etilo</strong> es uno. El<br />
comportamiento <strong>de</strong>l volumen <strong>de</strong> NaOH<br />
gastado en <strong>la</strong> titu<strong>la</strong>ción presento un aumento<br />
consecutivo bastante próximo al esperado.<br />
Las gráficas construidas a partir <strong>de</strong> los datos