Patrones de mortalidad en España 2014
PatronesMortalidadEspana2014.1
PatronesMortalidadEspana2014.1

You also want an ePaper? Increase the reach of your titles
YUMPU automatically turns print PDFs into web optimized ePapers that Google loves.
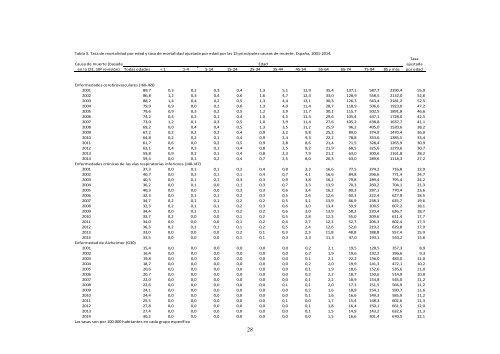
Tabla 3. Tasa <strong>de</strong> <strong>mortalidad</strong> por edad y tasa <strong>de</strong> <strong>mortalidad</strong> ajustada por edad por las 15 principales causas <strong>de</strong> muerte. <strong>España</strong>, 2001-<strong>2014</strong>.<br />
Causa <strong>de</strong> muerte (basada<br />
<strong>en</strong> la CIE, 10ª revisión)<br />
Edad<br />
Todas eda<strong>de</strong>s < 1 1-4 5-14 15-24 25-34 35-44 45-54 55-64 65-74 75-84 85 y más<br />
Tasa<br />
ajustada<br />
por edad<br />
Enfermeda<strong>de</strong>s cerebrovasculares (I60-I69)<br />
2001 89,7 0,3 0,2 0,3 0,4 1,3 5,1 12,9 35,4 137,1 587,7 2190,4 55,0<br />
2002 86,8 1,2 0,3 0,4 0,6 1,6 4,7 12,4 33,0 128,9 558,5 2132,0 52,6<br />
2003 88,2 1,4 0,4 0,2 0,5 1,3 4,4 13,1 30,3 126,3 563,4 2181,2 52,5<br />
2004 79,9 0,9 0,0 0,2 0,6 1,3 4,0 11,4 28,7 118,9 506,6 1923,0 47,2<br />
2005 79,6 0,9 0,3 0,2 0,5 1,2 3,9 11,7 30,1 115,7 502,5 1891,8 46,6<br />
2006 74,2 0,4 0,2 0,1 0,4 1,0 4,5 11,3 29,6 105,4 447,1 1728,0 42,5<br />
2007 73,0 1,2 0,1 0,3 0,5 1,0 3,9 11,4 27,6 105,2 438,8 1637,7 41,1<br />
2008 69,2 0,0 0,4 0,4 0,5 1,3 3,5 11,2 25,9 96,2 405,0 1520,6 38,2<br />
2009 67,2 0,2 0,2 0,2 0,4 0,9 3,2 9,8 25,2 89,0 374,9 1470,4 36,0<br />
2010 64,8 0,2 0,2 0,1 0,4 0,9 2,4 9,3 22,2 78,8 353,6 1385,5 33,4<br />
2011 61,7 0,6 0,0 0,2 0,5 0,9 2,8 8,6 21,4 71,5 328,4 1265,9 30,9<br />
2012 63,1 0,4 0,3 0,1 0,4 0,8 2,5 8,2 21,9 68,5 325,6 1279,6 30,7<br />
2013 59,8 0,9 0,2 0,1 0,4 0,8 2,3 7,9 21,2 63,0 300,6 1161,8 28,2<br />
<strong>2014</strong> 59,4 0,0 0,1 0,2 0,4 0,7 2,5 8,0 20,3 63,0 289,6 1118,3 27,2<br />
Enfermeda<strong>de</strong>s crónicas <strong>de</strong> las vías respiratorias inferiores (J40-J47)<br />
2001 37,3 0,0 0,1 0,1 0,2 0,4 0,8 3,3 16,6 77,5 274,2 716,8 22,9<br />
2002 40,7 0,0 0,2 0,1 0,1 0,4 0,7 4,1 16,6 84,8 296,6 771,4 24,7<br />
2003 40,5 0,0 0,1 0,1 0,3 0,3 0,9 3,8 16,2 79,8 289,4 795,4 24,2<br />
2004 36,2 0,0 0,1 0,0 0,1 0,3 0,7 3,3 13,9 70,3 260,2 704,1 21,3<br />
2005 40,3 0,0 0,0 0,0 0,3 0,3 0,6 3,4 16,2 80,3 287,1 770,4 23,6<br />
2006 32,3 0,0 0,1 0,1 0,2 0,3 0,5 2,6 12,6 60,3 222,4 627,0 18,5<br />
2007 34,7 0,2 0,1 0,1 0,2 0,2 0,5 3,1 13,9 66,9 238,3 635,7 19,6<br />
2008 32,3 0,2 0,1 0,1 0,2 0,3 0,6 3,0 13,4 59,9 209,5 607,2 18,1<br />
2009 34,4 0,0 0,1 0,1 0,2 0,2 0,6 3,0 13,9 58,2 220,4 636,7 18,7<br />
2010 33,7 0,2 0,0 0,0 0,1 0,2 0,5 2,8 12,3 55,0 209,6 611,4 17,7<br />
2011 34,0 0,0 0,0 0,0 0,1 0,2 0,4 2,7 12,3 52,7 206,3 602,4 17,3<br />
2012 36,3 0,2 0,1 0,1 0,1 0,2 0,5 2,4 12,6 52,0 219,2 629,8 17,9<br />
2013 33,0 0,0 0,0 0,0 0,2 0,1 0,3 2,3 11,8 48,8 188,8 557,4 15,9<br />
<strong>2014</strong> 33,5 0,0 0,0 0,0 0,1 0,1 0,3 2,3 11,3 47,0 193,1 543,2 15,6<br />
Enfermedad <strong>de</strong> Alzheimer (G30)<br />
2001 15,4 0,0 0,0 0,0 0,0 0,0 0,0 0,2 2,1 19,5 128,5 357,3 8,9<br />
2002 16,4 0,0 0,0 0,0 0,0 0,0 0,0 0,2 1,9 19,6 132,2 396,6 9,3<br />
2003 19,8 0,0 0,0 0,0 0,0 0,0 0,0 0,1 2,1 22,2 156,0 483,0 11,0<br />
2004 18,7 0,0 0,0 0,0 0,0 0,0 0,0 0,2 2,0 19,9 141,3 472,1 10,2<br />
2005 20,6 0,0 0,0 0,0 0,0 0,0 0,0 0,1 1,9 18,6 152,6 535,6 11,0<br />
2006 20,7 0,0 0,0 0,0 0,0 0,0 0,0 0,2 2,2 18,7 150,6 514,9 10,8<br />
2007 22,0 0,0 0,0 0,0 0,0 0,0 0,0 0,1 2,2 18,9 154,8 545,0 11,2<br />
2008 22,6 0,0 0,0 0,0 0,0 0,0 0,1 0,1 2,0 17,3 151,5 566,9 11,2<br />
2009 24,1 0,0 0,0 0,0 0,0 0,0 0,0 0,2 1,6 18,9 154,1 590,7 11,6<br />
2010 24,4 0,0 0,0 0,0 0,0 0,0 0,0 0,1 1,6 16,6 149,3 585,9 11,2<br />
2011 25,5 0,0 0,0 0,0 0,0 0,0 0,1 0,0 1,7 15,4 148,3 602,6 11,3<br />
2012 27,8 0,0 0,0 0,0 0,0 0,0 0,0 0,1 1,8 16,4 150,1 661,5 12,0<br />
2013 27,4 0,0 0,0 0,0 0,0 0,0 0,0 0,1 1,5 14,9 143,2 632,6 11,3<br />
<strong>2014</strong> 30,2 0,0 0,0 0,0 0,0 0,0 0,0 0,0 1,5 16,6 301,4 670,5 12,1<br />
Las tasas son por 100.000 habitantes <strong>en</strong> cada grupo específico<br />
28