estudio para el mejoramiento continuo de la calidad de las ...
estudio para el mejoramiento continuo de la calidad de las ...
estudio para el mejoramiento continuo de la calidad de las ...

Create successful ePaper yourself
Turn your PDF publications into a flip-book with our unique Google optimized e-Paper software.
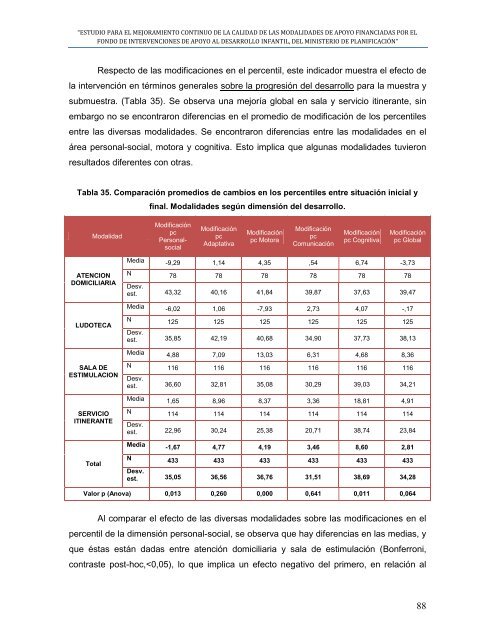
“ESTUDIO PARA EL MEJORAMIENTO CONTINUO DE LA CALIDAD DE LAS MODALIDADES DE APOYO FINANCIADAS POR ELFONDO DE INTERVENCIONES DE APOYO AL DESARROLLO INFANTIL, DEL MINISTERIO DE PLANIFICACIÓN”Respecto <strong>de</strong> <strong>la</strong>s modificaciones en <strong>el</strong> percentil, este indicador muestra <strong>el</strong> efecto d<strong>el</strong>a intervención en términos generales sobre <strong>la</strong> progresión d<strong>el</strong> <strong>de</strong>sarrollo <strong>para</strong> <strong>la</strong> muestra ysubmuestra. (Tab<strong>la</strong> 35). Se observa una mejoría global en sa<strong>la</strong> y servicio itinerante, sinembargo no se encontraron diferencias en <strong>el</strong> promedio <strong>de</strong> modificación <strong>de</strong> los percentilesentre <strong>la</strong>s diversas modalida<strong>de</strong>s. Se encontraron diferencias entre <strong>la</strong>s modalida<strong>de</strong>s en <strong>el</strong>área personal-social, motora y cognitiva. Esto implica que algunas modalida<strong>de</strong>s tuvieronresultados diferentes con otras.Tab<strong>la</strong> 35. Com<strong>para</strong>ción promedios <strong>de</strong> cambios en los percentiles entre situación inicial yfinal. Modalida<strong>de</strong>s según dimensión d<strong>el</strong> <strong>de</strong>sarrollo.ModalidadModificaciónpcPersonalsocialModificaciónpcAdaptativaModificaciónpc MotoraModificaciónpcComunicaciónModificaciónpc CognitivaModificaciónpc GlobalMedia -9,29 1,14 4,35 ,54 6,74 -3,73ATENCIONDOMICILIARIAN 78 78 78 78 78 78Desv.est. 43,32 40,16 41,84 39,87 37,63 39,47Media -6,02 1,06 -7,93 2,73 4,07 -,17LUDOTECAN 125 125 125 125 125 125Desv.est. 35,85 42,19 40,68 34,90 37,73 38,13Media 4,88 7,09 13,03 6,31 4,68 8,36SALA DEESTIMULACIONN 116 116 116 116 116 116Desv.est. 36,60 32,81 35,08 30,29 39,03 34,21Media 1,65 8,96 8,37 3,36 18,81 4,91SERVICIOITINERANTETotalN 114 114 114 114 114 114Desv.est. 22,96 30,24 25,38 20,71 38,74 23,84Media-1,67 4,77 4,19 3,46 8,60 2,81N 433 433 433 433 433 433Desv.est. 35,05 36,56 36,76 31,51 38,69 34,28Valor p (Anova) 0,013 0,260 0,000 0,641 0,011 0,064Al com<strong>para</strong>r <strong>el</strong> efecto <strong>de</strong> <strong>la</strong>s diversas modalida<strong>de</strong>s sobre <strong>la</strong>s modificaciones en <strong>el</strong>percentil <strong>de</strong> <strong>la</strong> dimensión personal-social, se observa que hay diferencias en <strong>la</strong>s medias, yque éstas están dadas entre atención domiciliaria y sa<strong>la</strong> <strong>de</strong> estimu<strong>la</strong>ción (Bonferroni,contraste post-hoc,