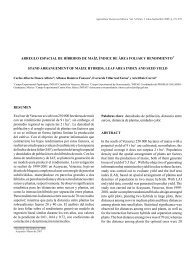
Rev. Mex. Cien. For. <strong>Vol</strong>. 2 Núm. 8varió en un intervalo <strong>de</strong> 6.7 a 64.1 cm. Esta cifra es mayor ala <strong>de</strong>terminada para A. religiosa; sin embargo, el intervalo <strong>de</strong>dimensiones <strong>de</strong> fuste cubierto en dicho estudio quizá tambiéncontribuyó a disminuir el valor <strong>de</strong> R 2 .Biomass distribution in the treeFigure 7 shows the biomass distribution of the aerial partsof the tree. In the stem is the greatest part of biomass (97%),while in branches is only stored 3% of biomass and 0.07% infoliage. This biomass distribution pattern is atypical of theshadow-tolerant species like A. religiosa. In fact, as these speciesare tolerant to shadow even in the lower branches, it is expectedthat they keep a larger proportion of biomass in these organs,compared to intolerant species.Figura 5. Mo<strong>de</strong>lo para la estimación <strong>de</strong> biomasa <strong>de</strong> ma<strong>de</strong>ra<strong>de</strong>l conjunto <strong>de</strong> ramas <strong>de</strong> árboles <strong>de</strong> Abies religiosa.Figure 5. Biomass estimation mo<strong>de</strong>l for Abies religiosa wood ofthe group of branches.Para árboles completos <strong>de</strong> A. religiosa, Avendaño et al.(2009) obtuvieron una R 2 = 0.99. Geron y Ruark (1988)estimaron una R 2 <strong>de</strong> 0.62 para biomasa <strong>de</strong> acículas en Pinusradiata D. Don. Navar et al. (2001), citan una R 2 <strong>de</strong> 0.83 parabiomasa <strong>de</strong> fuste, 0.66 para biomasa <strong>de</strong> ma<strong>de</strong>ra <strong>de</strong> ramasy 0.38 para biomasa <strong>de</strong> acículas <strong>de</strong> Pinus durangensis Ehren. yPinus cooperi Blanco. Los coeficientes <strong>de</strong> <strong>de</strong>terminaciónencontrados en estos estudios para los casos <strong>de</strong> biomasa <strong>de</strong>ma<strong>de</strong>ra <strong>de</strong> ramas y acículas son bajos, en general, coinci<strong>de</strong>ncon los aquí documentados. Para el caso <strong>de</strong> los pinos,los bajos coeficientes <strong>de</strong> <strong>de</strong>terminación para mo<strong>de</strong>los <strong>de</strong>biomasa <strong>de</strong> ma<strong>de</strong>ra <strong>de</strong> ramas y follaje pue<strong>de</strong>n respon<strong>de</strong>r ala mortalidad <strong>de</strong> ramas ocasionada por la autopoda, dado alcarácter intolerante <strong>de</strong> este grupo taxonómico; en el caso <strong>de</strong> A.religiosa, especie tolerante a la sombra, la reducida autopodano explica los bajos coeficientes <strong>de</strong> <strong>de</strong>terminación. Por lo tantosolo es atribuible a la mortalidad <strong>de</strong> ramas, que resulta <strong>de</strong>lfenómeno <strong>de</strong> <strong>de</strong>clinación, al que actualmente está sujeta estaespecie en la zona <strong>de</strong> estudio y en otros sitios <strong>de</strong>l área <strong>de</strong>su distribución natural (Alvarado-Rosales y Hernán<strong>de</strong>z-Tejeda,2002; López, 1997; Hernán<strong>de</strong>z et al., 2001).Figura 6. Mo<strong>de</strong>lo para la estimación <strong>de</strong> biomasa <strong>de</strong> acículas<strong>de</strong> árboles <strong>de</strong> Abies religiosa.Figure 6. Biomass estimation mo<strong>de</strong>l for Abies religiosa needles.Navar et al. (2001) estimated that the stem of Pinusdurangensis gathers 64 % and that of Pinus cooperi 67% ofthe total biomass of the tree, branch wood 22.5 and 22.4 %,and foliage 13.5 y 10.6%, respectively. In both species, biomassdistribution is even more extreme, compared to that obtainedfor A. religiosa.Distribución <strong>de</strong> biomasa en el árbolLa Figura 7 muestra la distribución <strong>de</strong> la biomasa en loscomponentes aéreos <strong>de</strong>l árbol. En el fuste está la mayorparte <strong>de</strong> la biomasa (97%), mientras que en las ramas solo seacumula 3% <strong>de</strong> la biomasa y en el follaje 0.07%. Este patrón<strong>de</strong> distribución <strong>de</strong> biomasa es atípico <strong>de</strong> especies tolerantesa la sombra como lo es A. religiosa. En efecto, estas especies, porsu tolerancia a la sombra, conservan, incluso ramas bajas, aúnen condiciones <strong>de</strong> sombra, por lo que la expectativa es queFigura 7. Distribución <strong>de</strong> biomasa en árboles <strong>de</strong> Abies religiosa<strong>de</strong>l Cerro Tláloc, Texcoco, Edo. <strong>de</strong> México.Figure 7. Distribution of biomass of Abies religiosa trees ofTlaloc Hill, Texcoco, Edo. <strong>de</strong> México.18
Flores-Nieves et al., Mo<strong>de</strong>los para estimación y distribución...tengan una proporción más gran<strong>de</strong> <strong>de</strong> biomasa en estosórganos, en comparación con las especies intolerantes.Para Pinus durangensis y Pinus cooperi, Navar et al. (2001)estimaron que el fuste contiene 64 y 67% <strong>de</strong> la biomasa total<strong>de</strong>l árbol, la ma<strong>de</strong>ra <strong>de</strong> ramas 22.5 y 22.4 % y el follaje 13.5y 10.6%, respectivamente. En ambas especies, la distribución<strong>de</strong> biomasa es todavía más extrema, comparada con la que seobtuvo para A. religiosa.No obstante, son congruentes con la apariencia actual<strong>de</strong>l arbolado en el área <strong>de</strong> estudio. Avendaño et al. (2009),mencionan que en los árboles <strong>de</strong> oyamel 81.3 % <strong>de</strong> la biomasase acumula en los fustes, 6.9% en ramas y 8.6 % en follaje.El valor <strong>de</strong> biomasa <strong>de</strong> ramas es similar al <strong>de</strong>terminado enel presente estudio, pero la proporción <strong>de</strong> biomasa foliar esclaramente menor. La diferencia en el patrón <strong>de</strong> distribución <strong>de</strong>biomasa, probablemente, resulta <strong>de</strong>l efecto <strong>de</strong>l fenómeno<strong>de</strong> <strong>de</strong>clinación.CONCLUSIONESLos mo<strong>de</strong>los <strong>de</strong>sarrollados en el presente estudio son aplicablesa los árboles <strong>de</strong> Abies religiosa en proceso <strong>de</strong> <strong>de</strong>clinación.La estructura <strong>de</strong> copa <strong>de</strong> los árboles <strong>de</strong> A. religiosa en dichacondición en el área <strong>de</strong> interés muestra señales <strong>de</strong> alteración.Esto aumenta la variabilidad <strong>de</strong> la biomasa <strong>de</strong> copas y dificultasu mo<strong>de</strong>lación.El patrón <strong>de</strong> distribución <strong>de</strong> biomasa en los componentesaéreos <strong>de</strong> árboles <strong>de</strong> A. religiosa en el área <strong>de</strong> estudioes atípico, en comparación con individuos sin <strong>de</strong>clinación, enrespuesta a la alta mortalidad <strong>de</strong> follaje y ramas.AGRADECIMIENTOSAl CONACYT por la beca otorgada al primer autor para sus estudios <strong>de</strong>Maestría en Ciencias y por el financiamiento a través <strong>de</strong>l proyecto 61559,2006. A la Línea Prioritaria <strong>de</strong> Investigación 8 (LPI-8) <strong>de</strong>l Colegio <strong>de</strong>Postgraduados, por el financiamiento parcial al estudio.REFERENCIASAcosta M., M., J. J. Vargas H., A. Velázquez M. y J. Etchevers B. 2002. Estimación<strong>de</strong> la biomasa aérea mediante el uso <strong>de</strong> relaciones alométricasen seis especies arbóreas en Oaxaca, México. Agrociencia. 36:725-736.Alvarado R., D., L. I. De Bauer and A. J. Galindo. 1993. Decline of sacred fir(Abies religiosa) in a forest park south of Mexico City. Environ. Pollut.80: 115–121.Alvarado-Rosales, D. and T. Hernán<strong>de</strong>z-Tejeda. 2002. Decline of Sacred-firin the Desierto <strong>de</strong> los Leones <strong>Nacional</strong> Park. In: Fenn, M. E., L. I.<strong>de</strong> Bauer, T. Hernán<strong>de</strong>z-T. (Eds.) Urban air pollution and forests.Resources at risk in the Mexico City air basin. Springer. NewYork, NY. USA. pp. 243-260.Avendaño H., D., M. Acosta M., F. Carrillo A. y J. Etchevers B. 2009. Estimación<strong>de</strong> biomasa y carbono en un bosque <strong>de</strong> Abies religiosa. FitotecniaMexicana. 32 (3): 233-238.Castellanos F., J., A. Velázquez M., J. J. Vargas H., C. Rodríguez F. y A. M. FierrosG. 1996. Producción <strong>de</strong> biomasa en un rodal <strong>de</strong> Pinus patula Schl.et Cham. Agrociencia. 30: 123-128.19Nevertheless, they are consistent with the present look of thetrees in the study area. Avendaño et al. (2009) reported thatin firs, 81.3 % of biomass is stored in the stem, 6.9% in branchesand 8.6% in foliage. The branch biomass value is similar to that<strong>de</strong>termined in the actual study, but the foliar biomass is clearlylower. The difference in the biomass distribution pattern, isprobably, the result of the effect of <strong>de</strong>cline.CONCLUSIONSThe mo<strong>de</strong>ls here presented are applicable to Abies religiosa in<strong>de</strong>cline. The crown structure of the trees in the study area bearsigns of distortion. This increases the variability of the biomass ofcrowns and makes mo<strong>de</strong>ling, difficult.The biomass distribution pattern of the aerial parts ofA. religiosa trees in the study area is atypical, compared toindividuals without <strong>de</strong>cline, as a reaction to the highmortality o foliage and branches.ACKNOWLEDGEMENTSTo CONACYT for the scholarship granted to the first author for his Master inScience studies and for the financial support provi<strong>de</strong>d to the 61559, 2006project. To the Priority Research Line No. 8 (LPI-8) of the Graduate StudiesSchool for having partially sponsored this studyEnd of the English versionCiesla, W. M. 1989. Aerial photos for assessment on forest <strong>de</strong>cline. Amultinational overview. Journal of Forestry. 87 (2): 37-41.Díaz F., R., M. Acosta M., F. Carrillo A., E. Buendía R., E. Flores A. y J. EtcheversD. 2007. Determinación <strong>de</strong> ecuaciones alométricas para estimarbiomasa y carbono en Pinus Patula Schl. et. Cham. Ma<strong>de</strong>ra yBosques 13(1): 25-34.Escandón C., J., J. B. H. J. <strong>de</strong> Jong., S. Ochoa O., I. March M. y M. A. Castillo.1999. Evaluación <strong>de</strong> dos métodos para la estimación <strong>de</strong> biomasaarbórea a través <strong>de</strong> datos LANDSAT TM en Jusnajab La Laguna,Chiapas, México: estudio <strong>de</strong> caso. Boletín <strong>de</strong>l <strong>Instituto</strong> <strong>de</strong>Geografia Núm.40: 71-84.Garcidueñas M., A. R. 1987. Producción <strong>de</strong> biomasa y acumulación <strong>de</strong>nutrientes en un rodal <strong>de</strong> Pinus montezumae Lamb. Tesis <strong>de</strong> Maestríaen Ciencias. Colegio <strong>de</strong> Postgraduados. Texcoco, Edo. <strong>de</strong> México.México. 243 p.Geron C., D. and G. Ruark A. 1988. Comparison of constant and variableallometric ratios for predicting foliar biomass of various trees ingeneral. Canadian Journal of Forestry Research. 18(10):1298-1304.Garzuglia, M. and M. Saket. 2003. Wood volume and woody biomass: reviewof FRA 2000 estimates. Forest Resources Assessment WP 68. Foodand Agriculture Organization of the United Nations. Rome. Italy.30 p.Granados S., D. y G. F. López R. 2001. Declinación forestal. Revista Chapingo.Ciencias <strong>Forestales</strong> y <strong>de</strong>l Ambiente 7(1): 5-13.Hernán<strong>de</strong>z T., T., R. M. Cox, J. Malcolm, M. L. <strong>de</strong> la Isla B, J. Vargas H., A.Velázquez M. y D. Alvarado R. 2001 Impacto <strong>de</strong>l ozono sobreel polen <strong>de</strong> Pinus hartwegii Lindl. Rev. Cien. For. en Mex. 26: 5-18.Herrera A., M. A., I. <strong>de</strong>l Valle J. y O. Alonso S. 2001. Biomasa <strong>de</strong> la vegetaciónherbácea y leñosa pequeña y necromasa en bosques tropicalesprimarios y secundarios <strong>de</strong> colombia. In: Memorias <strong>de</strong>lSimposio Internacional Medición y Monitoreo <strong>de</strong> la Captura <strong>de</strong>Carbono en Ecosistemas <strong>Forestales</strong>. Valdivia, Chile.18 p.