Carátula e Ãndice - Ministerio de Salud
Carátula e Ãndice - Ministerio de Salud
Carátula e Ãndice - Ministerio de Salud
- No tags were found...

You also want an ePaper? Increase the reach of your titles
YUMPU automatically turns print PDFs into web optimized ePapers that Google loves.
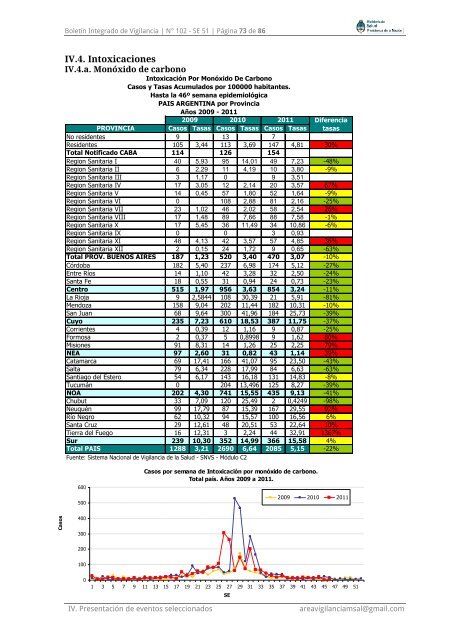
CasosBoletín Integrado <strong>de</strong> Vigilancia | N° 102 - SE 51 | Página 73 <strong>de</strong> 86IV.4. IntoxicacionesIV.4.a. Monóxido <strong>de</strong> carbonoIntoxicación Por Monóxido De CarbonoCasos y Tasas Acumulados por 100000 habitantes.Hasta la 46º semana epi<strong>de</strong>miológicaPAIS ARGENTINA por ProvinciaAños 2009 - 20112009 2010 2011 DiferenciaPROVINCIA Casos Tasas Casos Tasas Casos Tasas tasasNo resi<strong>de</strong>ntes 9 13 7Resi<strong>de</strong>ntes 105 3,44 113 3,69 147 4,81 30%Total Notificado CABA 114 126 154Region Sanitaria I 40 5,93 95 14,01 49 7,23 -48%Region Sanitaria II 6 2,29 11 4,19 10 3,80 -9%Region Sanitaria III 3 1,17 0 9 3,51Region Sanitaria IV 17 3,05 12 2,14 20 3,57 67%Region Sanitaria V 14 0,45 57 1,80 52 1,64 -9%Region Sanitaria VI 0 108 2,88 81 2,16 -25%Region Sanitaria VII 23 1,02 46 2,02 58 2,54 26%Region Sanitaria VIII 17 1,48 89 7,66 88 7,58 -1%Region Sanitaria X 17 5,45 36 11,49 34 10,86 -6%Region Sanitaria IX 0 0 3 0,93Region Sanitaria XI 48 4,13 42 3,57 57 4,85 36%Region Sanitaria XII 2 0,15 24 1,72 9 0,65 -63%Total PROV. BUENOS AIRES 187 1,23 520 3,40 470 3,07 -10%Córdoba 182 5,40 237 6,98 174 5,12 -27%Entre Ríos 14 1,10 42 3,28 32 2,50 -24%Santa Fe 18 0,55 31 0,94 24 0,73 -23%Centro 515 1,97 956 3,63 854 3,24 -11%La Rioja 9 2,5844 108 30,39 21 5,91 -81%Mendoza 158 9,04 202 11,44 182 10,31 -10%San Juan 68 9,64 300 41,96 184 25,73 -39%Cuyo 235 7,23 610 18,53 387 11,75 -37%Corrientes 4 0,39 12 1,16 9 0,87 -25%Formosa 2 0,37 5 0,8998 9 1,62 80%Misiones 91 8,31 14 1,26 25 2,25 79%NEA 97 2,60 31 0,82 43 1,14 39%Catamarca 69 17,41 166 41,07 95 23,50 -43%Salta 79 6,34 228 17,99 84 6,63 -63%Santiago <strong>de</strong>l Estero 54 6,17 143 16,18 131 14,83 -8%Tucumán 0 204 13,496 125 8,27 -39%NOA 202 4,30 741 15,55 435 9,13 -41%Chubut 33 7,09 120 25,49 2 0,4249 -98%Neuquén 99 17,79 87 15,39 167 29,55 92%Río Negro 62 10,32 94 15,57 100 16,56 6%Santa Cruz 29 12,61 48 20,51 53 22,64 10%Tierra <strong>de</strong>l Fuego 16 12,31 3 2,24 44 32,91 1367%Sur 239 10,30 352 14,99 366 15,58 4%Total PAIS 1288 3,21 2690 6,64 2085 5,15 -22%Fuente: Sistema Nacional <strong>de</strong> Vigilancia <strong>de</strong> la <strong>Salud</strong> - SNVS - Módulo C2600500Casos por semana <strong>de</strong> Intoxicación por monóxido <strong>de</strong> carbono.Total país. Años 2009 a 2011.2009 2010 201140030020010001 3 5 7 9 11 13 15 17 19 21 23 25 27 29 31 33 35 37 39 41 43 45 47 49 51SEIV. Presentación <strong>de</strong> eventos seleccionadosareavigilanciamsal@gmail.com