- Page 1 and 2:
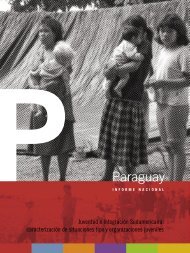
Informe NacionalParaguayENCUESTA DE
- Page 3 and 4:
ÍNDICE4 Presentación7 Un cambio t
- Page 5 and 6:
organizados, así como del mundo ad
- Page 7 and 8:
1Un cambio trascendental enel Parag
- Page 9 and 10:
vindicando el socialismo -con proye
- Page 11 and 12:
la actualidad, se produjeron movili
- Page 13 and 14:
te a las denuncias de delitos ecol
- Page 15 and 16:
dablemente facilitadas por el régi
- Page 17 and 18:
12Características generalesde los
- Page 19 and 20:
sectores censales 5 , con PPT (Prob
- Page 21 and 22:
Se consideró que quien aporta la m
- Page 23 and 24:
El nivel de analfabetismo absoluto
- Page 25 and 26:
Tanto el desempleo abierto como el
- Page 27 and 28:
El sub-empleo en este sentido, afec
- Page 29 and 30:
33.000 personas, lo que equivale a
- Page 31 and 32:
13¿Juventud o juventudes?Acerca de
- Page 33 and 34:
Autoimagen según grupo de edadTota
- Page 35 and 36:
Esta mayor presencia del sentimient
- Page 37 and 38:
joven, pues el 14.4% de la escala m
- Page 39 and 40:
Opinión acerca del “deber ser”
- Page 41 and 42:
En efecto, al considerar a quienes
- Page 43 and 44:
Varones y mujeres casi coinciden (6
- Page 45 and 46:
La parábola educativaYa dentro de
- Page 47 and 48:
Considerando siempre la levedad de
- Page 49 and 50:
peligrosos”, con variaciones que
- Page 51 and 52:
que no las ignora, sino que las con
- Page 53 and 54:
Esto último se ve en las columnas
- Page 55 and 56:
Si el reflejo es positivo, es porqu
- Page 57 and 58:
la trayectoria educativa, más fuer
- Page 59 and 60:
¿Los jóvenes de hoy son “ecoló
- Page 61 and 62:
Se apela a la creatividad y a la fu
- Page 63 and 64:
ma columna, hicieron hasta el 5° g
- Page 65 and 66:
El otro accionar de lucha en el cam
- Page 67 and 68:
De modo particular, la franja de 18
- Page 69 and 70:
Nivel de escolaridadEl comportamien
- Page 71 and 72:
Por su parte, en los encuestados qu
- Page 73 and 74:
Nivel de adhesión a la demanda por
- Page 75 and 76:
Por último, la “disconformidad h
- Page 77 and 78:
existen canales públicos de televi
- Page 79 and 80:
Porcentaje de población que accede
- Page 81 and 82:
15Valores, sociabilidad yparticipac
- Page 83 and 84:
“No veo problemas en que un/a pro
- Page 85 and 86:
“Los hombres tienen que ocuparse
- Page 87 and 88:
Grado de acuerdo con la legalizaci
- Page 89 and 90:
i. Valores sociales o políticosLue
- Page 91 and 92:
¿Qué crees que es lo más importa
- Page 93 and 94:
¿De qué depende el cambio en el p
- Page 95 and 96:
La ventaja del discurso de la corru
- Page 97 and 98:
La diferencia entre la participaci
- Page 99 and 100: Por otra parte, los partidos polít
- Page 101 and 102: En términos generales, se encontr
- Page 103 and 104: También existe una curiosa relaci
- Page 105 and 106: Acuerdo con la frase sobre las TICs
- Page 107 and 108: autoritaria, como el reclamo por ma
- Page 109 and 110: Casi la mitad (48.4%) de las person
- Page 111 and 112: La experiencia es la cualidad más
- Page 113 and 114: Ha sentido ocasionalmente o siempre
- Page 115 and 116: Discriminado/a por el lugar donde v
- Page 117 and 118: Discriminado/a por su edad según s
- Page 119 and 120: Conocimiento y participación en gr
- Page 121 and 122: 6.8 Actividades que precisan de apo
- Page 123 and 124: 17Percepciones acerca de lasPolíti
- Page 125 and 126: Percepción del posicionamiento del
- Page 127 and 128: Escolaridad y renta per cápitaCons
- Page 129 and 130: Más del 85% de los encuestados -ex
- Page 131 and 132: En el siguiente Cuadro -donde cuant
- Page 133 and 134: Como ya fue planteado por grupos ju
- Page 135 and 136: El “acceso a los bienes culturale
- Page 137 and 138: estuvo en ese país, sólo el 2.4%
- Page 139 and 140: El porcentaje de personas que indic
- Page 141 and 142: 19Comentarios finalesEn la investig
- Page 143 and 144: Las hipótesis orientadoras de la i
- Page 145 and 146: Es sugestivo cómo al estar general
- Page 147 and 148: Para finalizar…La impresión gene
- Page 149: 1 BibliografíaArendt, Hannah (1996
- Page 153: Provincia (Región) 18 a 29añosVar