Product innovation: An empirical study into the impact of simultaneous engineering on new product quality90 lity given that it <strong>de</strong>termines the capacity of the company to <strong>de</strong>velop a new product whichis capable of satisfying the needs of the consumer (Minguela-Rata, 2002). It was felt thatboth aspects were important, since, as Minguela-Rata (2002) show, quality specificationsset by the company as targets to be met are not necessarily i<strong>de</strong>ntical to customer needs orexpectations. Cronbach’s alpha measured 0.8150. The greater the value returned by theseitems, the higher the level of quality.Control variable: <strong>de</strong>gree of product innovationThere is a lack of agreement in the literature about the most suitable environment in whichto apply simultaneous engineering when <strong>de</strong>veloping new products. Some writers recommendrestricting this method to low risk environments (e.g. Cor<strong>de</strong>ro, 1991; Lincke, 1995;Terwiesch and Loch, 1999), since simultaneous engineering in radical innovation can generatea series of hid<strong>de</strong>n costs. Attempting to carry out new product <strong>de</strong>velopment processesin the fastest possible way causes a rise in unexpected errors and inefficiencies which inturn leads to longer <strong>de</strong>velopment and <strong>de</strong>livery times (Crawford, 1992).This lack of agreement seems to arise in those cases where speed to market is the mostimportant factor, but it does not appear when we attempt to analyze the level of quality ofthe finished product. Nevertheless, it was <strong>de</strong>ci<strong>de</strong>d to inclu<strong>de</strong> the <strong>de</strong>gree of product innovationas a control variable in or<strong>de</strong>r to check whether results might be distorted.For this purpose, respon<strong>de</strong>nts are asked to <strong>de</strong>scribe the type of product in question interms of the <strong>de</strong>gree of originality for the company and the market. With this information, weinclu<strong>de</strong> a dummy variable in the mo<strong>de</strong>l (INNV) representing the type of innovation in such away that a value of 1 indicates radical innovation -completely new products for both companyand market (Booz et al., 1982; Griffin, 1997; Avlonitis et al., 2001; Garcia and Calantone,2002; Minguela-Rata, 2002; Salomo et al., 2007; Verworn et al., 2008; Rein<strong>de</strong>rs et al.,2010)-, while a value of 0 reflects incremental innovation -reduction of costs, repositioningin the market and product modification (Booz et al., 1982; Kleinschmidt and Cooper, 1991;Ali, 1994; Griffin, 1997; Minguela-Rata, 2002; Verworn et al., 2008)-. Table 2 shows the distributionof the <strong>de</strong>gree of product innovation.Table 2. Response distribution according to product innovation <strong>de</strong>greeINNOVATION DEGREE FREQUENCY PERCENTAGE (%)Radical Innovation 22 51.2%Incremental Innovation 21 48.8%Total 43 100.0%A <strong>de</strong>scription of the variables used in the study as well their typology is shown as a summaryin Table 3. Having <strong>de</strong>fined the variables un<strong>de</strong>r investigation, the mo<strong>de</strong>l to be analyzedcan be summarized in the following way:QUALITY = β 0+ β 1TEAM + β 2CWF + β 3EARLYNVL + β 4INNV + ε<strong>GCG</strong> GEORGETOWN UNIVERSITY - UNIVERSIA SEPTIEMBRE-DICIEMBRE 2011 VOL. 5 NUM. 3 ISSN: 1988-7116pp: 80-101
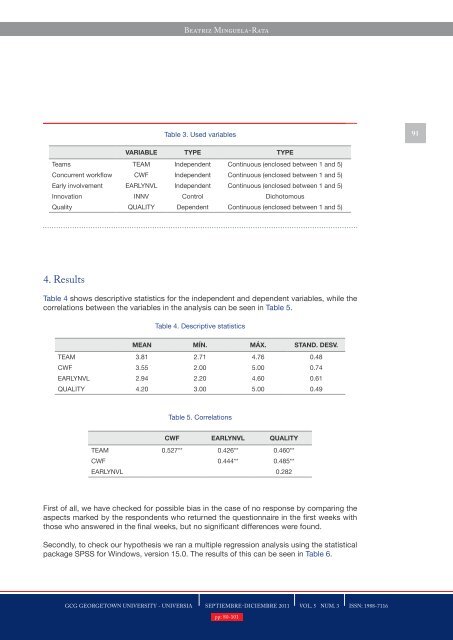
Beatriz Minguela-RataTable 3. Used variables91VARIABLE TYPE TYPETeams TEAM In<strong>de</strong>pen<strong>de</strong>nt Continuous (enclosed between 1 and 5)Concurrent workflow CWF In<strong>de</strong>pen<strong>de</strong>nt Continuous (enclosed between 1 and 5)Early involvement EARLYNVL In<strong>de</strong>pen<strong>de</strong>nt Continuous (enclosed between 1 and 5)Innovation INNV Control DichotomousQuality QUALITY Depen<strong>de</strong>nt Continuous (enclosed between 1 and 5)4. ResultsTable 4 shows <strong>de</strong>scriptive statistics for the in<strong>de</strong>pen<strong>de</strong>nt and <strong>de</strong>pen<strong>de</strong>nt variables, while thecorrelations between the variables in the analysis can be seen in Table 5.Table 4. Descriptive statisticsMEAN MÍN. MÁX. STAND. DESV.TEAM 3.81 2.71 4.76 0.48CWF 3.55 2.00 5.00 0.74EARLYNVL 2.94 2.20 4.60 0.61QUALITY 4.20 3.00 5.00 0.49Table 5. CorrelationsCWF EARLYNVL QUALITYTEAM 0.527** 0.426** 0.460**CWF 0.444** 0.485**EARLYNVL 0.282First of all, we have checked for possible bias in the case of no response by comparing theaspects marked by the respon<strong>de</strong>nts who returned the questionnaire in the first weeks withthose who answered in the final weeks, but no significant differences were found.Secondly, to check our hypothesis we ran a multiple regression analysis using the statisticalpackage SPSS for Windows, version 15.0. The results of this can be seen in Table 6.<strong>GCG</strong> GEORGETOWN UNIVERSITY - UNIVERSIA SEPTIEMBRE-DICIEMBRE 2011 VOL. 5 NUM. 3 ISSN: 1988-7116pp: 80-101