You also want an ePaper? Increase the reach of your titles
YUMPU automatically turns print PDFs into web optimized ePapers that Google loves.
� � � �<br />
Referencias Sectoriales<br />
Galicia´09<br />
� � �<br />
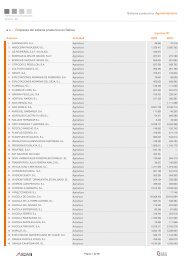
Empresas <strong>de</strong>l sector en GALICIA 2006 2007<br />
<strong>Trabajo</strong> <strong>de</strong> <strong>la</strong> <strong>piedra</strong><br />
Sistema Productivo: Rocas ornamentales<br />
1 GRANINTER, S.A. 61.365.001 — —<br />
2 G.I. GRANITOS IBERICOS, S.A. 25.785.998 30.504.003 18,30%<br />
3 INGEMARGA, S.A. 26.684.943 26.470.641 -0,80%<br />
4 RAMILO, S.A. 23.258.069 25.190.893 8,31%<br />
5 ROCAS EUROPEAS DE CONSTRUCCION, S.A. 19.303.277 25.066.682 29,86%<br />
6 GRUPIMAR, S.L. 21.396.367 18.191.669 -14,98%<br />
7 PRIVILEGE ADVANCED SURFACES, S.A. 14.213.714 17.865.980 25,70%<br />
8 EURO-ROCA, S.A. 13.679.456 17.182.065 25,60%<br />
9 GRANITOS DEL LOURO, S.A. 10.787.248 16.219.327 50,36%<br />
10 GRANITOS DE ATIOS, S.A. 13.812.045 15.098.764 9,32%<br />
11 EURO CKP, S.A. 11.819.264 12.605.442 6,65%<br />
12 GRANITOS CABALEIRO, S.A. 8.834.926 9.407.691 6,48%<br />
13 GRALICIA PEDRAS ELABORADAS, S.L. 7.827.377 9.263.592 18,35%<br />
14 GRANIMONDI, S.A. 8.309.107 7.605.550 -8,47%<br />
15 FERLOSA, S.L. 7.470.166 — —<br />
16 GRAMOL, S.A. 7.238.902 7.294.298 0,77%<br />
17 GRANIPEC ESPAÑA, S.L. 5.620.413 6.887.076 22,54%<br />
18 GRANITOS DE GALICIA, S.A. 6.954.654 6.212.121 -10,68%<br />
19 GRANITESA, S.A. 6.024.365 — —<br />
20 GRANITOS MONTE FARO, S.A. 5.624.680 5.935.337 5,52%<br />
Nº <strong>de</strong> empresas <strong>de</strong>l sector en Galicia: 188<br />
Ingresos (€)<br />
Tasa <strong>de</strong> variación<br />
Empresas <strong>de</strong>l sector en ESPAÑA 2006 2007 2007/2006<br />
1 COSENTINO, S.A. 250.657.874 275.829.571 10,04%<br />
2 MARMOL COMPAC, S.A. 59.753.002 74.556.760 24,77%<br />
3 GRANINTER, S.A. 61.365.001 — —<br />
4 TIERRA ATOMIZADA, S.A. 45.925.733 54.118.988 17,84%<br />
5 INGEMAR, S.A. 51.940.313 — —<br />
Nº <strong>de</strong> empresas <strong>de</strong>l sector en España: 351<br />
� � �<br />
Principales empresas en ingresos <strong>de</strong> explotación<br />
Ingresos (€)<br />
Estructura <strong>de</strong> <strong>la</strong>s empresas <strong>de</strong>l sector en función <strong>de</strong> los ingresos<br />
Galicia España<br />
13,3%<br />
5,3%<br />
0,0%<br />
81,4%<br />
29,6%<br />
0,9%<br />
5,1%<br />
64,4%<br />
Microempresas (hasta 2 millones €)<br />
Resto <strong>de</strong> Pequeñas empresas (entre 2 y 10 mill. €)<br />
Medianas empresas (entre 10 y 50 millones €)<br />
Gran<strong>de</strong>s empresas (más <strong>de</strong> 50 millones €)<br />
Tasa <strong>de</strong> variación<br />
2007/2006<br />
Fuente ARDÁN. Los datos reflejados en los gráficos correspon<strong>de</strong>n al ejercicio 2007
� � � �<br />
Referencias Sectoriales<br />
Galicia´09<br />
� � � Ingresos, costes y resultados. Inversión y financiación<br />
Actividad<br />
<strong>Trabajo</strong> <strong>de</strong> <strong>la</strong> <strong>piedra</strong><br />
Sistema Productivo: Rocas ornamentales<br />
Crecimiento ingresos explotación 5,30% 5,86% 37,13% MARMOLERIA LA MANSION, S.L.<br />
Crecimiento <strong>de</strong>l valor añadido 2,07% 3,32% 30,04% PIEDRAS QUINTELA, S.L.<br />
Crecimiento <strong>de</strong>l resultado <strong>de</strong> explotación 4,26% 6,34% 175,51% OUSINDE, S.L.<br />
Gastos personal / ingresos explotación 31,26% 28,01% 13,82% XIARA MARMOLES Y GRANITOS, S.L.<br />
Margen <strong>de</strong> explotación 3,19% 3,42% 7,96% MARMOLERIA CHANTADA, S.L.<br />
Gastos financieros / ingresos explotación 1,22% 1,33% 0,11% MARMOLES BERTAMIRANS, S.L.<br />
Resultado ejercicio / ingresos explotación 1,55%<br />
medianas<br />
1,63% 5,77% MARMOLES ALVAREZ CAMPOSANCOS, S.L.<br />
Estructura<br />
Activo circu<strong>la</strong>nte / activo total 60,65% 62,19% 92,42% MARMOLES Y GRANITOS GRANDE, S.L.<br />
Recursos propios / recursos totales 27,74% 31,20% 64,06% BAÑOS Y MATERIALES, S.A.<br />
Liqui<strong>de</strong>z<br />
8,0%<br />
6,0%<br />
4,0%<br />
2,0%<br />
0,0%<br />
Liqui<strong>de</strong>z general 1,08 1,18 2,23 MARMOLES ALVAREZ CAMPOSANCOS, S.L.<br />
Solvencia 1,36 1,44 2,67 GONZALEZ Y UCHA, S.L.<br />
Fondo rotación / ingresos explotación 3,46% 7,21% 34,39% GALICORTE, S.L.<br />
Fortaleza financiera<br />
Crecimiento <strong>de</strong>l valor añadido<br />
6,99%<br />
6,42% 6,78% 6,83%<br />
3,32%<br />
2,07%<br />
2005 2006 2007<br />
Sector<br />
Galicia<br />
En<strong>de</strong>udamiento 2,49 2,10 0,56 BAÑOS Y MATERIALES, S.A.<br />
Cash flow / <strong>de</strong>uda total 10,00% 10,60% 30,44% PIEDRAS RABAL, S.L.<br />
Recursos ajenos / recursos totales 72,27% 68,27% 36,73% GRABADOS R S, S.L.<br />
63,0%<br />
62,0%<br />
61,0%<br />
60,0%<br />
59,0%<br />
3,00<br />
2,50<br />
2,00<br />
1,50<br />
1,00<br />
0,50<br />
0,00<br />
Activo circu<strong>la</strong>nte / activo total<br />
62,60% 62,53%<br />
62,05%<br />
2,30<br />
60,56%<br />
60,65%<br />
2005 2006 2007<br />
62,19%<br />
2005 2006 2007<br />
medianas<br />
Sector<br />
España<br />
3,5%<br />
3,4%<br />
3,3%<br />
3,2%<br />
3,1%<br />
3,0%<br />
1,50<br />
1,45<br />
1,40<br />
1,35<br />
1,30<br />
3,23%<br />
Sector Galicia (mediana) Sector España (mediana)<br />
Empresa lí<strong>de</strong>r en el sector <strong>de</strong> Galicia<br />
Valor Razón social<br />
1,37<br />
3,37%<br />
Sector Galicia (mediana) Sector España (mediana)<br />
Sector<br />
Galicia<br />
Sector<br />
España<br />
3,3%<br />
3,2%<br />
3,1%<br />
3,0%<br />
Margen <strong>de</strong> explotación<br />
3,24%<br />
3,39%<br />
3,19%<br />
2005 2006 2007<br />
Empresa lí<strong>de</strong>r en el sector <strong>de</strong> Galicia<br />
Valor Razón social<br />
1,35<br />
3,42%<br />
1,45 1,44 1,44<br />
Fuente ARDÁN. Los datos económicos reflejados en <strong>la</strong>s tab<strong>la</strong>s correspon<strong>de</strong>n al ejercicio 2007<br />
1,36<br />
2005 2006 2007<br />
En<strong>de</strong>udamiento Recursos ajenos / recursos totales<br />
2,04<br />
2,53<br />
2,11<br />
2,49<br />
2,10<br />
3,5%<br />
3,4%<br />
3,37%<br />
3,39%<br />
3,23% 3,24%<br />
Solvencia<br />
3,19%<br />
2005 2006 2007<br />
3,42%
� � � �<br />
Referencias Sectoriales<br />
Galicia´09<br />
� � �<br />
Rentabilidad económica 4,44% 4,58% 10,86% MARCOL SARRIA, S.L.<br />
<strong>Trabajo</strong> <strong>de</strong> <strong>la</strong> <strong>piedra</strong><br />
Sistema Productivo: Rocas ornamentales<br />
Margen 3,64% 3,94% 8,85% MARMOLES ALVAREZ CAMPOSANCOS, S.L.<br />
Rotación <strong>de</strong> activos 1,19 1,18 2,21 LAUBRADA, S.L.<br />
Rentabilidad financiera 6,76% 7,21% 22,52% GRANIMON, S.L.<br />
Coste neto <strong>de</strong> <strong>la</strong> <strong>de</strong>uda 2,11% 2,33% 0,05% ESCULTURAS Y LABORES GRANITO ROSALES, SL<br />
Apa<strong>la</strong>ncamiento financiero 0,02<br />
medianas<br />
0,02 0,09 SUMINISTROS BAMACO, S.L.<br />
� � �<br />
Rentabilidad y variables asociadas<br />
4,7%<br />
4,6%<br />
4,5%<br />
4,4%<br />
4,3%<br />
4,2%<br />
4,1%<br />
4,0%<br />
4,0%<br />
3,9%<br />
3,8%<br />
3,7%<br />
3,6%<br />
3,5%<br />
3,4%<br />
4,65%<br />
3,62%<br />
Rentabilidad económica Rentabilidad financiera<br />
4,56%<br />
4,27%<br />
4,34%<br />
4,44%<br />
2005 2006 2007<br />
3,91%<br />
Margen<br />
3,72%<br />
3,87%<br />
3,64%<br />
2005 2006 2007<br />
Productividad y empleo<br />
Ingresos explotación por empleado (€) 64.546 79.890 162.093 GRAMOL, S.A.<br />
Valor añadido por empleado (€) 25.547 28.841 43.892 PIEDRAS QUINTELA, S.L.<br />
Coste medio <strong>de</strong>l empleo (€) 20.332 21.808 16.348 GRANITOS SAYCRES, S.A.L.<br />
Nº empleados por empresa 10 12 42 SOYNACI, S.L.<br />
medianas<br />
100.000<br />
80.000<br />
60.000<br />
40.000<br />
20.000<br />
0<br />
53.896<br />
66.108<br />
58.070<br />
71.755<br />
Sector<br />
Galicia<br />
64.546<br />
2005 2006 2007<br />
4,58%<br />
79.890<br />
3,94%<br />
Sector<br />
España<br />
8,5%<br />
8,0%<br />
7,5%<br />
7,0%<br />
6,5%<br />
6,0%<br />
1,26<br />
1,24<br />
1,22<br />
1,20<br />
1,18<br />
1,16<br />
1,14<br />
7,95%<br />
1,23<br />
7,19%<br />
7,52%<br />
7,40%<br />
6,76%<br />
2005 2006 2007<br />
1,21<br />
Sector Galicia (mediana) Sector España (mediana)<br />
Sector<br />
Galicia<br />
Sector<br />
España<br />
25.000<br />
20.000<br />
15.000<br />
10.000<br />
5.000<br />
0<br />
Rotación <strong>de</strong> activos<br />
1,24<br />
7,21%<br />
Fuente ARDÁN. Los datos económicos reflejados en <strong>la</strong>s tab<strong>la</strong>s correspon<strong>de</strong>n al ejercicio 2007<br />
1,19<br />
1,19<br />
2005 2006 2007<br />
Ingresos por empleado Coste medio <strong>de</strong>l empleo<br />
18.063<br />
19.864<br />
Sector Galicia (mediana) Sector España (mediana)<br />
Empresa lí<strong>de</strong>r en el sector <strong>de</strong> Galicia<br />
Valor Razón social<br />
Empresa lí<strong>de</strong>r en el sector <strong>de</strong> Galicia<br />
Valor Razón social<br />
19.449<br />
20.993<br />
20.332<br />
1,18<br />
21.808<br />
Fuente: ARDÁN<br />
2005 2006 2007