2.4.6 Las empresas de alta productividad - Ardan
2.4.6 Las empresas de alta productividad - Ardan
2.4.6 Las empresas de alta productividad - Ardan
You also want an ePaper? Increase the reach of your titles
YUMPU automatically turns print PDFs into web optimized ePapers that Google loves.
<strong>2.4.6</strong> LAS EMPRESAS DE ALTA PRODUCTIVIDAD.<br />
229<br />
A. Significado <strong>de</strong> empresa <strong>de</strong> <strong>alta</strong> <strong>productividad</strong> <strong>de</strong> los recursos humanos.<br />
Des<strong>de</strong> principios <strong>de</strong>l siglo pasado la <strong>productividad</strong> se ha multiplicado por más <strong>de</strong> 40. Este aumento <strong>de</strong> la<br />
<strong>productividad</strong> ha sido la causa fundamental <strong>de</strong>l nivel <strong>de</strong> <strong>de</strong>sarrollo <strong>de</strong> la población occi<strong>de</strong>ntal, <strong>de</strong> la consolidación<br />
<strong>de</strong> una clase media po<strong>de</strong>rosa con un elevado po<strong>de</strong>r adquisitivo y, sobre todo, con servicios indispensables como<br />
la educación y la salud, que han elevado notablemente el nivel <strong>de</strong> vida y bienestar.<br />
La <strong>productividad</strong> en las <strong>empresas</strong> es, por ello, un aspecto que nos parece relevante y, por supuesto, merecedor <strong>de</strong><br />
un estudio serio y profundo. Nuestro análisis, en esta sección, se va a centrar en la <strong>productividad</strong> <strong>de</strong> los recursos<br />
humanos, medida a través <strong>de</strong>l valor añadido bruto generado por empleado, parámetro éste que, a nuestro juicio,<br />
es una medida bastante razonable <strong>de</strong> la <strong>productividad</strong> <strong>de</strong>l factor humano. La concentración en el corazón <strong>de</strong>l<br />
negocio y la externalización <strong>de</strong> activida<strong>de</strong>s no esenciales influyen en el incremento <strong>de</strong> la <strong>productividad</strong> <strong>de</strong>l factor<br />
humano.<br />
Dentro <strong>de</strong>l análisis <strong>de</strong> rasgos hemos incorporado el calificador <strong>de</strong> empresa <strong>de</strong> <strong>alta</strong> <strong>productividad</strong>, puesto que<br />
estamos convencidos <strong>de</strong> que las <strong>empresas</strong> que se concentren en la <strong>productividad</strong> obtendrán, casi seguro, una<br />
sólida ventaja competitiva. No <strong>de</strong>bemos olvidar que gran parte <strong>de</strong> la <strong>productividad</strong> proviene <strong>de</strong> dos fuentes clave:<br />
el nivel <strong>de</strong> innovación y las capacida<strong>de</strong>s organizativas.<br />
En <strong>de</strong>finitiva, <strong>de</strong>finimos como empresa <strong>de</strong> <strong>alta</strong> <strong>productividad</strong> <strong>de</strong> los recursos humanos aquella que tiene un valor<br />
añadido por empleado 1 por encima <strong>de</strong>l percentil 75 (P 75 ) <strong>de</strong>l gran sector en el que opera durante los tres años<br />
consecutivos <strong>de</strong>l período <strong>de</strong> análisis. Es <strong>de</strong>cir, en ningún año, la empresa <strong>de</strong> <strong>alta</strong> <strong>productividad</strong> <strong>de</strong>be generar un<br />
valor añadido por empleado por <strong>de</strong>bajo <strong>de</strong> las cifras expresadas en la tabla siguiente, siempre relacionadas con su<br />
sector en Galicia.<br />
Valor <strong>de</strong>l Percentil (P 75 ) para la variable<br />
Valor añadido bruto por empleado<br />
datos en unida<strong>de</strong>s <strong>de</strong> euro<br />
2002 2003 2004<br />
Agricultura, silvicultura, gana<strong>de</strong>ría y pesca 42.159 42.043 44.487<br />
Minería 39.841 41.590 43.081<br />
Transportes, comunicaciones y servicios públicos 39.945 40.928 42.790<br />
Mayoristas 34.650 36.200 38.029<br />
Servicios 34.690 35.308 37.430<br />
Construcción 32.604 34.005 37.267<br />
Fabricantes 32.713 33.614 34.631<br />
Detallistas 26.924 27.770 29.045<br />
Ilustración 2.4.22. Valor <strong>de</strong>l P 75 para el valor añadido bruto por empleado (período 2002-2004).<br />
Otra condición para que a la empresa se le otorgue el apellido <strong>de</strong> <strong>alta</strong> <strong>productividad</strong> en los recursos humanos es<br />
que el citado valor añadido por empleado crezca al menos un 10% durante cada uno <strong>de</strong> los tres años <strong>de</strong> estudio.<br />
Con ambas condiciones la <strong>de</strong>finición es la siguiente:<br />
EMPRESA DE ALTA PRODUCTIVIDAD ES AQUELLA QUE DURANTE TRES AÑOS CONSECUTIVOS OBTIENE UN VALOR<br />
AÑADIDO BRUTO POR EMPLEADO DENTRO DEL 25% DE LOS MEJORES VALORES DEL GRAN SECTOR Y ESTE VALOR<br />
CRECE POR ENCIMA DEL 10%, DURANTE CADA UNO DE LOS TRES AÑOS CONSECUTIVOS DEL PERÍODO DE ESTUDIO.<br />
En <strong>de</strong>finitiva, son fuertes restricciones que posibilitan conocer qué <strong>empresas</strong> consiguen una elevada <strong>productividad</strong><br />
<strong>de</strong> los recursos humanos y, por lo tanto, <strong>empresas</strong> sobre las que probablemente se están <strong>de</strong>sarrollando ventajas<br />
competitivas relevantes.<br />
1<br />
El número <strong>de</strong> empleados es el que <strong>de</strong>clara la empresa. En líneas generales, el número <strong>de</strong> empleados equivale a empleados a tiempo<br />
completo-año. Otro aspecto a <strong>de</strong>stacar en la influencia <strong>de</strong> la <strong>productividad</strong> <strong>de</strong>l trabajo tiene que ver con la externalización <strong>de</strong> activida<strong>de</strong>s por<br />
parte <strong>de</strong> la empresa.<br />
RASGOS DE COMPETITIVIDAD<br />
Informe económico-financiero y <strong>de</strong> la competitividad. Galicia 2006
230<br />
B. <strong>Las</strong> <strong>empresas</strong> <strong>de</strong> <strong>alta</strong> <strong>productividad</strong> en Galicia.<br />
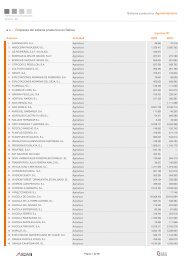
A continuación, se ofrece la relación <strong>de</strong> <strong>empresas</strong> <strong>de</strong> <strong>alta</strong> <strong>productividad</strong> extraídas <strong>de</strong> la muestra 2 <strong>de</strong> <strong>empresas</strong><br />
reflejadas en este informe. Tan sólo un 1,45% <strong>de</strong>l total <strong>de</strong> las <strong>empresas</strong> alcanzan este nivel. En total, resultan 189 las<br />
que cumplen estos requisitos y se han or<strong>de</strong>nado en función <strong>de</strong> sus ingresos <strong>de</strong> explotación, indicándose a<strong>de</strong>más el<br />
sector SIC en el que <strong>de</strong>sarrollan su actividad 3 :<br />
Ingresos VABcf./empleado<br />
(en unida<strong>de</strong>s <strong>de</strong> euro)<br />
Tasas <strong>de</strong><br />
variación<br />
EMPRESA GRAN SECTOR 2004 2002 2003 2004 03/02 04/03<br />
1 METALURGICA GALAICA, S.A. FABRICANTES 574.196.699 751.791 828.778 1.294.548 10,24% 56,20%<br />
2 GRUPO MASSIMO DUTTI, S.A. DETALLISTAS 450.400.803 54.547 66.483 74.334 21,88% 11,81%<br />
Grupo: INDUSTRIA DE DISEÑO TEXTIL, S.A.<br />
3 PESCANOVA, S.A. MAYORISTAS 218.688.429 63.813 94.037 106.466 47,36% 13,22%<br />
Grupo: PESCANOVA, S.A.<br />
4 GOA-INVEST, S.A. CONSTRUCCION 203.003.276 87.501 113.260 138.314 29,44% 22,12%<br />
Grupo: INDUSTRIA DE DISEÑO TEXTIL, S.A.<br />
5 SIDERURGICA AÑON, S.A. MAYORISTAS 185.208.395 104.258 152.999 313.501 46,75% 104,90%<br />
6 INDIPUNT, S.L. FABRICANTES 146.412.204 62.819 75.269 114.648 19,82% 52,32%<br />
Grupo: INDUSTRIA DE DISEÑO TEXTIL, S.A.<br />
7 SGL CARBON, S.A. FABRICANTES 95.820.550 152.652 187.886 230.169 23,08% 22,50%<br />
8 BIOETANOL GALICIA, S.A. FABRICANTES 93.432.200 43.133 149.143 245.887 245,78% 64,87%<br />
9 RODMAN POLYSHIPS, S.A. FABRICANTES 88.668.650 36.043 44.813 60.236 24,33% 34,42%<br />
10 STEAR, S.A. FABRICANTES 76.717.476 49.068 59.258 68.625 20,77% 15,81%<br />
Grupo: INDUSTRIA DE DISEÑO TEXTIL, S.A.<br />
11 IBERDROLA ENER. RENOVABLES DE GALICIA,SA TRANSPORTES, COMUNICACIONES Y SERV. PUBLICOS 67.761.999 9.541.999 13.785.000 57.324.997 44,47% 315,85%<br />
12 FIN-EXPORT 96, S.L. MAYORISTAS 35.208.738 54.241 112.559 186.553 107,51% 65,74%<br />
13 CONSTRUCCIONES TABOADA Y RAMOS, S.L. CONSTRUCCION 34.034.594 38.593 43.448 64.960 12,58% 49,51%<br />
14 NORDES INSTALACIONES, S.A. CONSTRUCCION 32.467.617 52.045 63.591 97.256 22,19% 52,94%<br />
15 SAMPER - REFEINSA GALICIA, S.L. MAYORISTAS 32.050.786 60.305 79.440 111.760 31,73% 40,68%<br />
16 GALLEGA DE MALLAS, S.L. FABRICANTES 31.917.914 47.865 103.061 145.576 115,32% 41,25%<br />
17 MOPAVI, S.L. DETALLISTAS 31.897.107 31.399 38.259 52.681 21,85% 37,69%<br />
18 CAAMAÑO SISTEMAS METALICOS, S.L. FABRICANTES 29.626.844 115.988 129.307 152.828 11,48% 18,19%<br />
19 ESPINA & DELFIN, S.L. CONSTRUCCION 29.430.018 33.933 38.576 43.493 13,68% 12,75%<br />
20 VEHICULOS PEREZ RUMBAO, S.A. DETALLISTAS 28.528.061 31.699 35.115 41.658 10,77% 18,63%<br />
Grupo: PEREZ RUMBAO, S.A.<br />
21 INOXIDABLES DEL ATLANTICO, S.L. MAYORISTAS 27.851.893 40.742 54.115 60.323 32,82% 11,47%<br />
22 CONSTRUCUATRO, S.A. CONSTRUCCION 27.590.603 96.554 205.714 335.874 113,06% 63,27%<br />
RASGOS DE COMPETITIVIDAD<br />
Informe económico-financiero y <strong>de</strong> la competitividad. Galicia 2006<br />
2<br />
23 INDUSTRIA GALLEGA DEL PAN, S.L. FABRICANTES 26.925.691 42.237 48.724 53.951 15,36% 10,73%<br />
24 AUTOMOVILES PEREZ RUMBAO, S.A. DETALLISTAS 26.126.363 32.329 38.050 43.224 17,69% 13,60%<br />
Grupo: PEREZ RUMBAO, S.A.<br />
25 IMPRESS METAL PACKAGING IBERICA, S.A. FABRICANTES 25.919.999 46.573 55.053 64.405 18,21% 16,99%<br />
26 HIERROS DIEGO, S.L. MAYORISTAS 25.733.698 37.950 43.030 63.489 13,39% 47,54%<br />
27 CONFECCIONES GOA, S.A. FABRICANTES 25.729.953 43.113 49.066 61.908 13,81% 26,17%<br />
Grupo: INDUSTRIA DE DISEÑO TEXTIL, S.A.<br />
28 QUINTAGLASS, S.A. FABRICANTES 25.128.040 47.283 69.729 109.670 47,47% 57,28%<br />
29 MAQUINARIA REY, S.A. MAYORISTAS 22.125.449 53.625 84.813 108.482 58,16% 27,91%<br />
30 DROGAS VIGO, S.L. MAYORISTAS 20.786.208 46.431 58.549 71.874 26,10% 22,76%<br />
31 CHYMAR, S.A. MAYORISTAS 18.155.548 46.138 68.896 78.914 49,32% 14,54%<br />
32 MÖLLERTECH ORENSE, S.L. FABRICANTES 16.801.372 35.339 57.525 69.697 62,78% 21,16%<br />
Para este calificador se ha tenido en cuenta una muestra <strong>de</strong> <strong>empresas</strong> que presentan el dato <strong>de</strong>l empleo para cada uno <strong>de</strong> los años <strong>de</strong>l<br />
período <strong>de</strong> estudio, y a<strong>de</strong>más se intentó que los datos mencionados ofreciesen cierto grado <strong>de</strong> fiabilidad (es <strong>de</strong>cir, en la relación Gastos <strong>de</strong><br />
personal/Nº <strong>de</strong> empleados se rechazan aquellos valores que resultaran incoherentes).<br />
3<br />
Para más <strong>de</strong>talle sobre la clasificación SIC ver anexos <strong>de</strong> esta publicación.
Ingresos VABcf./empleado<br />
(en unida<strong>de</strong>s <strong>de</strong> euro)<br />
Tasas <strong>de</strong><br />
variación<br />
EMPRESA GRAN SECTOR 2004 2002 2003 2004 03/02 04/03<br />
231<br />
33 DISMAREATE, S.L. CONSTRUCCION 14.620.214 179.656 479.796 584.834 167,06% 21,89%<br />
34 INSUIÑA, S.L. AGRICULTURA, SILVICULTURA, GANADERIA Y PESCA 14.610.821 52.207 59.124 88.996 13,25% 50,52%<br />
Grupo: PESCANOVA, S.A.<br />
35 PROMOCIONES OBRAS INMOBILIARIAS VIGO, SA CONSTRUCCION 13.171.920 140.496 1.418.699 1.752.784 909,78% 23,55%<br />
36 APPLUS CALIDAD Y MEDIO AMBIENTE, S.L. SERVICIOS 12.585.752 34.983 42.619 49.056 21,83% 15,10%<br />
37 FRIOKO, S.A. MAYORISTAS 12.568.714 172.656 229.051 259.371 32,66% 13,24%<br />
38 CZ VETERINARIA, S.A. FABRICANTES 11.517.916 38.948 46.370 53.627 19,06% 15,65%<br />
Grupo: ZELTIA, S.A.<br />
39 CENTRAL ELECTRODOMESTICOS NOROESTE, S.L. MAYORISTAS 10.034.270 45.186 79.759 108.995 76,51% 36,65%<br />
40 INDUSTRIAL CUBERTERA DE GALICIA, S.A. FABRICANTES 9.922.752 33.201 36.813 43.288 10,88% 17,59%<br />
41 TECAM HOSTELERIA, S.L. DETALLISTAS 9.620.605 54.119 62.368 79.023 15,24% 26,70%<br />
42 MADERAS VAZQUEZ, S.L. MAYORISTAS 9.525.844 51.492 61.295 79.661 19,04% 29,96%<br />
43 MORTEROS NOROESTE, S.L. FABRICANTES 9.125.648 144.349 172.118 196.805 19,24% 14,34%<br />
44 LUGAUTO, S.A. DETALLISTAS 8.961.084 37.565 41.429 62.252 10,29% 50,26%<br />
45 GALLEGA-LUSA DE BEBIDAS, S.L. FABRICANTES 8.771.339 63.199 108.618 127.754 71,87% 17,62%<br />
46 TABUBESA, S.L. CONSTRUCCION 8.169.053 66.396 85.250 118.065 28,40% 38,49%<br />
47 CONGELADOS MARAVILLA, S.A. MAYORISTAS 7.609.270 48.776 72.548 86.291 48,74% 18,94%<br />
48 AUTOMOVILES URBIETA, S.A. DETALLISTAS 7.321.752 27.542 32.334 37.211 17,40% 15,08%<br />
49 EIRASMAR, S.L. MAYORISTAS 7.099.263 156.203 173.813 557.757 11,27% 220,90%<br />
50 AGALIA, S.L. CONSTRUCCION 6.887.196 44.041 65.703 92.710 49,19% 41,11%<br />
51 GAS NATURAL LA CORUÑA, S.A. TRANSPORTES, COMUNICACIONES Y SERV. PUBLICOS 6.795.001 387.667 586.333 865.001 51,25% 47,53%<br />
52 BODEGAS TERRAS GAUDA, S.A. FABRICANTES 6.767.589 43.164 51.032 138.963 18,23% 172,31%<br />
53 VOZ AUDIOVISUAL, S.A. SERVICIOS 6.691.182 46.496 51.410 59.297 10,57% 15,34%<br />
54 DOURO ATLANTICO, S.L. CONSTRUCCION 6.618.447 289.364 407.345 481.040 40,77% 18,09%<br />
55 LAGO AVES HUEVOS Y CAZA, S.A. MAYORISTAS 6.325.244 36.098 49.368 66.660 36,76% 35,03%<br />
56 PROMOCIONES BALDOMERO CABADAS, S.L. CONSTRUCCION 6.217.001 58.686 79.562 124.800 35,57% 56,86%<br />
57 CONSTRUCCIONES TORREIRO, S.L. CONSTRUCCION 5.974.066 70.697 96.656 665.110 36,72% 588,12%<br />
58 ANTONIO AREA, S.A. MAYORISTAS 5.923.804 44.042 57.552 67.668 30,68% 17,58%<br />
59 EULOGIO MATO, S.A. MAYORISTAS 5.635.522 112.628 148.798 246.824 32,12% 65,88%<br />
60 AUTOS BREA, S.L. SERVICIOS 5.572.734 50.672 62.648 69.852 23,63% 11,50%<br />
61 CONSTRUCCIONES MANMER, S.L. CONSTRUCCION 5.298.847 32.970 51.775 69.677 57,04% 34,58%<br />
62 PORVAZ VILAGARCIA, S.L. MAYORISTAS 5.238.944 76.110 138.497 249.215 81,97% 79,94%<br />
63 SOLVIDA SANXENXO, S.L. SERVICIOS 5.082.609 36.403 43.074 57.255 18,32% 32,92%<br />
64 CARDELLE HIDRAULICA, S.L. DETALLISTAS 4.820.273 30.196 34.377 39.494 13,85% 14,88%<br />
65 OBRAS Y CONSTRUCCIONES CORTIZO, S.L. CONSTRUCCION 4.689.926 71.186 93.261 110.098 31,01% 18,05%<br />
66 RON CURIEL, S.A. MAYORISTAS 4.540.472 39.874 64.424 71.422 61,57% 10,86%<br />
67 INTERMEDIARIOS DE COMUNICACION, S.L. SERVICIOS 4.407.949 438.801 714.033 1.058.229 62,72% 48,20%<br />
68 PETROLIMIA, S.L. MAYORISTAS 4.336.429 53.335 61.341 70.199 15,01% 14,44%<br />
69 TASACIONES Y VALORACIONES GALICIA, S.A. SERVICIOS 4.315.549 199.000 228.238 330.004 14,69% 44,59%<br />
70 INTERNACIONAL DE COMERCIO Y SERVICIOS,SL SERVICIOS 4.303.523 58.519 99.558 135.855 70,13% 36,46%<br />
71 CASA Y JARDIN AISLAMIENTO, S.L. MAYORISTAS 3.929.892 76.374 88.325 106.921 15,65% 21,05%<br />
72 MOTOR SIETE, S.A. DETALLISTAS 3.903.988 34.566 41.611 46.227 20,38% 11,09%<br />
73 SVENSKA BEARING ESPAÑOLA, S.L. FABRICANTES 3.898.958 35.898 43.074 56.570 19,99% 31,33%<br />
74 MOTO ELITE, S.L. SERVICIOS 3.889.251 34.802 39.685 47.591 14,03% 19,92%<br />
75 SEMILLAS LAGE, S.L. MAYORISTAS 3.888.386 75.111 88.278 99.532 17,53% 12,75%<br />
76 NIETO DA COSTA, S.L. MAYORISTAS 3.783.407 39.446 45.566 93.991 15,51% 106,28%<br />
77 GRUPO FORMA DISEÑO Y CONSTRUCCION, S.L. CONSTRUCCION 3.754.919 56.192 73.194 99.613 30,26% 36,09%<br />
RASGOS DE COMPETITIVIDAD<br />
Informe económico-financiero y <strong>de</strong> la competitividad. Galicia 2006
232<br />
Ingresos VABcf./empleado<br />
(en unida<strong>de</strong>s <strong>de</strong> euro)<br />
Tasas <strong>de</strong><br />
variación<br />
EMPRESA GRAN SECTOR 2004 2002 2003 2004 03/02 04/03<br />
78 MUEBLE JUVENIL, S.A. DETALLISTAS 3.710.102 44.462 48.996 56.426 10,20% 15,16%<br />
79 LEMA HOGAR, S.L. CONSTRUCCION 3.491.856 57.787 91.090 817.424 57,63% 797,38%<br />
80 SAN JUAN AISLAMIENTOS Y EMBALAJES, S.L. FABRICANTES 3.360.643 76.138 86.492 113.473 13,60% 31,20%<br />
81 TALLERES MECANICOS E INDUSTRIALES, S.A. FABRICANTES 3.339.157 33.608 37.444 52.711 11,41% 40,77%<br />
82 FRIGORIFICOS ROSA DE LOS VIENTOS, S.L. FABRICANTES 3.279.891 68.386 78.561 126.566 14,88% 61,11%<br />
83 HYU-PEREZ RUMBAO, S.A. DETALLISTAS 3.228.282 29.657 36.968 41.465 24,65% 12,16%<br />
84 IRAGO, EXCLUSIVAS Y DISTRIBUCIONES, S.A. MAYORISTAS 3.224.165 37.568 42.811 52.939 13,96% 23,66%<br />
85 RONCESVALLES HOGAR, S.L. CONSTRUCCION 3.152.525 47.526 54.455 194.827 14,58% 257,78%<br />
86 OUTONIL, S.L. CONSTRUCCION 3.059.897 48.498 66.416 289.796 36,95% 336,34%<br />
87 ELICE ENTREPOT, S.A. MAYORISTAS 3.055.107 38.560 66.837 85.534 73,33% 27,97%<br />
88 SUMINISTROS HIDRAULICOS MAGARIÑOS, S.L. DETALLISTAS 2.922.367 39.502 45.259 52.810 14,57% 16,68%<br />
89 OXICORTES DEL NOROESTE, S.L. FABRICANTES 2.731.516 34.196 38.276 44.021 11,93% 15,01%<br />
90 ANGUBAMI, S.L. MAYORISTAS 2.661.155 86.510 112.347 588.595 29,87% 423,91%<br />
91 XAGEMA, S.L. DETALLISTAS 2.609.805 46.120 62.473 76.828 35,46% 22,98%<br />
92 CELTA INGENIEROS, S.L. MAYORISTAS 2.600.375 57.783 87.777 117.812 51,91% 34,22%<br />
93 PROMOCIONES JESUS LOPEZ DIAZ, S.A. CONSTRUCCION 2.511.527 61.093 103.578 149.651 69,54% 44,48%<br />
94 PINTURAS LUGO, S.L. MAYORISTAS 2.503.245 40.688 48.586 53.593 19,41% 10,31%<br />
95 LINEAPARAMI, S.L. FABRICANTES 2.461.535 45.947 50.665 57.297 10,27% 13,09%<br />
96 ROLOMA, S.L. CONSTRUCCION 2.439.869 32.834 37.477 48.674 14,14% 29,88%<br />
97 PAVIMENTOS DE MEAÑO, S.L. CONSTRUCCION 2.430.854 33.260 37.707 46.426 13,37% 23,12%<br />
98 COACON, S.L. MAYORISTAS 2.406.062 41.952 49.502 55.209 18,00% 11,53%<br />
99 AGRUPACION LUCENSE DE MADERAS, S.A. FABRICANTES 2.312.821 37.565 41.500 47.591 10,48% 14,68%<br />
100 GALICIA MEDIA, S.L. SERVICIOS 2.200.065 38.598 70.784 89.465 83,39% 26,39%<br />
101 GALLEGA DE CIRCUITOS ELECTRONICOS, S.L. FABRICANTES 2.190.515 55.489 68.382 76.223 23,23% 11,47%<br />
102 ASIGOYPA, S.L. CONSTRUCCION 2.025.122 145.872 177.124 300.860 21,42% 69,86%<br />
103 SUPERFICIES COMERCIALES, S.A. CONSTRUCCION 1.909.758 34.365 62.159 72.771 80,88% 17,07%<br />
Grupo: INDUSTRIA DE DISEÑO TEXTIL, S.A.<br />
104 BODEGAS AS LAXAS, S.A. FABRICANTES 1.906.248 36.791 43.523 68.828 18,30% 58,14%<br />
105 COMAGRU, S.L. MAYORISTAS 1.906.044 36.512 45.653 76.119 25,04% 66,73%<br />
106 EL POTE, S.A. DETALLISTAS 1.879.870 29.667 41.392 45.556 39,52% 10,06%<br />
107 ALFECO, S.A. MAYORISTAS 1.844.843 69.338 78.040 106.797 12,55% 36,85%<br />
RASGOS DE COMPETITIVIDAD<br />
Informe económico-financiero y <strong>de</strong> la competitividad. Galicia 2006<br />
108 ESTACION DE SERVICIO VERIN, S.A. DETALLISTAS 1.690.809 26.953 30.212 36.940 12,09% 22,27%<br />
109 ARCO PAZO, S.L. CONSTRUCCION 1.672.484 35.030 77.558 124.193 121,40% 60,13%<br />
110 CONPROMAT, S.A. CONSTRUCCION 1.668.554 41.115 251.641 581.969 512,04% 131,27%<br />
111 ADEGAS MOURE, S.A. FABRICANTES 1.662.946 44.429 51.098 92.561 15,01% 81,14%<br />
112 AUTOMOVILES PACO, S.L. DETALLISTAS 1.542.389 66.033 82.525 111.175 24,98% 34,72%<br />
113 CESAREO FERNANDEZ, S.L. MAYORISTAS 1.530.189 35.769 41.107 56.992 14,92% 38,64%<br />
114 PROTECCION VIAL, S.L. CONSTRUCCION 1.529.089 36.428 45.085 55.018 23,76% 22,03%<br />
115 PLANIFICACION DESARROLLO CONSULTORES, SL SERVICIOS 1.524.696 44.381 65.111 79.520 46,71% 22,13%<br />
116 OPTICA CALLAO, S.A. DETALLISTAS 1.506.437 33.180 64.379 73.866 94,03% 14,74%<br />
117 NOROESMAR, S.A. MAYORISTAS 1.479.025 42.225 50.856 56.005 20,44% 10,13%<br />
118 CHARCUDOS, S.L. DETALLISTAS 1.440.368 29.765 32.829 46.851 10,30% 42,71%<br />
119 EDIFICACIONES POLIGONO DE BALAIDOS, S.A. CONSTRUCCION 1.435.085 39.574 57.379 198.354 44,99% 245,69%<br />
120 MATEXGA, S.L. MAYORISTAS 1.392.840 42.585 58.638 88.283 37,70% 50,56%<br />
121 SANCHEZ ALVAREZ, S.L. CONSTRUCCION 1.380.711 47.989 62.098 75.239 29,40% 21,16%<br />
122 MARRA DISTRIBUCION ORENSANA, S.L. MAYORISTAS 1.379.353 34.654 49.082 66.760 41,63% 36,02%<br />
123 DISGALNORTE, S.L. DETALLISTAS 1.375.440 29.926 33.017 44.450 10,33% 34,63%
Ingresos VABcf./empleado<br />
(en unida<strong>de</strong>s <strong>de</strong> euro)<br />
Tasas <strong>de</strong><br />
variación<br />
EMPRESA GRAN SECTOR 2004 2002 2003 2004 03/02 04/03<br />
233<br />
124 LUMIEIRA GESTION URBANISTICA, S.L. SERVICIOS 1.371.972 102.165 189.251 261.594 85,24% 38,23%<br />
125 CONTRATAS VALDEORRAS, S.A. CONSTRUCCION 1.371.888 58.394 189.800 230.287 225,03% 21,33%<br />
126 AGENCIA GRAFICA GALLEGA, S.L. FABRICANTES 1.353.401 33.962 45.640 52.680 34,38% 15,43%<br />
127 PERSA MATERIALES DE CONSTRUCCION, S.L. MAYORISTAS 1.223.270 37.162 66.552 75.659 79,09% 13,68%<br />
128 TALLERES MECANICOS NAVALES MARIN, S.L. FABRICANTES 1.204.056 33.170 40.297 44.987 21,48% 11,64%<br />
129 CONSTRUCCIONES SILVAGAR, S.L. CONSTRUCCION 1.159.617 33.287 43.273 78.732 30,00% 81,94%<br />
130 OS PALLARES, S.L. CONSTRUCCION 1.157.670 34.363 42.800 55.637 24,55% 30,00%<br />
131 AGUARDIENTES DE GALICIA, S.A. FABRICANTES 1.110.190 54.826 78.790 102.789 43,71% 30,46%<br />
132 PCS GALICIA, S.L. DETALLISTAS 1.101.793 27.275 30.539 38.310 11,97% 25,45%<br />
133 VENTILACIONES SAVA, S.L. MAYORISTAS 1.096.703 39.244 79.123 88.828 101,62% 12,26%<br />
134 INDUSTRIAS TRIMAR, S.L. FABRICANTES 1.088.794 37.098 47.909 61.803 29,14% 29,00%<br />
135 ARBOLELLA NAYA, S.L. SERVICIOS 1.087.778 64.118 72.624 179.898 13,27% 147,71%<br />
136 DISTRIBUCIONES NORSEVIK, S.L. MAYORISTAS 1.047.516 48.129 59.933 76.476 24,52% 27,60%<br />
137 CENTRO ENFERMED. TORACICAS CARDIOVASCUL. SERVICIOS 1.040.088 157.387 262.636 534.385 66,87% 103,47%<br />
138 EPRICER, S.L. SERVICIOS 997.770 58.545 72.341 80.952 23,56% 11,90%<br />
139 PESCADOS CABACO, S.L. MAYORISTAS 994.074 38.136 42.705 53.036 11,98% 24,19%<br />
140 GRUPO NORTE M.C.A., S.L. SERVICIOS 978.321 37.121 42.176 55.047 13,62% 30,52%<br />
141 PARKING ROSALIA DE CASTRO, S.L. SERVICIOS 963.591 217.657 248.354 343.599 14,10% 38,35%<br />
142 SISTEMAS TELEFONICOS E INFORMATICOS, S.L DETALLISTAS 961.409 40.927 45.794 63.138 11,89% 37,87%<br />
143 TASAGALICIA CONSULT, S.A. SERVICIOS 954.762 51.787 75.915 91.836 46,59% 20,97%<br />
144 PORCELANA DE SARGADELOS, S.L. DETALLISTAS 923.173 56.812 76.617 85.023 34,86% 10,97%<br />
145 CONSTRUCCIONES Y PROMOC. PEPE NOYA, S.L. CONSTRUCCION 873.613 81.177 91.847 142.506 13,14% 55,16%<br />
146 PROMOTORA DO DEZA, S.A. CONSTRUCCION 817.887 97.082 108.922 236.474 12,20% 117,10%<br />
147 MANUEL MOREIRA Y OTROS, S.L. CONSTRUCCION 814.864 35.288 94.035 141.430 166,48% 50,40%<br />
148 AMARE MARIN, S.L. TRANSPORTES, COMUNICACIONES Y SERV. PUBLICOS 800.296 49.459 74.476 82.836 50,58% 11,23%<br />
149 GALERIA LUGO, S.L. DETALLISTAS 790.818 31.595 44.699 50.828 41,47% 13,71%<br />
150 CONSTRUCCIONES ARCO CORUÑA, S.L. CONSTRUCCION 770.768 100.898 127.517 163.935 26,38% 28,56%<br />
151 TAD, S.L. TRANSP. ALMACEN Y DISTRIBUCION TRANSPORTES, COMUNICACIONES Y SERV. PUBLICOS 735.699 41.237 48.672 82.908 18,03% 70,34%<br />
152 AUTOMOVILES M. NUÑEZ, S.A. SERVICIOS 703.785 68.509 82.474 98.263 20,38% 19,14%<br />
153 XOGOS GALICIA, S.L. SERVICIOS 698.442 64.455 71.415 91.732 10,80% 28,45%<br />
154 RECREATIVOS MIAMI, S.A. SERVICIOS 695.690 114.120 153.342 169.516 34,37% 10,55%<br />
155 LUANO OURENSE, S.L. CONSTRUCCION 683.068 37.149 44.679 237.850 20,27% 432,35%<br />
156 COPEFRI ATLANTICO, S.L. SERVICIOS 681.620 117.131 142.266 173.482 21,46% 21,94%<br />
157 CRISTALERIA PUENTEAREAS, S.L. CONSTRUCCION 636.352 35.336 42.755 47.654 20,99% 11,46%<br />
158 INST. ESTUDIOS CELULARES MOLECUL. ICM,SA SERVICIOS 633.341 56.294 91.460 133.786 62,47% 46,28%<br />
159 CINGAL, S.L. FABRICANTES 623.256 35.412 40.164 51.859 13,42% 29,12%<br />
160 DESTILERIAS DEL SALNES, S.L. FABRICANTES 601.655 39.553 53.430 63.091 35,09% 18,08%<br />
161 GRANIT CENTER, S.L. MINERIA 587.682 60.537 94.768 128.052 56,54% 35,12%<br />
162 FERSI COMUNICACIONES, S.L. CONSTRUCCION 557.427 37.258 41.857 48.555 12,34% 16,00%<br />
163 RIOMANZANAS, S.A. FABRICANTES 545.833 37.044 346.424 407.089 835,16% 17,51%<br />
Grupo: CUPIRE - PADESA, S.A.<br />
164 GOLD FORCE NORTE, S.L. FABRICANTES 536.596 32.803 36.578 55.282 11,51% 51,13%<br />
165 AEROMARINE, S.L. FABRICANTES 533.038 41.043 59.795 74.640 45,69% 24,83%<br />
166 ZERGAL 2001, S.L. SERVICIOS 512.741 85.460 94.784 104.474 10,91% 10,22%<br />
167 M. CALVO EXCAVACIONES, S.L. CONSTRUCCION 498.990 44.457 72.349 201.158 62,74% 178,04%<br />
168 JUAN REY, S.L. FABRICANTES 497.380 44.287 81.137 110.944 83,21% 36,74%<br />
169 DUFFY GESTORES COMERCIALES, S.L. SERVICIOS 488.010 53.830 91.766 133.737 70,48% 45,74%<br />
RASGOS DE COMPETITIVIDAD<br />
Informe económico-financiero y <strong>de</strong> la competitividad. Galicia 2006
234<br />
Ingresos VABcf./empleado<br />
(en unida<strong>de</strong>s <strong>de</strong> euro)<br />
Tasas <strong>de</strong><br />
variación<br />
EMPRESA GRAN SECTOR 2004 2002 2003 2004 03/02 04/03<br />
170 HIRMA, S.L. SERVICIOS 483.941 77.366 88.633 114.020 14,56% 28,64%<br />
171 REYMOVI, S.L. DETALLISTAS 476.681 28.776 38.102 45.272 32,41% 18,82%<br />
172 ALAMEDA 12, S.L. SERVICIOS 474.757 106.379 215.288 265.437 102,38% 23,29%<br />
173 CAMPOS PEREZ 92, S.L. CONSTRUCCION 454.431 47.880 56.850 77.317 18,73% 36,00%<br />
174 VULCANIZADOS TEIS, S.L. FABRICANTES 440.362 46.296 103.356 219.772 123,25% 112,64%<br />
175 CLIMATEGA, S.L. CONSTRUCCION 427.734 33.975 42.564 51.455 25,28% 20,89%<br />
176 GESTIONES CONXO, S.L. CONSTRUCCION 417.373 35.725 120.350 169.149 236,88% 40,55%<br />
177 TIENDAS MOTTO, S.L. DETALLISTAS 416.315 108.038 221.125 386.793 104,67% 74,92%<br />
178 ULTRATUR GESTION, S.L. SERVICIOS 404.096 37.452 44.270 54.349 18,20% 22,77%<br />
179 ECONOLER, S.A. SERVICIOS 393.621 49.362 57.676 64.765 16,84% 12,29%<br />
180 CONSTRUCCION Y CONTROL, S.L. CONSTRUCCION 387.160 46.137 85.744 134.909 85,85% 57,34%<br />
181 GESTORIA ESLAS, S.L. SERVICIOS 376.192 35.314 51.340 56.850 45,38% 10,73%<br />
182 PROCESADORA GALLEGA DE ALIMENTOS, S.L. FABRICANTES 368.493 44.076 75.277 146.732 70,79% 94,92%<br />
183 TRANSPORTES CALAMASA, S.L. TRANSPORTES, COMUNICACIONES Y SERV. PUBLICOS 361.196 53.923 133.809 161.918 148,15% 21,01%<br />
184 JOSE MANUEL BLANCO GARCIA, S.L. TRANSPORTES, COMUNICACIONES Y SERV. PUBLICOS 349.627 53.743 61.256 71.522 13,98% 16,76%<br />
185 OPTOMETRISTAS LUCENSES, S.L. DETALLISTAS 332.847 28.450 35.762 44.186 25,70% 23,56%<br />
186 GESPROCAR, S.L. CONSTRUCCION 330.575 46.028 61.028 80.527 32,59% 31,95%<br />
187 COMPRESORES ROZAS, S.L. CONSTRUCCION 327.528 33.060 39.249 45.868 18,72% 16,86%<br />
188 CENTRAL ELECTRICA MACEIRA, S.L. TRANSPORTES, COMUNICACIONES Y SERV. PUBLICOS 322.617 43.123 48.075 56.941 11,48% 18,44%<br />
189 EDITORIAL GRAFICA SANTA EULALIA, S.L. MAYORISTAS 309.227 43.598 61.525 101.169 41,12% 64,44%<br />
Ilustración 2.4.23. Relación <strong>de</strong> <strong>empresas</strong> <strong>de</strong> <strong>alta</strong> <strong>productividad</strong> en Galicia (período 2002-2004).<br />
Entre las <strong>empresas</strong> <strong>de</strong> <strong>alta</strong> <strong>productividad</strong> cabe <strong>de</strong>stacar a METALURGICA GALAICA, S.A. que es la que genera el<br />
mayor volumen <strong>de</strong> ingresos en 2004 (574.196.699 euros) y pertenece al sector <strong>de</strong> fabricación, en concreto a la<br />
fundición <strong>de</strong> acero.<br />
RASGOS DE COMPETITIVIDAD<br />
Informe económico-financiero y <strong>de</strong> la competitividad. Galicia 2006<br />
Entre estas diez primeras <strong>empresas</strong>, seis están relacionadas con el sector <strong>de</strong> la fabricación. Son, a<strong>de</strong>más <strong>de</strong><br />
METALURGICA GALAICA, S.A. perteneciente al sector <strong>de</strong> fundición <strong>de</strong> acero, las siguientes: INDIPUNT, S.L. y STEAR, S.A.<br />
ambas pertenecientes al sector <strong>de</strong> fabricación <strong>de</strong> productos confeccionados <strong>de</strong> textiles. SGL CARBÓN, S.A. <strong>de</strong>l<br />
sector <strong>de</strong> productos <strong>de</strong> carbón y grafito, BIOETANOL GALICIA, S.A. <strong>de</strong>l sector <strong>de</strong> productos químicos, y por último<br />
RODMAN POLYSHIPS, S.A. <strong>de</strong>l sector <strong>de</strong> construcción y reparación <strong>de</strong> buques.<br />
En el sector <strong>de</strong> distribución <strong>de</strong>tallista se localiza a GRUPO MASSIMO DUTTI, S.A. (<strong>de</strong>l grupo INDUSTRIA DE DISEÑO TEXTIL,<br />
S.A.) <strong>de</strong>l sector <strong>de</strong> <strong>de</strong>tallistas <strong>de</strong> confecciones en general.<br />
A la distribución mayorista se <strong>de</strong>dica PESCANOVA, S.A. en el sector <strong>de</strong> pescados y mariscos y SIDERÚRGICA AÑÓN,<br />
S.A. en el sector <strong>de</strong> los metales.<br />
Por último, se localiza una empresa en el sector <strong>de</strong> la construcción, es GOA-INVEST, S.A. que <strong>de</strong>sarrolla su actividad<br />
en el sector <strong>de</strong> los contratistas generales.
C. <strong>Las</strong> <strong>empresas</strong> <strong>de</strong> <strong>alta</strong> <strong>productividad</strong> por sector.<br />
235<br />
En el cuadro que sigue a continuación, hemos agrupado las 189 <strong>empresas</strong> <strong>de</strong> <strong>alta</strong> <strong>productividad</strong> <strong>de</strong> la muestra por<br />
gran<strong>de</strong>s sectores.<br />
<strong>Las</strong> <strong>empresas</strong> <strong>de</strong> <strong>alta</strong> <strong>productividad</strong> por sector<br />
Gran Sector<br />
Construcción 45 23,8%<br />
Fabricantes 40 21,2%<br />
Mayoristas 40 21,2%<br />
Servicios 29 15,3%<br />
Detallistas 26 13,8%<br />
Transportes, comunicaciones y serv. públicos 7 3,7%<br />
Agricultura, silvicultura, gana<strong>de</strong>ría y pesca 1 0,5%<br />
Minería 1 0,5%<br />
TOTAL 189 100,0%<br />
SERVICIOS<br />
15,3%<br />
MAYORISTAS<br />
21,2%<br />
FABRICANTES<br />
21,2%<br />
DETALLISTAS<br />
13,8%<br />
TRANSPORTES,<br />
COMUNICACIONES Y<br />
SERVICIOS PÚBLICOS<br />
3,7%<br />
Nº <strong>empresas</strong> %<br />
CONSTRUCCIÓN<br />
23,8%<br />
AGRICULTURA,<br />
SILVICULTURA,<br />
GANADERÍA Y PESCA<br />
0,5%<br />
MINERÍA<br />
0,5%<br />
El 23,8% <strong>de</strong> esta tipología <strong>de</strong> <strong>empresas</strong> está<br />
presente en activida<strong>de</strong>s <strong>de</strong> construcción,<br />
particularmente en los sectores <strong>de</strong><br />
promotores <strong>de</strong> obras, contratistas generales,<br />
construcciones pesadas, excavaciones y<br />
cimientos, instalaciones eléctricas y<br />
contratistas especializados.<br />
Un 21,2% <strong>de</strong> las <strong>empresas</strong> <strong>de</strong> <strong>alta</strong><br />
<strong>productividad</strong> se sitúa en activida<strong>de</strong>s <strong>de</strong><br />
fabricación don<strong>de</strong> <strong>de</strong>stacan los fabricantes<br />
<strong>de</strong> vinos y brandy, construcción y reparación<br />
<strong>de</strong> buques, productos confeccionados <strong>de</strong><br />
textiles, productos plásticos y metalúrgicos.<br />
Con el mismo porcentaje nos encontramos<br />
con <strong>empresas</strong> <strong>de</strong>l sector <strong>de</strong> distribución<br />
mayorista. Destacan en este sector los<br />
distribuidores <strong>de</strong> pescados y mariscos, los <strong>de</strong><br />
materiales para la construcción, metales,<br />
maquinaria y equipo industrial y carnes y<br />
productos cárnicos.<br />
Ilustración 2.4.24. Distribución por sectores empresariales<br />
<strong>de</strong> las <strong>empresas</strong> <strong>de</strong> <strong>alta</strong> <strong>productividad</strong> en 2004.<br />
El 15,3% <strong>de</strong> las <strong>empresas</strong> <strong>de</strong> <strong>alta</strong> <strong>productividad</strong> se sitúa en activida<strong>de</strong>s <strong>de</strong> servicios, <strong>de</strong> los cuales es interesante<br />
<strong>de</strong>stacar: oficinas técnicas <strong>de</strong> ingeniería y arquitectura, servicios comerciales, máquinas tragaperras para recreo y<br />
alquiler <strong>de</strong> automóviles <strong>de</strong> turismo sin conductor.<br />
Un 13,8% <strong>de</strong> estas <strong>empresas</strong> también se encuentra en activida<strong>de</strong>s <strong>de</strong> distribución <strong>de</strong>tallista, entre las que cabe<br />
<strong>de</strong>stacar a los concesionarios <strong>de</strong> automóviles nuevos y usados.<br />
En los transportes, comunicaciones y servicios públicos se localiza el 3,7%, particularmente en los siguientes<br />
sectores: transporte <strong>de</strong> mercancías por carretera y producción y servicios eléctricos.<br />
Por último, un 0,5% se ubica en el grupo <strong>de</strong> la agricultura, silvicultura, gana<strong>de</strong>ría y pesca, concretamente en los<br />
cria<strong>de</strong>ros y viveros <strong>de</strong> pescados y otro 0,5% en el grupo <strong>de</strong> la minería en la extracción <strong>de</strong> piedras.<br />
D. <strong>Las</strong> <strong>empresas</strong> <strong>de</strong> <strong>alta</strong> <strong>productividad</strong> por comarca.<br />
Atendiendo al número <strong>de</strong> <strong>empresas</strong> <strong>de</strong> <strong>alta</strong> <strong>productividad</strong> por comarca, observamos que se ubican principalmente<br />
en: A Coruña con 55 <strong>empresas</strong>, que suponen el 28,8% <strong>de</strong>l total y en Vigo, la cual registra 40 <strong>empresas</strong>. A<br />
continuación, se ubican Santiago con 18 <strong>empresas</strong>, Ourense con 13, Lugo con 10 y, O Salnés y Pontevedra, ambas<br />
con 8 <strong>empresas</strong>. El resto <strong>de</strong> las comarcas registran un número <strong>de</strong> <strong>empresas</strong> inferior a 5.<br />
RASGOS DE COMPETITIVIDAD<br />
Informe económico-financiero y <strong>de</strong> la competitividad. Galicia 2006
236<br />
<strong>Las</strong> <strong>empresas</strong> <strong>de</strong> <strong>alta</strong> <strong>productividad</strong> por comarca<br />
<strong>empresas</strong> <strong>alta</strong> <strong>productividad</strong><br />
COMARCAS nº %<br />
nº <strong>empresas</strong><br />
por comarca<br />
% <strong>empresas</strong><br />
<strong>alta</strong> <strong>productividad</strong><br />
s/ total comarca<br />
A Coruña 54 28,6% 2.328 2,3%<br />
Vigo 40 21,2% 2.758 1,5%<br />
Santiago 17 9,0% 829 2,1%<br />
Ourense 13 6,9% 777 1,7%<br />
Lugo 10 5,3% 626 1,6%<br />
O Salnés 8 4,2% 606 1,3%<br />
Pontevedra 8 4,2% 647 1,2%<br />
Ferrol 4 2,1% 412 1,0%<br />
O Morrazo 4 2,1% 304 1,3%<br />
Bergantiños 3 1,6% 262 1,1%<br />
Deza 3 1,6% 225 1,3%<br />
O Condado 3 1,6% 193 1,6%<br />
A Mariña Central 2 1,1% 152 1,3%<br />
O Baixo Miño 2 1,1% 264 0,8%<br />
O Eume 2 1,1% 114 1,8%<br />
Val<strong>de</strong>orras 2 1,1% 164 1,2%<br />
A Barbanza 1 0,5% 289 0,3%<br />
A Limia 1 0,5% 66 1,5%<br />
A Mariña Occi<strong>de</strong>ntal 1 0,5% 129 0,8%<br />
A Mariña Oriental 1 0,5% 69 1,4%<br />
A Paradanta 1 0,5% 32 3,1%<br />
Barcala 1 0,5% 26 3,8%<br />
Betanzos 1 0,5% 115 0,9%<br />
O Sar 1 0,5% 95 1,1%<br />
Sarria 1 0,5% 88 1,1%<br />
Tabeirós-Terra <strong>de</strong> Montes 1 0,5% 108 0,9%<br />
Terra Chá 1 0,5% 122 0,8%<br />
Terra <strong>de</strong> Lemos 1 0,5% 78 1,3%<br />
Terra <strong>de</strong> Meli<strong>de</strong> 1 0,5% 37 2,7%<br />
Verín 1 0,5% 78 1,3%<br />
189 100,0% 11.993<br />
Ilustración 2.4.25. Distribución por comarcas <strong>de</strong> las <strong>empresas</strong> <strong>de</strong> <strong>alta</strong> <strong>productividad</strong> en 2004.<br />
RASGOS DE COMPETITIVIDAD<br />
Informe económico-financiero y <strong>de</strong> la competitividad. Galicia 2006<br />
Por otra parte, si nos centramos en la concentración relativa <strong>de</strong> <strong>empresas</strong>, es <strong>de</strong>cir, el porcentaje que representan<br />
el número <strong>de</strong> <strong>empresas</strong> <strong>de</strong> <strong>alta</strong> <strong>productividad</strong> respecto al total <strong>de</strong> <strong>empresas</strong> por comarca, en primer lugar aparece<br />
Barcala con un 3,8%, le sigue A Paradanta con un 3,1%, Terra <strong>de</strong> Meli<strong>de</strong> con 2,7%, A Coruña con un 2,4% y<br />
Santiago con 2,2% <strong>de</strong> <strong>empresas</strong> <strong>de</strong> <strong>alta</strong> <strong>productividad</strong>.<br />
E. La importancia <strong>de</strong> la <strong>alta</strong> <strong>productividad</strong> en la competitividad.<br />
El concepto más genuino <strong>de</strong> competitividad se asimila a la constitución <strong>de</strong> ventajas competitivas sólidas y<br />
dura<strong>de</strong>ras en el tiempo. Existen dos caminos clave para crear esas ventajas, uno a través <strong>de</strong> la mejora <strong>de</strong> la<br />
<strong>productividad</strong> y otro mediante el incremento <strong>de</strong> la innovación. Productividad implica actuar sobre las cosas que<br />
conocemos tratando <strong>de</strong> mejorarlas constantemente; innovación supone modificar lo existente mediante la<br />
renovación y el cambio.<br />
La <strong>alta</strong> <strong>productividad</strong> lleva asociadas notables capacida<strong>de</strong>s organizativas, así como <strong>de</strong> <strong>de</strong>sarrollo <strong>de</strong> estrategias<br />
que favorezcan el posicionamiento <strong>de</strong> la empresa en un nivel elevado respecto a las otras firmas con las que se<br />
compite.
<strong>Las</strong> <strong>empresas</strong> con <strong>alta</strong> <strong>productividad</strong> <strong>de</strong> los recursos humanos tendrán muchas opciones para ganar la batalla<br />
competitiva <strong>de</strong> cara al futuro. <strong>Las</strong> capacida<strong>de</strong>s distintivas <strong>de</strong>l factor humano, especialmente las <strong>de</strong> su equipo<br />
directivo, unidas a la <strong>productividad</strong> <strong>de</strong> todo el núcleo humano posibilitarán, muy probablemente, alcanzar y<br />
sostener elevados niveles <strong>de</strong> competitividad. <strong>Las</strong> bases para potenciar dichas capacida<strong>de</strong>s tendrán mucho que ver<br />
con el esfuerzo en el aprendizaje individual y organizacional, orientado a <strong>de</strong>sarrollar competencias creadoras <strong>de</strong><br />
valor.<br />
237<br />
Ahora bien, necesitamos cambiar las premisas sobre las que se asientan los avances <strong>de</strong> la <strong>productividad</strong>. De<br />
hecho, la Administración Científica, cuyo máximo exponente fue Fre<strong>de</strong>rick Taylor, resolvió con éxito los problemas<br />
<strong>de</strong> <strong>productividad</strong> <strong>de</strong>l trabajo manual. También muchas <strong>de</strong> las teorías <strong>de</strong>stacadas <strong>de</strong>l siglo XX, por ejemplo, Kaizen,<br />
TQM o BPR están basadas en los principios <strong>de</strong> Taylor, fundamentalmente añadiendo componentes <strong>de</strong> la calidad en<br />
la gestión.<br />
El problema es que cerca <strong>de</strong>l 80% <strong>de</strong>l conocimiento <strong>de</strong> una organización es <strong>de</strong> naturaleza personal (Rasmus, 2003)<br />
lo cual concuerda con otros estudios (Delphi, 1998). Y la realidad es que la traslación <strong>de</strong> conocimiento personal<br />
organizativo no es tan sencillo.<br />
EN DEFINITIVA EN EL ÁMBITO DE LA PRODUCTIVIDAD EL NUEVO RETO ES EL<br />
DE LA PRODUCTIVIDAD DEL TRABAJADOR DEL CONOCIMIENTO<br />
RASGOS DE COMPETITIVIDAD<br />
Informe económico-financiero y <strong>de</strong> la competitividad. Galicia 2006


