Educación para todos: el imperativo de la calidad - unesdoc - Unesco
Educación para todos: el imperativo de la calidad - unesdoc - Unesco
Educación para todos: el imperativo de la calidad - unesdoc - Unesco

You also want an ePaper? Increase the reach of your titles
YUMPU automatically turns print PDFs into web optimized ePapers that Google loves.
EVALUACIÓN DE LOS PROGRESOS HACIA LOS OBJETIVOS DE LA EPT / 139<br />
La <strong>calidad</strong> <strong>de</strong> <strong>la</strong> educación<br />
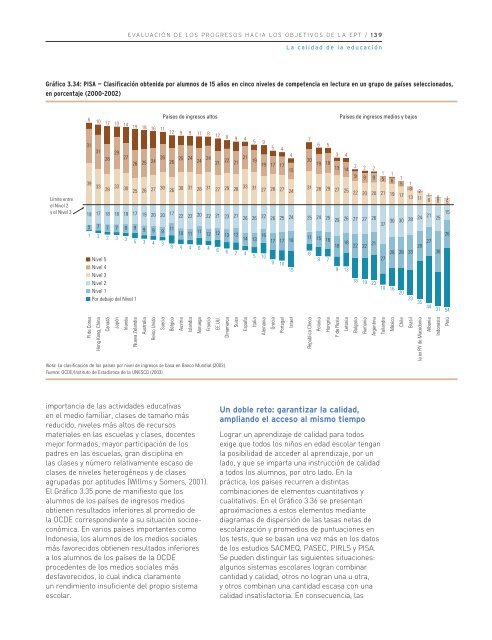
Gráfico 3.34: PISA — C<strong>la</strong>sificación obtenida por alumnos <strong>de</strong> 15 años en cinco niv<strong>el</strong>es <strong>de</strong> competencia en lectura en un grupo <strong>de</strong> países s<strong>el</strong>eccionados,<br />
en porcentaje (2000-2002)<br />
6<br />
10<br />
17<br />
10<br />
Países <strong>de</strong> ingresos altos<br />
14 19 18 16 11 12 9 9 11 8 12 8 9 4<br />
Países <strong>de</strong> ingresos medios y bajos<br />
Límite entre<br />
<strong>el</strong> Niv<strong>el</strong> 2<br />
y <strong>el</strong> Niv<strong>el</strong> 3<br />
5<br />
7<br />
9<br />
31<br />
6 5<br />
5<br />
31<br />
4<br />
29<br />
3 4<br />
28 27<br />
26 25 24 26 26 25 24 24 24 20<br />
21 22 21 4<br />
21 19 19 17 17 19 18<br />
2 2 15<br />
13 14 2<br />
1<br />
9<br />
1<br />
9 9 5 1<br />
6<br />
39 33 33 28 30 25 26 27 30 31 1<br />
26 30 31 28 31 27 29 28 33 5<br />
31 27 28 27 24<br />
28 29 27 25 3<br />
22 20 20 21 2<br />
19 17 13 1<br />
11 8<br />
19 17 18 18 18 17 19 20 20 17 22 22 20 22 21 23 21 26 26 22 26 25 24<br />
5 7 7 7 8 9 9 9 9<br />
1 3 2 3 3<br />
Niv<strong>el</strong> 5<br />
Niv<strong>el</strong> 4<br />
Niv<strong>el</strong> 3<br />
Niv<strong>el</strong> 2<br />
Niv<strong>el</strong> 1<br />
Por <strong>de</strong>bajo d<strong>el</strong> Niv<strong>el</strong> 1<br />
5 3 4 3<br />
11<br />
10 11<br />
11 12 12 13 12 14 13<br />
16<br />
8 4 4 6 4 6 6 7 4<br />
5 10<br />
17 17 18<br />
9 10<br />
15<br />
0<br />
6<br />
1<br />
5<br />
25 24 25 29 26 27 27 26<br />
30<br />
37 30 28 24 21 15<br />
25<br />
11 15 16<br />
18 18 22 22 21<br />
6<br />
28 28 33<br />
28 27 38<br />
9 7<br />
27<br />
9 13<br />
18 19 23<br />
10 16<br />
20<br />
23 35<br />
44<br />
31 54<br />
26<br />
R <strong>de</strong> Corea<br />
Hong Kong, China<br />
Canadá<br />
Japón<br />
Ir<strong>la</strong>nda<br />
Nueva Z<strong>el</strong>andia<br />
Australia<br />
Reino Unido<br />
Suecia<br />
Bélgica<br />
Austria<br />
Is<strong>la</strong>ndia<br />
Noruega<br />
Francia<br />
EE.UU.<br />
Dinamarca<br />
Suiza<br />
España<br />
Italia<br />
Alemania<br />
Grecia<br />
Portugal<br />
Isra<strong>el</strong><br />
República Checa<br />
Polonia<br />
Hungría<br />
F <strong>de</strong> Rusia<br />
Letonia<br />
Bulgaria<br />
Rumania<br />
Argentina<br />
Tai<strong>la</strong>ndia<br />
México<br />
Chile<br />
Brasil<br />
<strong>la</strong> ex RY <strong>de</strong> Macedonia<br />
Albania<br />
Indonesia<br />
Perú<br />
Nota: La c<strong>la</strong>sificación <strong>de</strong> los países por niv<strong>el</strong> <strong>de</strong> ingresos se basa en Banco Mundial (2003).<br />
Fuente: OCDE/Instituto <strong>de</strong> Estadística <strong>de</strong> <strong>la</strong> UNESCO (2003).<br />
importancia <strong>de</strong> <strong>la</strong>s activida<strong>de</strong>s educativas<br />
en <strong>el</strong> medio familiar, c<strong>la</strong>ses <strong>de</strong> tamaño más<br />
reducido, niv<strong>el</strong>es más altos <strong>de</strong> recursos<br />
materiales en <strong>la</strong>s escu<strong>el</strong>as y c<strong>la</strong>ses, docentes<br />
mejor formados, mayor participación <strong>de</strong> los<br />
padres en <strong>la</strong>s escu<strong>el</strong>as, gran disciplina en<br />
<strong>la</strong>s c<strong>la</strong>ses y número r<strong>el</strong>ativamente escaso <strong>de</strong><br />
c<strong>la</strong>ses <strong>de</strong> niv<strong>el</strong>es heterogéneos y <strong>de</strong> c<strong>la</strong>ses<br />
agrupadas por aptitu<strong>de</strong>s (Willms y Somers, 2001).<br />
El Gráfico 3.35 pone <strong>de</strong> manifiesto que los<br />
alumnos <strong>de</strong> los países <strong>de</strong> ingresos medios<br />
obtienen resultados inferiores al promedio <strong>de</strong><br />
<strong>la</strong> OCDE correspondiente a su situación socioeconómica.<br />
En varios países importantes como<br />
Indonesia, los alumnos <strong>de</strong> los medios sociales<br />
más favorecidos obtienen resultados inferiores<br />
a los alumnos <strong>de</strong> los países <strong>de</strong> <strong>la</strong> OCDE<br />
proce<strong>de</strong>ntes <strong>de</strong> los medios sociales más<br />
<strong>de</strong>sfavorecidos, lo cual indica c<strong>la</strong>ramente<br />
un rendimiento insuficiente d<strong>el</strong> propio sistema<br />
esco<strong>la</strong>r.<br />
Un doble reto: garantizar <strong>la</strong> <strong>calidad</strong>,<br />
ampliando <strong>el</strong> acceso al mismo tiempo<br />
Lograr un aprendizaje <strong>de</strong> <strong>calidad</strong> <strong>para</strong> <strong>todos</strong><br />
exige que <strong>todos</strong> los niños en edad esco<strong>la</strong>r tengan<br />
<strong>la</strong> posibilidad <strong>de</strong> acce<strong>de</strong>r al aprendizaje, por un<br />
<strong>la</strong>do, y que se imparta una instrucción <strong>de</strong> <strong>calidad</strong><br />
a <strong>todos</strong> los alumnos, por otro <strong>la</strong>do. En <strong>la</strong><br />
práctica, los países recurren a distintas<br />
combinaciones <strong>de</strong> <strong>el</strong>ementos cuantitativos y<br />
cualitativos. En <strong>el</strong> Gráfico 3.36 se presentan<br />
aproximaciones a estos <strong>el</strong>ementos mediante<br />
diagramas <strong>de</strong> dispersión <strong>de</strong> <strong>la</strong>s tasas netas <strong>de</strong><br />
esco<strong>la</strong>rización y promedios <strong>de</strong> puntuaciones en<br />
los tests, que se basan una vez más en los datos<br />
<strong>de</strong> los estudios SACMEQ, PASEC, PIRLS y PISA.<br />
Se pue<strong>de</strong>n distinguir <strong>la</strong>s siguientes situaciones:<br />
algunos sistemas esco<strong>la</strong>res logran combinar<br />
cantidad y <strong>calidad</strong>, otros no logran una u otra,<br />
y otros combinan una cantidad escasa con una<br />
<strong>calidad</strong> insatisfactoria. En consecuencia, <strong>la</strong>s