Page 1 GanaderÃa Sistema Productivo: Agroalimentario Empresas ...
Page 1 GanaderÃa Sistema Productivo: Agroalimentario Empresas ...
Page 1 GanaderÃa Sistema Productivo: Agroalimentario Empresas ...

You also want an ePaper? Increase the reach of your titles
YUMPU automatically turns print PDFs into web optimized ePapers that Google loves.
••••<br />
Referencias Sectoriales<br />
Galicia´09<br />
Ganadería<br />
<strong>Sistema</strong> <strong>Productivo</strong>: <strong>Agroalimentario</strong><br />
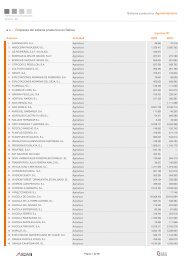
• • • Principales empresas en ingresos de explotación<br />
Ingresos (€)<br />
<strong>Empresas</strong> del sector en GALICIA 2006 2007<br />
Tasa de variación<br />
2007/2006<br />
1 HYPOR ESPAÑA G.P., S.A. 12.642.999 12.720.000 0,61%<br />
2 EXPLOTACIONES PORCINAS MELIDE, S.L. 5.210.643 — —<br />
3 GENERAL GANADERA DEL NORTE, S.L. 4.086.804 4.200.077 2,77%<br />
4 GENERAL GANADERA GALLEGA, S.A. 2.840.431 3.771.044 32,76%<br />
5 GRUPO ALTOPASO, S.L. 3.061.730 3.229.773 5,49%<br />
6 AVIPOR SILLEDA, S.L. 2.309.690 2.608.555 12,94%<br />
7 COMERCIAL GERMAN, S.L. 1.469.535 1.830.058 24,53%<br />
8 EXPORGONDO, S.L. 1.707.560 1.788.137 4,72%<br />
9 S.A.T. LANGUEIRON 1.587.946 1.746.740 10,00%<br />
10 CEBOTERGA, S.L. 2.342.974 1.713.251 -26,88%<br />
11 EUROZELTIFUR, S.L. 1.693.466 1.417.836 -16,28%<br />
12 HIBRIPORGA, S.L. 911.886 1.338.418 46,77%<br />
13 GRANJAS SAN LUIS, S.L. 1.368.432 1.318.230 -3,67%<br />
14 EXPLOTACIONES GANADERAS ROALCO, S.L. 1.267.516 — —<br />
15 GRANJA BERNAL, S.L. 951.288 1.062.637 11,71%<br />
16 PORCICULA TRANSMUNDI, S.L. 706.394 944.214 33,67%<br />
17 GRANJAS MUIÑOS, S.L. 1.112.696 896.211 -19,46%<br />
18 S.A.T. SAN VICENTE DE NIVEIRO 680.328 881.360 29,55%<br />
19 PORCIDRE, S.L. 705.300 879.377 24,68%<br />
20 HERABAR AGROPECUARIA, S.A. 859.946 — —<br />
Nº de empresas del sector en Galicia: 54<br />
Ingresos (€)<br />
Tasa de variación<br />
<strong>Empresas</strong> del sector en ESPAÑA 2006 2007 2007/2006<br />
1 AGROPECUARIA DE GUISSONA, S.C.L. 190.073.672 203.591.035 7,11%<br />
2 UVE, S.A. 134.929.591 158.303.529 17,32%<br />
3 AGROIBERICOS DERAZA, S.L. 124.043.946 125.276.183 0,99%<br />
4 JUAN JIMENEZ GARCIA, S.A. 108.065.234 — —<br />
5 CEFU, S.A. 92.017.694 99.975.761 8,65%<br />
Nº de empresas del sector en España: 243<br />
• • •<br />
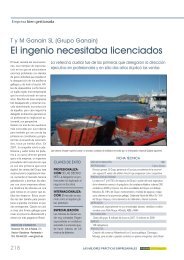
Estructura de las empresas del sector en función de los ingresos<br />
Galicia<br />
España<br />
1,9%<br />
7,4%<br />
0,0%<br />
12,3%<br />
2,9%<br />
Microempresas (hasta 2 millones €)<br />
Resto de Pequeñas empresas (entre 2 y 10 mill. €)<br />
23,0%<br />
61,7%<br />
Medianas empresas (entre 10 y 50 millones €)<br />
Grandes empresas (más de 50 millones €)<br />
90,7%<br />
Fuente ARDÁN. Los datos reflejados en los gráficos corresponden al ejercicio 2007
• • • •<br />
Referencias Sectoriales<br />
Galicia´09<br />
Ganadería<br />
<strong>Sistema</strong> <strong>Productivo</strong>: <strong>Agroalimentario</strong><br />
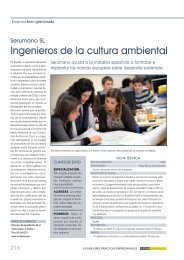
• • • Ingresos, costes y resultados. Inversión y financiación<br />
Actividad<br />
Sector<br />
Galicia<br />
Sector<br />
España<br />
Empresa líder en el sector de Galicia<br />
Valor Razón social<br />
Crecimiento ingresos explotación 4,46% -0,46% 34,99% J.J. VIEITES, S.L.<br />
Crecimiento del valor añadido -1,81% -12,67% 50,77% GANADERIA A CHOUSA, S.L.<br />
Crecimiento del resultado de explotación -12,25% -43,91% 186,74% S.A.T. OS PENEDOS Nº 983 XUGA<br />
Gastos personal / ingresos explotación 12,75% 7,81% 5,52% J.J. VIEITES, S.L.<br />
Margen de explotación 2,40% 0,55% 12,49% S.A.T. LANGUEIRON<br />
Gastos financieros / ingresos explotación 1,04% 0,80% 0,02% XA BRETOÑA, S.L.<br />
Resultado ejercicio / ingresos explotación 1,36% 0,37% 6,60% VISONES CARIDE, S.L.<br />
medianas<br />
Crecimiento del valor añadido<br />
Margen de explotación<br />
20,0%<br />
10,0%<br />
0,0%<br />
-10,0%<br />
-20,0%<br />
12,89% 15,41% 15,06%<br />
7,28%<br />
-1,81%<br />
-12,67%<br />
2005 2006 2007<br />
4,0%<br />
3,0%<br />
2,0%<br />
1,0%<br />
0,0%<br />
3,47%<br />
2,59%<br />
2,40%<br />
1,54%<br />
1,73%<br />
0,55%<br />
2005 2006 2007<br />
Sector Galicia (mediana)<br />
Sector España (mediana)<br />
Estructura<br />
Activo circulante / activo total 51,04% 61,31% 79,41% GRUPO ALTOPASO, S.L.<br />
Recursos propios / recursos totales 33,29% 37,49% 68,11% FAUNA UTIL, S.L.<br />
Liquidez<br />
Liquidez general 1,00 1,23 2,67 GRANXAS SUMAY, S.L.<br />
Solvencia 1,43 1,51 3,12 CASA CARBALLO, S.A.T. 1023 XUGA<br />
Fondo rotación / ingresos explotación -0,52% 7,68% 43,96% HIBRIPOR, S.L.<br />
Fortaleza financiera<br />
Sector<br />
Galicia<br />
Endeudamiento 1,73 1,52 0,47 FAUNA UTIL, S.L.<br />
Cash flow / deuda total 7,53% 5,01% 39,56% S.A.T. OS PENEDOS Nº 983 XUGA<br />
Recursos ajenos / recursos totales 66,49% 65,86% 32,58% GRANJAS MUIÑOS, S.L.<br />
medianas<br />
Sector<br />
España<br />
Empresa líder en el sector de Galicia<br />
Valor Razón social<br />
Activo circulante / activo total<br />
Solvencia<br />
80,0%<br />
60,0%<br />
40,0%<br />
20,0%<br />
0,0%<br />
59,29% 57,70%<br />
61,31%<br />
51,49%<br />
51,04%<br />
46,24%<br />
2005 2006 2007<br />
1,55<br />
1,50<br />
1,45<br />
1,40<br />
1,35<br />
1,52 1,51<br />
1,48 1,49<br />
1,46<br />
1,43<br />
2005 2006 2007<br />
2,50<br />
2,00<br />
1,50<br />
1,00<br />
0,50<br />
1,93<br />
1,67<br />
Endeudamiento<br />
1,66 1,73<br />
1,52 1,52<br />
4,0%<br />
3,0%<br />
2,0%<br />
1,0%<br />
Recursos ajenos / recursos totales<br />
3,47%<br />
2,59%<br />
2,40%<br />
1,54%<br />
1,73%<br />
0,55%<br />
0,00<br />
2005 2006 2007<br />
0,0%<br />
2005 2006 2007<br />
Sector Galicia (mediana)<br />
Sector España (mediana)<br />
Fuente ARDÁN. Los datos económicos reflejados en las tablas corresponden al ejercicio 2007
••••<br />
Referencias Sectoriales<br />
Galicia´09<br />
Ganadería<br />
<strong>Sistema</strong> <strong>Productivo</strong>: <strong>Agroalimentario</strong><br />
• • •<br />
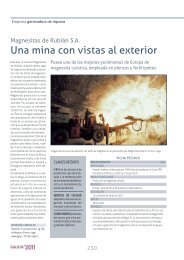
Rentabilidad y variables asociadas<br />
Sector<br />
Galicia<br />
Sector<br />
España<br />
Empresa líder en el sector de Galicia<br />
Valor Razón social<br />
Rentabilidad económica 2,15% 1,58% 10,86% S.A.T. LANGUEIRON<br />
Margen 2,90% 1,22% 11,44% GANADERIA DE RAÑON, S.L.<br />
Rotación de activos 0,95 1,06 1,83 GRANJAS MUIÑOS, S.L.<br />
Rentabilidad financiera 2,12% 1,85% 23,15% S.A.T. OS PENEDOS Nº 983 XUGA<br />
Coste neto de la deuda 1,08% 1,41% -0,01% GRUPO ALTOPASO, S.L.<br />
Apalancamiento financiero 0,01 0,00 0,07 GRUPO ALTOPASO, S.L.<br />
medianas<br />
Rentabilidad económica<br />
Rentabilidad financiera<br />
5,0%<br />
4,0%<br />
3,0%<br />
2,0%<br />
1,0%<br />
0,0%<br />
4,72%<br />
3,06%<br />
2,61%<br />
2,11%<br />
2,15%<br />
1,58%<br />
2005 2006 2007<br />
8,0%<br />
7,0%<br />
6,0%<br />
5,0%<br />
4,0%<br />
3,0%<br />
2,0%<br />
1,0%<br />
0,0%<br />
7,15%<br />
5,44%<br />
4,47%<br />
3,53%<br />
2,12% 1,85%<br />
2005 2006 2007<br />
Margen<br />
Rotación de activos<br />
4,0%<br />
3,5%<br />
3,0%<br />
2,5%<br />
2,0%<br />
1,5%<br />
1,0%<br />
0,5%<br />
0,0%<br />
3,60%<br />
2,82% 2,90%<br />
2,42% 2,31%<br />
1,22%<br />
2005 2006 2007<br />
1,40<br />
1,20<br />
1,00<br />
0,80<br />
0,60<br />
0,40<br />
0,20<br />
0,00<br />
1,27<br />
1,18<br />
1,06<br />
0,95<br />
0,85 0,85<br />
2005 2006 2007<br />
Sector Galicia (mediana)<br />
Sector España (mediana)<br />
• • •<br />
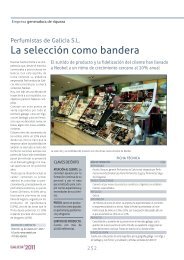
Productividad y empleo<br />
Sector<br />
Galicia<br />
Sector<br />
España<br />
Empresa líder en el sector de Galicia<br />
Valor Razón social<br />
Ingresos explotación por empleado (€) 134.693 220.541 319.901 GRANJAS SIGUEIRO, S.L.<br />
Valor añadido por empleado (€) 22.500 24.926 47.267 HYPOR ESPAÑA G.P., S.A.<br />
Coste medio del empleo (€) 15.927 18.962 9.748 GRANJA XESTOSO, S.L.<br />
Nº empleados por empresa 4 4 10 GENERAL GANADERA GALLEGA, S.A.<br />
medianas<br />
Ingresos por empleado<br />
Coste medio del empleo<br />
250.000<br />
200.000<br />
150.000<br />
100.000<br />
211.163<br />
198.626<br />
121.561 119.331<br />
220.541<br />
134.693<br />
20.000<br />
15.000<br />
10.000<br />
15.531<br />
17.105<br />
13.613<br />
18.541 18.962<br />
15.927<br />
50.000<br />
0<br />
2005 2006 2007<br />
5.000<br />
0<br />
Fuente: ARDÁN<br />
2005 2006 2007<br />
Sector Galicia (mediana)<br />
Sector España (mediana)<br />
Fuente ARDÁN. Los datos económicos reflejados en las tablas corresponden al ejercicio 2007