reporte nacional de chile 2009 - Global Entrepreneurship Monitor
reporte nacional de chile 2009 - Global Entrepreneurship Monitor
reporte nacional de chile 2009 - Global Entrepreneurship Monitor

Create successful ePaper yourself
Turn your PDF publications into a flip-book with our unique Google optimized e-Paper software.
46<br />
REPORTE NACIONAL DE CHILE <strong>2009</strong><br />
Porcentaje <strong>de</strong> población adulta entre 18 - 64 años<br />
Figura 21: Tasa <strong>de</strong> emprendimiento en etapas iniciales (TEA) según fase <strong>de</strong> <strong>de</strong>sarrollo<br />
económico y sexo<br />
40%<br />
35%<br />
30%<br />
25%<br />
20%<br />
15%<br />
10%<br />
5%<br />
0%<br />
Masculino<br />
Femenino<br />
Arabia Saudita<br />
Siria<br />
Cisj. y Franja <strong>de</strong> Gaza<br />
Líbano<br />
Marruecos<br />
Argelia<br />
Venezuela<br />
Tonga<br />
Yemen<br />
Jamaica<br />
Guatemala<br />
Uganda<br />
Serbia<br />
Croacia<br />
Bosnia y Herz.<br />
Rumania<br />
Rusia<br />
Malasia<br />
Jordania<br />
Sudáfrica<br />
Túnez<br />
Hungría<br />
Irán<br />
Letonia<br />
Uruguay<br />
Panamá<br />
Argentina<br />
Chile<br />
Rep. Dominicana<br />
Ecuador<br />
Brasil<br />
China<br />
Perú<br />
Colombia<br />
Japón<br />
Italia<br />
Francia<br />
Hong Kong<br />
Dinamarca<br />
Bélgica<br />
Eslovenia<br />
Corea<br />
Alemania<br />
Reino Unido<br />
España<br />
Finlandia<br />
Israel<br />
Noruega<br />
Estados Unidos<br />
Países Bajos<br />
Grecia<br />
Emiratos Árabes<br />
Suiza<br />
Islandia<br />
Economías basadas en<br />
los recursos<br />
Economías basadas en<br />
la eficiencia<br />
Economías basadas en<br />
la innovación<br />
Fuente: GEM. Encuesta Población Adulta (APS), <strong>2009</strong><br />
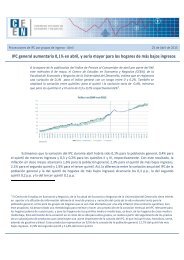
En el caso <strong>de</strong> Chile, la inci<strong>de</strong>ncia por sexos<br />
en las activida<strong>de</strong>s empren<strong>de</strong>doras suele ser mayor<br />
en los hombres. Así lo muestra la Figura 22,<br />
en don<strong>de</strong> el 17% son hombres que manifiestan<br />
ser empren<strong>de</strong>dores en etapas iniciales, versus el<br />
12,9% <strong>de</strong> mujeres que manifestaron lo mismo. En<br />
el caso <strong>de</strong> los establecidos, el 9% son hombres y<br />
el 4,6% mujeres 4 .<br />
Figura 22: Emprendimiento en etapas iniciales y establecidos por sexo, <strong>2009</strong><br />
Porcentaje <strong>de</strong> población adulta<br />
18%<br />
16%<br />
14%<br />
12%<br />
10%<br />
8%<br />
6%<br />
4%<br />
2%<br />
17,0%<br />
12,6%<br />
9,0%<br />
4,6%<br />
0%<br />
Masculino<br />
Femenino<br />
Masculino<br />
Femenino<br />
Etapas Iniciales<br />
Establecidos<br />
Fuente: GEM. Encuesta Población Adulta (APS), Chile. <strong>2009</strong><br />
4 Más información en Ortega, Amorós, Sinn y Pizarro (<strong>2009</strong>) “GEM Mujeres y Actividad Empren<strong>de</strong>dora en Chile 2008-<strong>2009</strong>”. Disponible en www.gem<strong>chile</strong>.cl