Listado de Instalaciones del 2010-2011 - Ministerio de Salud
Listado de Instalaciones del 2010-2011 - Ministerio de Salud Listado de Instalaciones del 2010-2011 - Ministerio de Salud
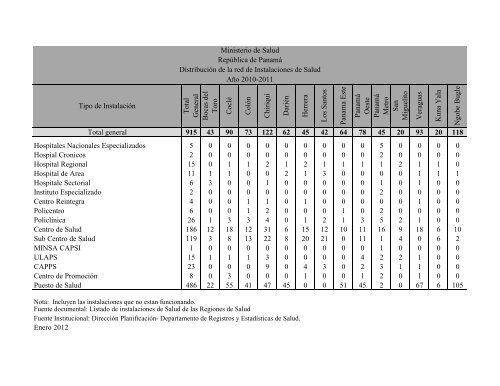
Total General Bocas del Toro Coclé Colón Chiriquí Darién Herrera Los Santos Panama Este Panamá Oeste Panamá Metro San Miguelito Veraguas Kuna Yala Ngobe Bugle Ministerio de Salud República de Panamá Distribución de la red de Instalaciones de Salud Año 2010-2011 Tipo de Instalación Total general 915 43 90 73 122 62 45 42 64 78 45 20 93 20 118 Hospitales Nacionales Especializados 5 0 0 0 0 0 0 0 0 0 5 0 0 0 0 Hospial Cronicos 2 0 0 0 0 0 0 0 0 0 2 0 0 0 0 Hospital Regional 15 0 1 1 2 1 2 1 1 1 1 2 1 1 0 Hospital de Area 11 1 1 0 0 2 1 3 0 0 0 0 1 1 1 Hospitale Sectorial 6 3 0 0 1 0 0 0 0 0 1 0 1 0 0 Instituto Especializado 2 0 0 0 0 0 0 0 0 0 2 0 0 0 0 Centro Reintegra 4 0 0 1 1 0 1 0 0 0 0 0 1 0 0 Policentro 6 0 0 1 2 0 0 0 1 0 2 0 0 0 0 Policlinica 26 1 3 3 4 0 1 2 1 3 5 2 1 0 0 Centro de Salud 186 12 18 12 31 6 15 12 10 11 16 9 18 6 10 Sub Centro de Salud 119 3 8 13 22 8 20 21 0 11 1 4 0 6 2 MINSA CAPSI 1 0 0 0 0 0 0 0 0 0 1 0 0 0 0 ULAPS 15 1 1 1 3 0 0 0 0 4 2 2 1 0 0 CAPPS 23 0 0 0 9 0 4 3 0 2 3 1 1 0 0 Centro de Promoción 8 0 3 0 0 0 1 0 0 1 2 0 1 0 0 Puesto de Salud 486 22 55 41 47 45 0 0 51 45 2 0 67 6 105 Nota: Incluyen las instalaciones que no estan funcionando. Fuente documental: Listado de instalaciones de Salud de las Regiones de Salud Fuente Institucional: Dirección Planificación- Departamento de Registros y Estadísticas de Salud. Enero 2012
- Page 4 and 5: Ministerio de Salud Dirección de P
- Page 6 and 7: Total MINSA C.S.S. Total MINSA C.S.
- Page 8 and 9: Total Sin Cama Con Cama Total Hospi
- Page 10 and 11: Total Sin Cama Con Cama Total Hospi
- Page 14 and 15: REGIÓN DE SALUD DE BOCAS EL TORO L
- Page 17 and 18: REGION DE SALUD DE COCLÉ LISTADO D
- Page 19 and 20: REGION DE SALUD DE COCLÉ LISTADO D
- Page 22 and 23: REGION DE SALUD DE COLÓN LISTADO D
- Page 24 and 25: REGION DE SALUD DE COLÓN LISTADO D
- Page 27 and 28: REGION DE SALUD DE CHIRIQUÍ LISTAD
- Page 29 and 30: REGION DE SALUD DE CHIRIQUÍ LISTAD
- Page 31 and 32: REGION DE SALUD DE CHIRIQUÍ LISTAD
- Page 34 and 35: REGION DE SALUD DE DARIEN LISTADO D
- Page 36: REGION DE SALUD DE DARIEN LISTADO D
- Page 39 and 40: REGIÓN DE SALUD DE HERRERA LISTADO
- Page 42 and 43: REGION DE SALUD DE LOS SANTOS LISTA
- Page 45 and 46: REGION DE SALUD DE PANAMA ESTE LIST
- Page 47: REGION DE SALUD DE PANAMA ESTE LIST
- Page 50 and 51: REGION DE SALUD DE PANAMÁ OESTE LI
- Page 52: REGION DE SALUD DE PANAMÁ OESTE LI
- Page 55 and 56: REGION DE SALUD DE PANAMÁ METRO LI
- Page 58 and 59: REGION DE SALUD DE SAN MIGUELITO LI
- Page 61 and 62: REGIÓN DE SALUD DE VERAGUAS LISTAD
Total<br />
General<br />
Bocas <strong>de</strong>l<br />
Toro<br />
Coclé<br />
Colón<br />
Chiriquí<br />
Darién<br />
Herrera<br />
Los Santos<br />
Panama Este<br />
Panamá<br />
Oeste<br />
Panamá<br />
Metro<br />
San<br />
Miguelito<br />
Veraguas<br />
Kuna Yala<br />
Ngobe Bugle<br />
<strong>Ministerio</strong> <strong>de</strong> <strong>Salud</strong><br />
República <strong>de</strong> Panamá<br />
Distribución <strong>de</strong> la red <strong>de</strong> <strong>Instalaciones</strong> <strong>de</strong> <strong>Salud</strong><br />
Año <strong>2010</strong>-<strong>2011</strong><br />
Tipo <strong>de</strong> Instalación<br />
Total general 915 43 90 73 122 62 45 42 64 78 45 20 93 20 118<br />
Hospitales Nacionales Especializados 5 0 0 0 0 0 0 0 0 0 5 0 0 0 0<br />
Hospial Cronicos 2 0 0 0 0 0 0 0 0 0 2 0 0 0 0<br />
Hospital Regional 15 0 1 1 2 1 2 1 1 1 1 2 1 1 0<br />
Hospital <strong>de</strong> Area 11 1 1 0 0 2 1 3 0 0 0 0 1 1 1<br />
Hospitale Sectorial 6 3 0 0 1 0 0 0 0 0 1 0 1 0 0<br />
Instituto Especializado 2 0 0 0 0 0 0 0 0 0 2 0 0 0 0<br />
Centro Reintegra 4 0 0 1 1 0 1 0 0 0 0 0 1 0 0<br />
Policentro 6 0 0 1 2 0 0 0 1 0 2 0 0 0 0<br />
Policlinica 26 1 3 3 4 0 1 2 1 3 5 2 1 0 0<br />
Centro <strong>de</strong> <strong>Salud</strong> 186 12 18 12 31 6 15 12 10 11 16 9 18 6 10<br />
Sub Centro <strong>de</strong> <strong>Salud</strong> 119 3 8 13 22 8 20 21 0 11 1 4 0 6 2<br />
MINSA CAPSI 1 0 0 0 0 0 0 0 0 0 1 0 0 0 0<br />
ULAPS 15 1 1 1 3 0 0 0 0 4 2 2 1 0 0<br />
CAPPS 23 0 0 0 9 0 4 3 0 2 3 1 1 0 0<br />
Centro <strong>de</strong> Promoción 8 0 3 0 0 0 1 0 0 1 2 0 1 0 0<br />
Puesto <strong>de</strong> <strong>Salud</strong> 486 22 55 41 47 45 0 0 51 45 2 0 67 6 105<br />
Nota: Incluyen las instalaciones que no estan funcionando.<br />
Fuente documental: <strong>Listado</strong> <strong>de</strong> instalaciones <strong>de</strong> <strong>Salud</strong> <strong>de</strong> las Regiones <strong>de</strong> <strong>Salud</strong><br />
Fuente Institucional: Dirección Planificación- Departamento <strong>de</strong> Registros y Estadísticas <strong>de</strong> <strong>Salud</strong>.<br />
Enero 2012


