Trabajo Infantil. Estudio de opinión pública en el Perú, 2007
Trabajo Infantil. Estudio de opinión pública en el Perú, 2007
Trabajo Infantil. Estudio de opinión pública en el Perú, 2007

You also want an ePaper? Increase the reach of your titles
YUMPU automatically turns print PDFs into web optimized ePapers that Google loves.
. . . . . . . . . . . . . . . . . . . . . . . . . . . . l a m i r a d a d e s d e l a o p i n i ó n p ú b l i c a<br />
35<br />
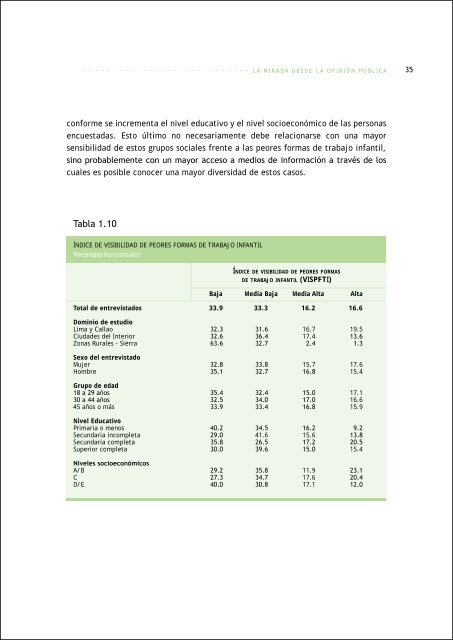
conforme se increm<strong>en</strong>ta <strong>el</strong> niv<strong>el</strong> educativo y <strong>el</strong> niv<strong>el</strong> socioeconómico <strong>de</strong> las personas<br />
<strong>en</strong>cuestadas. Esto último no necesariam<strong>en</strong>te <strong>de</strong>be r<strong>el</strong>acionarse con una mayor<br />
s<strong>en</strong>sibilidad <strong>de</strong> estos grupos sociales fr<strong>en</strong>te a las peores formas <strong>de</strong> trabajo infantil,<br />
sino probablem<strong>en</strong>te con un mayor acceso a medios <strong>de</strong> información a través <strong>de</strong> los<br />
cuales es posible conocer una mayor diversidad <strong>de</strong> estos casos.<br />
Tabla 1.10<br />
ÍNDICE DE VISIBILIDAD DE PEORES FORMAS DE TRABAJO INFANTIL<br />
Porc<strong>en</strong>tajes horizontales<br />
Índice <strong>de</strong> visibilidad <strong>de</strong> peores formas<br />
<strong>de</strong> trabajo infantil (VISPFTI)<br />
Baja Media Baja Media Alta Alta<br />
Total <strong>de</strong> <strong>en</strong>trevistados<br />
33.9<br />
33.3<br />
16.2<br />
16.6<br />
Dominio <strong>de</strong> estudio<br />
Lima y Callao<br />
Ciuda<strong>de</strong>s <strong>de</strong>l Interior<br />
Zonas Rurales - Sierra<br />
32.3<br />
32.6<br />
63.6<br />
31.6<br />
36.4<br />
32.7<br />
16.7<br />
17.4<br />
2.4<br />
19.5<br />
13.6<br />
1.3<br />
Sexo <strong>de</strong>l <strong>en</strong>trevistado<br />
Mujer<br />
Hombre<br />
32.8<br />
35.1<br />
33.8<br />
32.7<br />
15.7<br />
16.8<br />
17.6<br />
15.4<br />
Grupo <strong>de</strong> edad<br />
18 a 29 años<br />
30 a 44 años<br />
45 años o más<br />
35.4<br />
32.5<br />
33.9<br />
32.4<br />
34.0<br />
33.4<br />
15.0<br />
17.0<br />
16.8<br />
17.1<br />
16.6<br />
15.9<br />
Niv<strong>el</strong> Educativo<br />
Primaria o m<strong>en</strong>os<br />
Secundaria incompleta<br />
Secundaria completa<br />
Superior completa<br />
40.2<br />
29.0<br />
35.8<br />
30.0<br />
34.5<br />
41.6<br />
26.5<br />
39.6<br />
16.2<br />
15.6<br />
17.2<br />
15.0<br />
9.2<br />
13.8<br />
20.5<br />
15.4<br />
Niv<strong>el</strong>es socioeconómicos<br />
A/B<br />
C<br />
D/E<br />
29.2<br />
27.3<br />
40.0<br />
35.8<br />
34.7<br />
30.8<br />
11.9<br />
17.6<br />
17.1<br />
23.1<br />
20.4<br />
12.0