P01 03 45-volumen 2.pdf - Biblioteca de la ANA.
P01 03 45-volumen 2.pdf - Biblioteca de la ANA.
P01 03 45-volumen 2.pdf - Biblioteca de la ANA.

You also want an ePaper? Increase the reach of your titles
YUMPU automatically turns print PDFs into web optimized ePapers that Google loves.
REPÚBLICA DEL PERU<br />
OFICINA NACIONAL DE EVALUACIÓN<br />
DE RECURSOS NATURALES<br />
ON ER N<br />
*<br />
10, EVALUACIO<br />
DE LOS REO ÜRSOS NATURA<br />
NORTE DEL I<br />
Y USO RACIONAL<br />
WES DE LA ZONA<br />
EPARTAMENTO OMffiBlE<br />
JULIO 1977<br />
Volumen II<br />
ANEXOS Y MAPAS
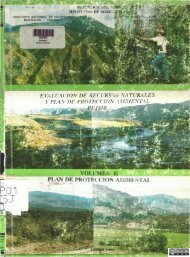
R.L p U BLJC A pJi L J'3 RU_<br />
OFICINA NACIONAL DE EVALUACIÓN DE RECURSOS NATURALES<br />
(ONERN )<br />
INVEN1ARIO, EVALUACIÓN Y USO RACIONAL DE LOS RECURSOS NATURALES<br />
DE LA ZONA NORTE DE CAJAMARCA<br />
VOLUMEN II<br />
Lima - Perú<br />
- 1977-
INVENTARIO. EVALUACIÓN Y USO RACIONAL DE LOS RECURSOS NATURALES<br />
DE LA ZONA<br />
NORTE DE CAIAMARCA<br />
INDIC E<br />
VOLUMEN<br />
II<br />
Página<br />
CAPITULO XI DIAGNOSTICO ECONÓMICO DEL SECTOR AGROPECUARIO 377<br />
A. Generalida<strong>de</strong>s 377<br />
1. Descripción general <strong>de</strong>l estudio 377<br />
2, Metodología 378<br />
B. Estructura <strong>de</strong> <strong>la</strong> producción agropecuaria 379<br />
1. Area <strong>de</strong> producción agríco<strong>la</strong> . 379<br />
2. Características <strong>de</strong> <strong>la</strong> actividad agropecuaria 383<br />
3. Volumen y valor <strong>de</strong> <strong>la</strong> producción agropecuaria .... 385<br />
4. Factores jle producción 393<br />
5. Factores institucionales , , 414<br />
6. Análisis económico <strong>de</strong> los factores <strong>de</strong> producción 432<br />
C. Estructura <strong>de</strong> <strong>la</strong> comercialización <strong>de</strong> los productos agro"<br />
pecuarios .,....,. <strong>45</strong>0<br />
1. Aspectos generales <strong>45</strong>0<br />
2. Comercialización <strong>de</strong> los principales productos agro"<br />
pecuarios. ..,..., <strong>45</strong>8<br />
3. Otras activida<strong>de</strong>s económicas 476<br />
D. Conclusiones y Recomendaciones . 489<br />
1. Conclusiones referentes a <strong>la</strong> estructura <strong>de</strong> producción . 489<br />
2. Conclusiones referentes a <strong>la</strong> estructura <strong>de</strong> comercialización.<br />
493<br />
3. Conclusiones referentes a <strong>la</strong> agroindustria, artesanía y<br />
turismo 494<br />
4. Recomendaciones referentes a <strong>la</strong> estructura <strong>de</strong> producción.<br />
, 495<br />
5. Recomendaciones sobre <strong>la</strong> estructura <strong>de</strong> comercializa<br />
ción , ,<br />
6» Recomendaciones referentes a <strong>la</strong> agroindustria, arte"<br />
sanfa y turismo 500<br />
ANEXOS<br />
I CARACTERÍSTICAS GENERALES 1<br />
II CLIMATOLOGÍA 9<br />
III ECOLOGÍA 26<br />
IV SUELOS 52<br />
V RECURSOS HIDRICOS 81<br />
VI DIAGNOSTICO AGROPECUARIO. 115
- II -<br />
MAPAS DEL ANEXO<br />
M»pa N* 1 Climatológico, esca<strong>la</strong> 1:200,000<br />
Mapa N° 2 Ecológico y Aptitud Forestal, esca<strong>la</strong> 1:200,000<br />
Mapa N° 3 Agrostológico, esca<strong>la</strong> 1:200,000<br />
Mapa N* 4 Geológico y Minero, esca<strong>la</strong> 1:200,000<br />
Mapa N" 5 Hidrológico y <strong>de</strong> Transportes, esca<strong>la</strong> 1:200,000<br />
Mapa N s 6 Gran<strong>de</strong>s Grupos <strong>de</strong> Suelos, esca<strong>la</strong> 1:100,000 ( oj^s 1 y 2)<br />
Mapa N° 7 Grupos <strong>de</strong> Capacidad <strong>de</strong> Uso Mayor <strong>de</strong> <strong>la</strong>s Tierras, esca<strong>la</strong> 1:100,000 ("lojas ] y 2)<br />
Mapa N* 8 Sistema <strong>de</strong> Riego ( Zonas Cutervo, Cochabamba y Conchan ), esca<strong>la</strong> 1:50,000<br />
Mapa N" 9 Sistema <strong>de</strong> Riego ( Zona Chota y Bambamarca '), esca<strong>la</strong> 1:50,000<br />
»»"0 """
DIAGNOSTICO AGROPECUARIO<br />
P¿r. 3',-,<br />
CAPITULO<br />
XI<br />
DIAGNOSTICO ECONÓMICO DEL SECTOR AGROPECUARIO<br />
A. GENERALIDADES<br />
1 . Descripción General <strong>de</strong>l Estudio<br />
El presente diagnóstico agropecuario tiene como objetivo principal<br />
i<strong>de</strong>ntificar y analizar los aspectos re<strong>la</strong>cionados con <strong>la</strong> utilización <strong>de</strong> los recursos existentes<br />
en <strong>la</strong> zona estudiada con fines agropecuarios. También se han consi<strong>de</strong>rado los factores eco<br />
nómicos e institucionales que intervienen en el proceso productivo, <strong>de</strong>tectando ios proble -<br />
mas que limitan su <strong>de</strong>sarrollo y obteniendo, <strong>de</strong> esta manera, los elementos <strong>de</strong> ¡uicio que per<br />
mitán formu<strong>la</strong>r sugerencias y precisar alternativas para el mejor uso <strong>de</strong> los recursos natura -<br />
les.<br />
El estudio compren<strong>de</strong> el análisis <strong>de</strong> los aspectos re<strong>la</strong>cionados con <strong>la</strong><br />
estructura <strong>de</strong> <strong>la</strong> producción, <strong>de</strong> <strong>la</strong> comercialización y <strong>de</strong> los factores institucionales <strong>de</strong> apo<br />
yo, incluyendo el inventario y análisis <strong>de</strong> <strong>la</strong> situación <strong>de</strong> <strong>la</strong>s industrias ligadas al sector a<br />
gropecuario y el análisis y perspectivas <strong>de</strong> <strong>de</strong>sarrollo <strong>de</strong> los sectores artesanal y turisrico.<br />
i- El análisis <strong>de</strong> <strong>la</strong> estructura <strong>de</strong> producción permitió <strong>de</strong>terminar el<br />
área anual <strong>de</strong> producción agrrco<strong>la</strong> y <strong>la</strong> pob<strong>la</strong>ción pecuaria, así como sus rendimientos unita<br />
rios; tomando como base esta información, se pudo estimar el <strong>volumen</strong> y valor <strong>de</strong> <strong>la</strong> produc<br />
ción agropecuaria En igual forma, se realizó un examen <strong>de</strong> los factores económicos que in<br />
tervienen en el proceso <strong>de</strong> <strong>la</strong> producción (tierra, mano <strong>de</strong> obra y capital), asi" como <strong>de</strong> los<br />
factores exógenos que, en este caso, están representados por <strong>la</strong> asistencia técnica y credit!<br />
cía que proporcionan <strong>la</strong>s instituciones públicas y privadas al sector.<br />
En cuanto a <strong>la</strong> estructura <strong>de</strong> comercialización agropecuaria, se es'-u<br />
dio <strong>la</strong> oferta, <strong>la</strong> <strong>de</strong>man<strong>de</strong> y <strong>la</strong> compra-venta <strong>de</strong> los principales productos, asf como los cervicios<br />
<strong>de</strong> comercialización existentes.<br />
La zona estudiada ha sido dividida, para los efectos <strong>de</strong>l estudio, en<br />
dos sectores- Sector I o Norte y Sector I! o Sur, ambos integrados por subsectores o provincias<br />
y és*as, a su vez, por un conj unto <strong>de</strong> distritos, cubriendo en total una extensión <strong>de</strong><br />
550,000 !¡'a. Este división fue <strong>de</strong>terminada por <strong>la</strong> influencia que tienen <strong>la</strong>s carreteras que<br />
conducen <strong>de</strong>s<strong>de</strong> ia zona <strong>de</strong> estudio hacia Chic<strong>la</strong>yo (Sector I) y Trujillo (Sector 11), respect:
Pág. 378 ZONA NORTE DE CAJAMARCA<br />
vamente, motivando que por el flujo <strong>de</strong> <strong>la</strong>s re<strong>la</strong>ciones comerciales y el nexo político admi<br />
ni strati vo* que existe en cada sector se comporten como unida<strong>de</strong>s geoeconómicas en <strong>la</strong> ma -<br />
yoría <strong>de</strong> los casos (Cuadro N 0 1 -DA).<br />
CUADRO N 0 1-DA<br />
ÁMBITO GEOGRÁFICO DE LA ZONA DE ESTUDIO<br />
Sectores<br />
1 (Norte)<br />
Subsectores<br />
Cutervo<br />
Chota<br />
Santa Cruz<br />
Hualgayoc<br />
Distritos<br />
Cutervo, Sócota y San Andrés <strong>de</strong> Cutervo.<br />
Chota, Cochabamba, Lajas, Chiguiríp y Conchan.<br />
Uticyacu, Yauyucán y Ninabamba.<br />
Bambamarca, Hualgayoc y Chugur,<br />
11 (Sur)<br />
Cajamarca<br />
San Miguel<br />
Contumazá<br />
Chetil<strong>la</strong>, San Juan, San Pablo, Asunción y Magdalena.<br />
San Miguel <strong>de</strong> Pallóquez, L<strong>la</strong>pa, Calquis y Cochan<br />
Contumazá, Santa Cruz <strong>de</strong> Toledo, Tantarica y Chilete<br />
2. MetodologTa<br />
El diagnóstico <strong>de</strong>l sector agropecuario fue e<strong>la</strong>borado siguiendo una<br />
secuencia <strong>de</strong> cuatro etapas. La primera consistió en <strong>la</strong> recopi<strong>la</strong>ción y c<strong>la</strong>sificación <strong>de</strong> <strong>la</strong><br />
información estadística existente <strong>de</strong> los sectores público y privado, incluyendo los trabajos<br />
y estudios realizados en <strong>la</strong> zona poi entida<strong>de</strong>s nacionales y/o internacionales.<br />
La segunda etapa comprendió los estudios <strong>de</strong> campo, los cuales fueron<br />
efectuados mediante encuestas a los agricultores y entrevistas a los representantes délos<br />
organismos que prestan servicios al sector en forma directa, asf como a instituciones y perso<br />
ñas re<strong>la</strong>cionadas indirectamente con <strong>la</strong> actividad agropecuaria, incluyendo también a repre<br />
sentantes <strong>de</strong> otros sectores, como el industrial y el comercial.<br />
La tercera etapa se refiere a los estudios <strong>de</strong> gabinete, que consistió<br />
en el or<strong>de</strong>namiento y consolidación <strong>de</strong> <strong>la</strong> información <strong>de</strong> campo, re<strong>la</strong>cionándo<strong>la</strong> con <strong>la</strong> in -<br />
formación existente. Finalmente, <strong>la</strong> cuarta etapa comprendió <strong>la</strong> e<strong>la</strong>boración, el procesa -<br />
miento y el análisis <strong>de</strong> <strong>la</strong> información, así como <strong>la</strong> redacción y revisión <strong>de</strong>l informe final.
DIAGNOSTICO AGROPECUARIO Pág. 370<br />
Para <strong>de</strong>terminar el área <strong>de</strong> cultivo <strong>de</strong> <strong>la</strong> zona en estudio, se ha to -<br />
mado como base los resultados censales obtenidos por CENAGRO 1972 (Censo Nacional A-<br />
gropecuario <strong>de</strong> 1972), cuyos datos sobre áreas cultivadas han sido consolidados a nivel <strong>de</strong><br />
unidad agropecuaria sin consi<strong>de</strong>rar el régimen <strong>de</strong> tenencia, <strong>la</strong> condición jundica ni el tamaño.<br />
En cambio, para establecer los rendimientos promedio <strong>de</strong> producción<br />
agríco<strong>la</strong> (Kg./Hao), <strong>la</strong> información estadística existente proporciona resultados muy variados,<br />
que no coinci<strong>de</strong>n con los obtenidos por ONERN. Esta diferencia posiblemente <strong>de</strong>be<br />
ser atribuida a <strong>la</strong> época en que se realizó el muestreo, a <strong>la</strong> heterogeneidad fisiogrófica <strong>de</strong><br />
<strong>la</strong> zona; a <strong>de</strong>fectos y/o errores <strong>de</strong> apreciación, a diferentes criterios y niveles <strong>de</strong> estudio<br />
y a <strong>la</strong>s variaciones anuales en <strong>la</strong> producción que se observan en una localidad, ya que gran<br />
parte <strong>de</strong> <strong>la</strong> actividad agríco<strong>la</strong> se realiza bajo el régimen <strong>de</strong> lluvias temporales (secano). El<br />
Cuadro N 0 2-DA muestra los promedios <strong>de</strong> rendimiento en los cultivos <strong>de</strong> trigo, maíz y pa -<br />
pa que obtuvieron en el año 1974 <strong>la</strong>s diversas instituciones que operan en <strong>la</strong> zona, obser -<br />
vándose <strong>la</strong> gran variabilidad en <strong>la</strong> información proporcionada, <strong>la</strong> cual si no es bien analiza<br />
da pue<strong>de</strong> distorsionar <strong>la</strong>s evaluaciones que se realicen.<br />
CUADRO N 0 2-DA<br />
FUENTE DE INFORMACIÓN ESTADÍSTICA DE LA PRODUCCIÓN DE CAJAMARCA<br />
(1974)<br />
Fuentes<br />
Proyecto Piloto Cajamarca - La Libertad<br />
Estadística Agraria<br />
Banco <strong>de</strong> Fomento Agropecuario <strong>de</strong>l Perú.<br />
Instituto <strong>de</strong> Educación RuraL<br />
Censo Nacional Agropecuario 1972 o<br />
Ministerio <strong>de</strong> Agricultura (Estadística Agraria).<br />
Promedios <strong>de</strong> Rendimiento i<br />
Trigo Maíz Papa ¡<br />
Kg./Ha. Kg./Ha. Kg./Ha. I<br />
2<strong>45</strong><br />
900<br />
1,200<br />
300<br />
290<br />
800<br />
294<br />
1,200<br />
1,800<br />
390<br />
340<br />
600<br />
1,074 ¡<br />
7,500 1<br />
5,000 !<br />
3,500 1<br />
1,790 ;<br />
9,800 ;<br />
B. ESTRUCTURA DE LA PRODUCCIÓN AGROPECUARIA<br />
1. Area <strong>de</strong> Producción Agríco<strong>la</strong><br />
La zona estudiada abarca una extensión total <strong>de</strong> 550,000 Ha., y<br />
compren<strong>de</strong>, según el CENAGRO, un área agríco<strong>la</strong> He 84,517 Ha., equivalente al 15.4%<br />
<strong>de</strong>l total. En el Cuadro N 0 3-DA, se muestra que el 61.0% <strong>de</strong>l área agríco<strong>la</strong> está concentrada<br />
en el Sector I (Norte). Respecto a los subsectores, ellos tienen extensiones <strong>de</strong> culti -<br />
vo semejantes, con excepción <strong>de</strong> Sania Cruz y Contumazá que, en conjunto, sólo disponen
Pag. 380 ZONA NORTE DE CAJAMARC.N<br />
<strong>de</strong>l 7.3% <strong>de</strong>l área total.<br />
Con fines <strong>de</strong> análisis, en cada subsector los cultivos fueron agrupa<br />
dos en industriales, alimenticios y pastos y forrajes, habiéndose <strong>de</strong>terminado también a ese<br />
nivel, el área anual <strong>de</strong> producción para los cultivos bajo riego y al secano, sistema este<br />
que representa el 82.2% <strong>de</strong>l total. Cabe ac<strong>la</strong>rar que, en todos los subsectores, existen<br />
áreas <strong>de</strong> rotación (en <strong>de</strong>scanso o empastadas), que se estima equivalen al 15 o 20% <strong>de</strong>l área<br />
anual <strong>de</strong> producción.<br />
En el Cuadro N 0 1 <strong>de</strong>l Anexo VI, se muestra que el área cultiva -<br />
da en el Sector I (Norte) alcanzó a 51,599 Ha., <strong>de</strong> <strong>la</strong>s cuales 47,590 Ha. son <strong>de</strong> secano y<br />
4,009 Ha. están bajo riego, predominando en conjunto los cultivos alimenticios, que ocupan<br />
el 92.3% <strong>de</strong>l área total; en este grupo, <strong>de</strong>stacan el maiz, <strong>la</strong> papa y <strong>la</strong> cebada, con el<br />
50*6%, el 11 .0% y el 10.3% <strong>de</strong>l área cultivada, respectivamente.<br />
En el subsector <strong>de</strong> Cutervo, el área anual <strong>de</strong> producción fue <strong>de</strong> 16,081 Ha , <strong>de</strong> <strong>la</strong>scua<br />
Íes 15,154 Ha. son <strong>de</strong> secano y 927 Ha„ bajo riego, en <strong>la</strong>s que predominan los cultivos<br />
<strong>de</strong> maíz, otros forrajes y arveja grano seco, con el 52,3%, el 10.2% y el 10.1% <strong>de</strong>l<br />
total, respectivamente.<br />
En el subsector <strong>de</strong> Chota, el área anual <strong>de</strong> producción fue <strong>de</strong> 16,423 Ha., <strong>de</strong> <strong>la</strong>s cuales<br />
15,380 Ha. son <strong>de</strong> secano y 1,043 Ha. bajo riego, predominando los cultivos <strong>de</strong><br />
maíz, <strong>de</strong> papa y <strong>de</strong> arveja grano seco, ya que ocupan el 58.7%, el 11..0% y el 8.6%<br />
<strong>de</strong>l área total, respectivamente.<br />
En el subsector <strong>de</strong> Santa Cruz, el área anual <strong>de</strong> producción fue <strong>de</strong> 1,993 Ha., <strong>de</strong> <strong>la</strong>s<br />
cuales 1,944 Ha. son <strong>de</strong> secano y 49 Ha; bajo riego, en <strong>la</strong>s que predominan los cultivos<br />
<strong>de</strong> maíz y <strong>de</strong> papa, cubriendo el 67.8% y el 8.0% <strong>de</strong>l área total, respectivamen -<br />
te.<br />
En el subsector <strong>de</strong> Hualgayoc, el área anual <strong>de</strong> producción fue <strong>de</strong> 17,102 Ha., <strong>de</strong> <strong>la</strong>s<br />
cuales 15,112 Ha, son <strong>de</strong> secano y 1,990 Ha. bajo riego, en <strong>la</strong>s que predominan los<br />
cultivos <strong>de</strong> maiz, <strong>de</strong> cebada y <strong>de</strong> papa, ocupando el 32.2%, el 19.1% y el 17.3%<strong>de</strong>l<br />
áiea seña<strong>la</strong>da.<br />
En el Cuadro N 0 2 <strong>de</strong>l Anexo VI, se muestra que el área anual <strong>de</strong><br />
producción en el Sector ¡I (Sur" 1 , fue <strong>de</strong> 32,918 Ha , <strong>de</strong> <strong>la</strong>s cuales 21,874 Ha. son <strong>de</strong> seca<br />
no y 11,044 Ha. bajo riego, predominando los cultivos alimenfic'os, que cubren el 90.3/<br />
•Je! área total; en este sector, <strong>de</strong>stacan los cultivos <strong>de</strong> cebada, <strong>de</strong> maíz, <strong>de</strong> trigo / <strong>de</strong> pa -<br />
oc, que abarcan el 22 3%, el 22^%, e! 13,6% y el 8.8% <strong>de</strong>l área foia!, respec-ivomenre<br />
Fn el subsector <strong>de</strong> CaJT^a'ca, e! área anual <strong>de</strong> producción fue <strong>de</strong> 1 7,61 6 he, do <strong>la</strong>:<br />
cuales T3,3ó8 Ha, son <strong>de</strong> secano y 4,248 Ha. bajo riego, en <strong>la</strong>s que predominan los<br />
cultivos <strong>de</strong> cebada, <strong>de</strong> maíz, <strong>de</strong> trigo y <strong>de</strong> papa, que ocupan e! 25.2%, e! 72 4%, el<br />
11 6% y el 8.1%, respectivarrente, <strong>de</strong>l área seña<strong>la</strong>da.
DIAGNOSTICO AGROPECUARIO Pág. 381<br />
CUADRO N 0 3-DA<br />
AREA DE PRODUCCIÓN AGRÍCOLA POR SECTORES<br />
1972<br />
Sectores<br />
Area Bajo Riego<br />
Area en Secano<br />
Total<br />
Ha.<br />
%<br />
Ha.<br />
%<br />
Ha.<br />
%<br />
1 (Norte)<br />
4,009<br />
26.6<br />
47,590<br />
68.5<br />
51,599<br />
61.0<br />
Cutervo<br />
Chota<br />
Santa Cruz<br />
Hualgayoc<br />
927<br />
1,043<br />
49<br />
1,990<br />
6.2<br />
6.9<br />
0.3<br />
13.2<br />
15,154<br />
15,380<br />
1,944<br />
15,112<br />
21.8<br />
22.1<br />
2.8<br />
21.8<br />
16,081<br />
16,423<br />
1,993<br />
17,102<br />
19.0<br />
19.4<br />
2.4<br />
20.2<br />
II (Sur)<br />
11,044<br />
73.4<br />
21,874<br />
31.5<br />
32,918<br />
39.0<br />
Ca¡amarca<br />
San Miguel<br />
Contumazá<br />
4,248<br />
4,918<br />
1,878<br />
28.2<br />
32.7<br />
12.5<br />
13,368<br />
6,255<br />
2,251<br />
19.2<br />
9.1<br />
3.2<br />
17,616<br />
11,173<br />
4,129<br />
20.8<br />
13.3<br />
4.9<br />
Total<br />
15,053<br />
100.0<br />
69,464<br />
100.0<br />
84,517<br />
100.0<br />
Porcentaje<br />
17.8%<br />
82.2%<br />
100.0%<br />
Fuente: CENAG kO, 1972.<br />
En el subsector <strong>de</strong> San Miguel, el área anual <strong>de</strong> producción fue <strong>de</strong> 11,173 Ha., <strong>de</strong><br />
<strong>la</strong>s cuales 6,255 Ha. son <strong>de</strong> secano y 4,918 Ha. bajo riego, en <strong>la</strong>s que predominan<br />
los cultivos <strong>de</strong> maíz, <strong>de</strong> cebada, <strong>de</strong> papa y <strong>de</strong> trigo, que cubren el 22.5%, el 21 .0%,<br />
el 11 „!% y el 9.6% <strong>de</strong>l área total respectivamente.<br />
En el subsector <strong>de</strong> Contumazá, el área anual <strong>de</strong> producción fue <strong>de</strong> 4,129 Ha., <strong>de</strong> <strong>la</strong>s<br />
cuales 2,251 Ha. son <strong>de</strong> secano y 1,878 Ha. bajo riego, en <strong>la</strong>s que predominan los<br />
cultivos <strong>de</strong> trigo, <strong>de</strong> mafz y <strong>de</strong> cebada, que ocupan el 32.5%, el 20.3% y el 13.0%<br />
<strong>de</strong>l área total, respectivamente.<br />
En el Cuadro N 0 4-DA, se muestra que el área anual <strong>de</strong> producción<br />
total alcanza a 84,517 Ha., <strong>de</strong> <strong>la</strong>s cuales 69,464 Ha. son cultivadas en secano y 15,053<br />
Ha. bajo riego, <strong>de</strong>stacando los cultivos alimenticios con el 91.6% <strong>de</strong>l área total, siendo<br />
menor <strong>la</strong> participación <strong>de</strong> los pastos y forrajes y <strong>de</strong> los cultivos industriales. Entre los cul<br />
tivos alimenticios, los más importantes son los cereales (maíz y cebada) y los tubérculos y<br />
raices (papa y otros), que abarcan el 61 ,1% y el 18.2% <strong>de</strong>l área total, respectivamente.<br />
En el estudio <strong>de</strong> suelos realizados por ONERN, se ha <strong>de</strong>terminado<br />
que existen importantes áreas <strong>de</strong> suelos <strong>de</strong>l grupo N" 1 que, en conjunto, equivalen a
Pág„ 382 ZONA NORTF DE CAJAMARCA<br />
CUADRO N 0 4-DA<br />
AREA FÍSICA DE PRODUCCIÓN POR CULTIVOS<br />
Cultivos<br />
1974-1975<br />
Area Bajo<br />
Riego<br />
Ha 0<br />
Area en<br />
Secano<br />
Ha,<br />
Area T otal<br />
Ha„<br />
%<br />
1, Industriales<br />
539<br />
1,151<br />
1,690<br />
2„0<br />
Caña <strong>de</strong> azúcar<br />
Café<br />
Otros cultivos ( x l j<br />
478<br />
35<br />
26<br />
919<br />
216<br />
16<br />
1,397<br />
251<br />
42<br />
1,7<br />
0 o 3<br />
0 0<br />
II<br />
AÜmenHcios<br />
12,636<br />
64,763<br />
77,399<br />
9K6<br />
1 . Menestras<br />
Frijol<br />
Arveja<br />
Haba<br />
Lenteja<br />
318<br />
577<br />
17<br />
52<br />
564<br />
5,199<br />
385<br />
727<br />
882<br />
5,776<br />
402<br />
779<br />
1,0<br />
6,8<br />
0 5<br />
0,9<br />
2.. Cereales<br />
Maíz ('2)<br />
Arroz<br />
Cebada<br />
Trigo<br />
Otros cereales p3)<br />
4,923<br />
734<br />
1,162<br />
607<br />
29<br />
28,476<br />
9<br />
11,500<br />
4,096<br />
89<br />
33,399<br />
743<br />
12,662<br />
4,7<strong>03</strong><br />
118<br />
39 0 5<br />
0,9<br />
15,0<br />
5 6<br />
0 1<br />
3 Hortalizas<br />
Vanas hortalizas (*A)<br />
Arveja grano ver<strong>de</strong><br />
192<br />
279<br />
¡76<br />
l f 466<br />
368<br />
1,7<strong>45</strong><br />
0 4<br />
2J<br />
4 Iuberosas y Raíces<br />
Papa<br />
O ¡luco<br />
Camote<br />
Yuca<br />
Oca<br />
Otros ("5}<br />
2,<strong>45</strong>0<br />
63<br />
283<br />
486<br />
71<br />
12<br />
6,125<br />
2,406<br />
541<br />
297<br />
1,924<br />
702<br />
8,575<br />
2,469<br />
824<br />
783<br />
1,995<br />
714<br />
lOol<br />
2,9<br />
1 0<br />
0 9<br />
2 3 4<br />
0,9<br />
5 Frutales<br />
Plátanos<br />
Cítricos<br />
Otros frutales (*6)<br />
2<strong>03</strong><br />
31<br />
147<br />
52<br />
29<br />
255<br />
60<br />
147<br />
0,3<br />
0J<br />
0.2<br />
(continua)
DIAGNOSTICO AGROPECUARIO Pág. 383<br />
(continuación)<br />
Cultivos<br />
Area Bajo<br />
Riego<br />
Ha.<br />
Area en<br />
Secano<br />
Ha.<br />
Ha,<br />
Area Total<br />
%<br />
III.<br />
Pastos y Forrajes<br />
1,878<br />
3,550<br />
5,428<br />
6.4<br />
Alfalfa<br />
Trébol<br />
Mafz cha<strong>la</strong><br />
Otros forrajes (*7)<br />
481<br />
796<br />
41<br />
560<br />
85<br />
400<br />
142<br />
2,923<br />
566<br />
1,196<br />
183<br />
3,483<br />
0.7<br />
1.4<br />
0.2<br />
4.1<br />
Total<br />
15,053<br />
69,464<br />
84,517<br />
100.0<br />
Fuente: ONEC - CENAGRO 1972<br />
(*1), Incluye maní, coca, maguey y algodón<br />
(*2) Incluye maíz choclo.<br />
(*3) Incluye avena y centeno.<br />
(*4) Incluye tomate, zanahoria, cebol<strong>la</strong>, ajf, zapallo, ca<strong>la</strong>baza y col.<br />
(*5) Incluye pituca y arracacha.<br />
(*6) Incluye mango, chirimoyo, palto, manzano y pepino.<br />
(*7) Incluye gramalote, pasto elefante, sorgo forrajero y otros pastos contro<strong>la</strong>dos (kikuyo).<br />
93,500 Hoo y constituyen los mejores suelos para cultivos intensivos. Sin embargo, esa ex_<br />
tensión no se encuentra en uso permanente por diversos factores; en cambio, <strong>de</strong>terminadas<br />
areas <strong>de</strong> suelos <strong>de</strong> los grupos NT 2 y 3 y que totalizan 244,400 Ha,, se utilizan para cultivos<br />
agríco<strong>la</strong>s <strong>de</strong> pan!levar, lo que índica que, mediante p<strong>la</strong>nes racionales <strong>de</strong> uso <strong>de</strong> suelos,<br />
es factible incrementar ¡a frontera agríco<strong>la</strong> en forma significativa o Asimismo, <strong>la</strong> actividad<br />
pecuaria se <strong>de</strong>sarrol<strong>la</strong> en los suelos <strong>de</strong> los grupos N" 1, 2 y 3, que proporcionan rastrojos<strong>de</strong><br />
cosechas en el primer grupo, el manto herbáceo bajo que crece entre los cultivos permanen<br />
tes y bosques naturales en el segundo grupo y pastos naturales exclusivamente en el tercer<br />
grupo, quedando muchas áreas por utilizar; esta situación permite afirmar que también es<br />
posible ampliar <strong>la</strong> frontera pecuaria con el fin <strong>de</strong> intensificar esta actividad»<br />
2. Características <strong>de</strong> ¡a Actividad Agropecuaria<br />
La actividad agríco<strong>la</strong> se <strong>de</strong>senvuelve en <strong>la</strong> zona estudiada <strong>de</strong>ntro <strong>de</strong><br />
un marco socio-cultural y técnico muy especial, no estando muchas veces <strong>la</strong>s <strong>la</strong>bores liga -<br />
das a esta actividad regidas <strong>de</strong> acuerdo a <strong>la</strong>s leyes <strong>de</strong> <strong>la</strong> oferta y <strong>la</strong> <strong>de</strong>manda u otras <strong>de</strong> carácter<br />
utilitario, siendo llevada, por lo general, en forma tradicional y presentando muchas<br />
limitaciones. Tiene como característica principal <strong>la</strong> <strong>de</strong> ser permanente, porque no sólo in<br />
volucra <strong>de</strong>s<strong>de</strong> <strong>la</strong> preparación <strong>de</strong>l suelo hasta <strong>la</strong> cosecha, sino que requiere tiempo para <strong>la</strong><br />
preparación <strong>de</strong> implementos, selección <strong>de</strong> semil<strong>la</strong>s, compra <strong>de</strong> insumos, gestiones ante oficinas<br />
públicas (tanto <strong>de</strong> asistencia técnica como <strong>de</strong> crédito), preparación <strong>de</strong> envases, trans<br />
porte y comercialización <strong>de</strong> <strong>la</strong> producción y otros.
Pág. 384 ZONA NORTE DE CAJAMARCA<br />
La agricultura se <strong>de</strong>sarrol<strong>la</strong> en mayor proporción ba¡o un régimen <strong>de</strong><br />
lluvias y en climas variables, dado los diferentes niveles altitudinales don<strong>de</strong> se ubican <strong>la</strong>s<br />
unida<strong>de</strong>s <strong>de</strong> producción; esto explica <strong>la</strong> heterogénea composición <strong>de</strong> <strong>la</strong> cédu<strong>la</strong> <strong>de</strong> cultivos<br />
en cada uno <strong>de</strong> los subsectores que integran <strong>la</strong> zona <strong>de</strong> estudio.<br />
Respecto a <strong>la</strong> ubicación física <strong>de</strong> <strong>la</strong>s parce<strong>la</strong>s, pue<strong>de</strong> seña<strong>la</strong>rse que<br />
están situadas en terrenos que tienen pendientes que van <strong>de</strong>s<strong>de</strong> p<strong>la</strong>nas hasta muy empinadas<br />
(0 - 60%); es <strong>de</strong>cir, que son suelos marginales en los que muchas veces el proceso <strong>de</strong> ero -<br />
sión alcanza grados severos, que <strong>de</strong>terioran constantemente <strong>la</strong> estructura física y química <strong>de</strong><br />
<strong>la</strong>s áreas <strong>de</strong> cultivo, problema que no ha sido <strong>de</strong>bidamente enfocado, ya que se nota <strong>la</strong> ausencia<br />
<strong>de</strong> un p<strong>la</strong>n <strong>de</strong> conservación <strong>de</strong> suelos a nivel regional, siendo <strong>la</strong> construcción <strong>de</strong> terrazas<br />
<strong>de</strong> cultivo una práctica poco difundida„<br />
La actividad agríco<strong>la</strong> en <strong>la</strong> zona se <strong>de</strong>sarrol<strong>la</strong> con tres finalida<strong>de</strong>s :<br />
Cbtener alimentos <strong>de</strong>stinados preferentemente al autoconsumo.<br />
Como un medio <strong>de</strong> obtener semil<strong>la</strong>s para cubrir <strong>la</strong>s necesida<strong>de</strong>s <strong>de</strong> siembra <strong>de</strong> campañas<br />
futuras.<br />
Obtener exce<strong>de</strong>ntes <strong>de</strong>stinados a servir <strong>de</strong> base <strong>de</strong> intercambio a través <strong>de</strong>l "trueque"©<br />
bien comercializarlos en los centros urbanos.<br />
Por su extensión, a <strong>la</strong> mayoría <strong>de</strong> <strong>la</strong>s unida<strong>de</strong>s <strong>de</strong> producción se les<br />
cataloga como minifundio, con el agravante <strong>de</strong> que <strong>la</strong>s parce<strong>la</strong>s se encuentran en localida<strong>de</strong>s<br />
diferentes y, por lo general, alejadas entre sí. Asimismo, <strong>de</strong>bido a <strong>la</strong> heterogeneidad<br />
<strong>de</strong> microclimas presentes, hay^áreas que son c<strong>la</strong>sificadas como "maiceras" o "paperas" o<br />
"trigueras", etc., y su cultivo <strong>de</strong>manda esfuerzos adicionales y pérdidas <strong>de</strong> tiempo no cuan<br />
tificados en los análisis <strong>de</strong> costos.<br />
El uso <strong>de</strong> insumes es reducido, <strong>de</strong>bido al <strong>de</strong>sconocimiento técnico que<br />
supone su uso, así como a <strong>la</strong> carestía y escasez prevaleciente en <strong>la</strong> zona. Las semil<strong>la</strong>s <strong>de</strong><br />
varieda<strong>de</strong>s más difundidas están en función <strong>de</strong>l hábito <strong>de</strong> consumo <strong>de</strong> los agricultores <strong>de</strong> cada<br />
uno <strong>de</strong> los subsectores; así, se prefiere maíces amiláceas <strong>de</strong> amplia aceptación pero <strong>de</strong><br />
bajos rendimientos unitarios..<br />
La actividad pecuaria se lleva en forma tradicional y se <strong>de</strong>sarrol<strong>la</strong><br />
con <strong>la</strong> participación <strong>de</strong> animales criollos que se caracterizan por ser poco precoces y <strong>de</strong> ba<br />
¡o rendimiento, compuestos por <strong>la</strong>s especies vacuna, ovina, caprina, porcina, equina, aves<br />
y cuyes, que se distribuyen en todo el ámbito <strong>de</strong> <strong>la</strong> zona <strong>de</strong> estudio. Su <strong>de</strong>senvolvimiento<br />
está limitado por factores ecológicos, económicos, técnicos y socio-culturales, asícomopor<br />
<strong>la</strong> adaptación <strong>de</strong> especies y forrajes a los diferentes ecosistemas que conforman <strong>la</strong> zona, in<br />
fluyendo también el sistema <strong>de</strong> tenencia <strong>de</strong> <strong>la</strong> tierra.<br />
La <strong>de</strong>scapitalización manifiesta <strong>de</strong>l sector agrario y <strong>la</strong> restringida dis<br />
ponibilidad <strong>de</strong> recursos financieros impi<strong>de</strong>n adquirir animales con fines <strong>de</strong> mejoramiento genético,<br />
así como <strong>la</strong> construcción <strong>de</strong> <strong>la</strong> infraestructura que permita manejar racionalmente los<br />
recursos naturales y el ganado y procesar los productos obtenidos» Finalmente, en el aspecto<br />
socio-cultural, <strong>la</strong>s limitaciones más importantes son <strong>la</strong> falta <strong>de</strong> interés <strong>de</strong> los gana<strong>de</strong>ros
DIAGNOSTICO AGROPECUARIO Pág. 385<br />
por ocupar <strong>la</strong>s partes altas <strong>de</strong> <strong>la</strong> región, don<strong>de</strong> existen gran<strong>de</strong>s extensiones <strong>de</strong> pastos sin uti<br />
I izar, <strong>de</strong>bido a <strong>la</strong>s condiciones climáticas muy rígidas, a <strong>la</strong> infestación <strong>de</strong> <strong>la</strong>s pasturas corT<br />
alicuya (Fascio<strong>la</strong> hepática) y al problema <strong>de</strong>l abigeato. Por esas razones, esta actividad<br />
no ha <strong>de</strong>sarrol<strong>la</strong>do <strong>de</strong> acuerdo a su real capacidad <strong>de</strong> recepción animal, ya que es notorio<br />
que <strong>la</strong> complementaridad <strong>de</strong> especies en <strong>la</strong> explotación pecuaria es <strong>de</strong>ficiente y no se a<strong>de</strong>cúa<br />
a <strong>la</strong> disponibilidad <strong>de</strong> recursos forrajeros <strong>de</strong> <strong>la</strong> zona.<br />
3. Volumen y Valor <strong>de</strong> <strong>la</strong> Producción Agropecuaria<br />
a. Caractenstícas <strong>de</strong> <strong>la</strong> Producción Agrico<strong>la</strong><br />
La producción agríco<strong>la</strong> se <strong>de</strong>stina principalmente a <strong>la</strong> obtención <strong>de</strong><br />
alimentos, <strong>de</strong>stacando como los cultivos más importantes el maiz, <strong>la</strong> cebada, <strong>la</strong> papa y <strong>la</strong><br />
arveja que, en conjunto, ocupan el 71.4% <strong>de</strong>l área anual <strong>de</strong> producción; estos cultivos se<br />
<strong>de</strong>sarrol<strong>la</strong>n, a pesar <strong>de</strong> su predominancia respecto a otros que ocupan áreas menores, emple<br />
ándose técnicas tradicionales y en condiciones ecológicas no siempre favorables, como se<br />
<strong>de</strong>scribe brevemente a continuación:<br />
Asi*, en el cultivo <strong>de</strong> mafz, se utilizan generalmente semil<strong>la</strong>s <strong>de</strong> proce<strong>de</strong>ncia local<br />
(marees amiláceos), aunque en zonas bajas se cultivan varieda<strong>de</strong>s híbridas <strong>de</strong> proce<strong>de</strong>n<br />
cia externa; en <strong>la</strong> preparación <strong>de</strong>l terreno, se utiliza yuntas <strong>de</strong> bueyes, ejecutándosee!<br />
sembrío a "co<strong>la</strong> <strong>de</strong> buey" y en surcos, a pendientes variables. Entre <strong>la</strong>s <strong>la</strong>bores culturales,<br />
hay <strong>de</strong>ficiencias muy comunes; así, no se acostumbra a <strong>de</strong>sinfectar <strong>la</strong>s semil<strong>la</strong>s ,<br />
no se aplican fertilizantes, ni se realiza control <strong>de</strong> p<strong>la</strong>gas ni <strong>de</strong> enfermeda<strong>de</strong>s, etc. La<br />
cosecha generalmente se realiza a mano, en ver<strong>de</strong> como "choclo" para consumo directo<br />
y, en seco, para grano. Los rendimientos que se obtienen son muy variables, influyendo<br />
mucho <strong>la</strong>s condiciones climáticas; así, cuando son <strong>de</strong>sfavorables sólo se obtiene<br />
cha<strong>la</strong> o panca, que se utiliza para <strong>la</strong> alimentación <strong>de</strong> los animales. Existen gran diver<br />
sidad <strong>de</strong> varieda<strong>de</strong>s, <strong>de</strong>stacando los maíces "B<strong>la</strong>nco" y "el Morocho", "el Amarillo",<br />
"el A<strong>la</strong>zán" y otros, localizados en áreas <strong>de</strong>finidas.<br />
El cultivo <strong>de</strong> cebada se lleva a cabo en áreas tradicionales, en terrenos <strong>de</strong> pendientes<br />
mo<strong>de</strong>radas a fuertes y en climas que varían <strong>de</strong> temp<strong>la</strong>das a fríos; entre <strong>la</strong>s <strong>la</strong>bores cultu<br />
rales, <strong>de</strong>staca <strong>la</strong> preparación <strong>de</strong>l terreno, que se realiza preferentemente con yuntas ;<br />
el sembrío, ejecutado "al boleo", el corte, efectuado a mano y <strong>la</strong> tril<strong>la</strong> realizada em<br />
pleando animales.<br />
El uso <strong>de</strong> insumos es muy limitado; <strong>la</strong> semil<strong>la</strong> es <strong>de</strong> proce<strong>de</strong>ncia local, usándose mucho<br />
<strong>la</strong> variedad "hexasticum" o cebada corriente que, en <strong>la</strong> siembra, no se acostumbra a<br />
<strong>de</strong>sinfectar; tampoco se usa fertilizantes ni pesticidas; por esa razón, los rendimientos<br />
que se obHenen son muy variados y <strong>de</strong>pen<strong>de</strong>n principalmente <strong>de</strong> <strong>la</strong> calidad <strong>de</strong> los suelos<br />
y <strong>de</strong> <strong>la</strong>s condiciones climáticas.<br />
El cultivo <strong>de</strong> papa en <strong>la</strong> zona es <strong>de</strong> mucha importancia y <strong>la</strong> siembra se lleva a cabo en
, 386 ZONA NORTE DE CAJAMARCA<br />
dos épocas (Setiembre y Mayo); <strong>la</strong> primera se realiza en los cultivos <strong>de</strong> secano y coinci<strong>de</strong><br />
con el período <strong>de</strong> los meses lluviosos,, siendo <strong>la</strong> segunda ejecutada en terrenos ba<br />
¡o riego, excepto en el subsector Cutervo y parte <strong>de</strong> Chota, don<strong>de</strong> se cultiva durante<br />
todo el año, <strong>de</strong>bido a <strong>la</strong> bondad <strong>de</strong>l clima, <strong>la</strong> buena capacidad retentiva <strong>de</strong> los suelos<br />
y <strong>la</strong> a<strong>de</strong>cuada dotación <strong>de</strong> agua. Este es uno <strong>de</strong> los cultivos que <strong>de</strong>manda <strong>la</strong> mayor<br />
proporción <strong>de</strong> insumes por unidad <strong>de</strong> área en cada ciclo <strong>de</strong> producción; así, en el caso<br />
<strong>de</strong> <strong>la</strong>s semil<strong>la</strong>s, se emplean preferentemente <strong>la</strong>s que proce<strong>de</strong>n <strong>de</strong>l lugar y, én <strong>la</strong> selec<br />
ción, no se siguen criterios técnicos <strong>de</strong> sanidad ni <strong>de</strong> tamaño; entre <strong>la</strong>s varieda<strong>de</strong>s más<br />
difundidas, están <strong>la</strong> "Renacimiento",<strong>la</strong> "Mariva", <strong>la</strong> "Guareno", <strong>la</strong> "Merpata", <strong>la</strong><br />
"Huagalina" y otras. La preparación <strong>de</strong>l terreno es esmerada y se lleva a cabo con yun<br />
tas y a mano, empleándose preferentemente áreas <strong>de</strong>scansadas o empastadas que, en<br />
realidad, son áreas <strong>de</strong> rotación. El uso <strong>de</strong> insumes varía según <strong>la</strong> ubicación <strong>de</strong> <strong>la</strong> unidad<br />
<strong>de</strong> producción; así, <strong>la</strong>s prácticas <strong>de</strong> <strong>de</strong>sinfección <strong>de</strong> semil<strong>la</strong>s,<strong>de</strong> fertilización y el<br />
uso <strong>de</strong> productos f¡ tosan i torios son <strong>de</strong>ficientes y poco comunes, siendo <strong>la</strong>s áreas cercanas<br />
a <strong>la</strong>s carreteras y a los centros pob<strong>la</strong>dos <strong>la</strong>s que cuentan con <strong>la</strong>s mayores ventajas<br />
en cuanto al abastecimiento y a <strong>la</strong> adquisición <strong>de</strong> técnicas que permiten su uso, mientras<br />
que en <strong>la</strong>s áreas sin acceso, <strong>la</strong> obtención y el empleo <strong>de</strong> estos productos es muy I i<br />
mitado. Los rendimientos que se obtienen en este cultivo son muy fluctuantes y <strong>de</strong>pen<br />
<strong>de</strong>n <strong>de</strong>l grado <strong>de</strong> inci<strong>de</strong>ncia <strong>de</strong> los factores climáticos y <strong>de</strong> <strong>la</strong>s prácticas <strong>de</strong> abonamien<br />
to y <strong>de</strong> control <strong>de</strong> p<strong>la</strong>gas y <strong>de</strong> enfermeda<strong>de</strong>s; así, en <strong>la</strong> zona se han observado rendi -<br />
mientas ais<strong>la</strong>dos que superan los 12,000 Kg/Ha. y, en otros casos, no se logra recuperar<br />
en <strong>la</strong> cosecha ni el peso <strong>de</strong> <strong>la</strong> semil<strong>la</strong> empleada.<br />
El cultivo <strong>de</strong> arveja se <strong>de</strong>stino al autoconsumo, en ver<strong>de</strong> como legumbre y el grano se<br />
co como menestra, <strong>de</strong>dicándose <strong>la</strong> mayor área a esta última forma <strong>de</strong> uso; <strong>la</strong>s semil<strong>la</strong>s<br />
empleadas son <strong>de</strong> origen local, y <strong>la</strong>s varieda<strong>de</strong>s más comunes son <strong>la</strong> "B<strong>la</strong>nca criol<strong>la</strong>", <strong>la</strong><br />
'Cuarentona", <strong>la</strong> "Al<strong>de</strong>rman azul" y otras. El empleo <strong>de</strong> otros insumas es restringido,<br />
siendo excepcional el uso <strong>de</strong> pesticidas; como característica importante en <strong>la</strong>s <strong>la</strong>bores<br />
culturales, <strong>de</strong>staca <strong>la</strong> preparación <strong>de</strong>! terreno, que se ejecuta con "yuntas" y a mano -<br />
La siembra se realiza con "yuntas" y al "boleo", en tanto que <strong>la</strong> cosecha tanto*para le<br />
gumbre como para grano, se realiza a mano; en el último caso, se arranca y se almace<br />
na en parvas y <strong>la</strong> tril<strong>la</strong> se ejecuta "al garrote". Los subsectores <strong>de</strong> Chota, Cutervo y<br />
Cajamarca (San Pablo) son los que ofertan <strong>la</strong> mayor producción para el consumo en ver<br />
<strong>de</strong>.<br />
El trigo se cultiva preferentemente en el Sector I (Sur), <strong>de</strong>stacando los subsectores <strong>de</strong><br />
Cajamarca, San Miguel y Contumazá por ser áreas tradicionales <strong>de</strong> producción, em<br />
p'leándose en el cultivo <strong>de</strong> este cereal terrenos con pendientes suaves a fuertes, don<strong>de</strong><br />
se conduce generalmente en secano. Entre <strong>la</strong>s <strong>la</strong>bores culturales <strong>de</strong>staca <strong>la</strong> preparación<br />
<strong>de</strong>l terreno, que es ejecutado con yuntas; el uso <strong>de</strong> abonos <strong>de</strong> pesticidas y herbicidas es<br />
poco común; <strong>la</strong> cosecha o "corte" se hace a mano y <strong>la</strong> tril<strong>la</strong> se realiza usando animales-<br />
Las semil<strong>la</strong>s son <strong>de</strong> proce<strong>de</strong>ncia local, <strong>de</strong>stacando <strong>la</strong>s siguientes varieda<strong>de</strong>s: "Helvia<br />
Fron", "Huancabamba", "Huascarán 1 ', "Olianta", "Cajabahba" y otras.<br />
El cultivo <strong>de</strong> arroz es uno <strong>de</strong> los más esmerados y tecnificados en <strong>la</strong> zona, sobre todoen<br />
<strong>la</strong>s <strong>la</strong>bores que se refieren a <strong>la</strong> preparación <strong>de</strong>l terreno, abonamiento y otras <strong>la</strong>borescul<br />
turóles que se llevan a cabo con regu<strong>la</strong>ridad; <strong>la</strong>s áreas utilizadas disponen <strong>de</strong> abundan-
DIAGNOSTICO AGROPECUARIO Pág. 38?<br />
te dotación <strong>de</strong> agua, <strong>la</strong> cosecha se realiza a mano y <strong>la</strong> tril<strong>la</strong> se ejecuta a máquina o<br />
con animales, obteniéndose <strong>la</strong> producción en cascara, que es entregada a los molinos<br />
<strong>de</strong> EPSA para su pi<strong>la</strong>do y posterior almacenamiento. Entre <strong>la</strong>s varieda<strong>de</strong>s cultivadas ,<br />
<strong>de</strong>stacan <strong>la</strong> "Mochica", "Nay<strong>la</strong>mp", "Lambayeque" y otras<br />
En los cultivos restantes,<strong>la</strong>s prácticas <strong>de</strong> <strong>la</strong>boreo se rigen <strong>de</strong> acuerdo al costumbrismo<br />
local o regional, obteniéndose rendimientos muy limitados, que se <strong>de</strong>stinan principal -<br />
mente al autoconsumo.<br />
La producción, en general, se obtiene en suelos <strong>de</strong> baja fertilidad ,<br />
los que son trabajados con poco esmero; por esa razón, <strong>la</strong> productividad unitaria (Kg./Ha.)<br />
esfá por <strong>de</strong>bajo <strong>de</strong> lo <strong>de</strong>seable y parece que tien<strong>de</strong> a <strong>de</strong>crecer,con excepción <strong>de</strong> los culti -<br />
vos <strong>de</strong> <strong>la</strong> papa, <strong>la</strong> arveja y el arroz, <strong>de</strong> los que en algunos casos se obtienen buenos rendimientos<br />
unitarios .<br />
La producción, en algunos subsectores, resulta vulnerable a los cam<br />
bios climáticos y a <strong>la</strong> aparición <strong>de</strong> p<strong>la</strong>gas y enfermeda<strong>de</strong>s que pue<strong>de</strong>n contro<strong>la</strong>rse, asi" como<br />
a <strong>la</strong> variación <strong>de</strong> los precios <strong>de</strong> los productos agríco<strong>la</strong>s; en este aspecto, el caso <strong>de</strong> <strong>la</strong> papa<br />
es el más representativo, ya que su cultivo es el que tiene mayor repercusión por <strong>la</strong> dinámi<br />
ca que le da a <strong>la</strong> zona„ Esta situación <strong>de</strong> vulnerabilidad origina en algunas localida<strong>de</strong>s <strong>de</strong><br />
presiones <strong>de</strong> carácter económico que repercuten fuertemente en <strong>la</strong> pob<strong>la</strong>ción, sea por una<br />
mayor <strong>de</strong>manda <strong>de</strong> productos o por <strong>la</strong>s migraciones a que dan lugar.<br />
b. Volumen y Valor <strong>de</strong> <strong>la</strong> Producción Agríco<strong>la</strong><br />
Para <strong>de</strong>terrttinar el grado <strong>de</strong> participación <strong>de</strong> <strong>la</strong> producción agríco<strong>la</strong><br />
en <strong>la</strong> economía <strong>de</strong> los sectores comprendidos en <strong>la</strong> zona <strong>de</strong> estudio, se ha estimado el <strong>volumen</strong><br />
y valor obtenido en <strong>la</strong> campaña 1974-75, consi<strong>de</strong>rando <strong>la</strong>s áreas <strong>de</strong> cultivo bajo riego<br />
y <strong>de</strong> secano, los promedios <strong>de</strong> rendimiento unitario y los precios promedios <strong>de</strong> los productos<br />
en chacra para cada sector y subsectores (ver Cuadro N 0 5-DA).<br />
E¡ Sector I (Norte), con un área anual <strong>de</strong> producción <strong>de</strong> 51,599 Ha.,<br />
tuvo una producción <strong>de</strong> 83, 186 TM, valorizadas en S/.301'588,000.00, <strong>de</strong>stacando el mayor<br />
aporte los subsectores <strong>de</strong> Hualgayoc y Chota, siendo éstos provenientes en mayor propor<br />
ción <strong>de</strong> <strong>la</strong> producción <strong>de</strong> los cultivos <strong>de</strong> papa y maíz.<br />
El subsector <strong>de</strong> Cutervo tuvo un área anual <strong>de</strong> producción <strong>de</strong> 16,081 Ha., <strong>de</strong> <strong>la</strong>s que se<br />
obtuvo 30,824 TM., valorizadas en S/.80' 172,000.00, <strong>de</strong>stacando el aporte <strong>de</strong> los siguientes<br />
cultivos: el maíz, con el 42.0%, <strong>la</strong> papa con el 16.5%, <strong>la</strong> arveja grano seco<br />
con el 12,2% y <strong>la</strong> caña <strong>de</strong> azúcar con el 6.1% <strong>de</strong>l valor <strong>de</strong> <strong>la</strong> producción, respecti<br />
vamente, tal como se muestra en el Cuadro N 0 3 <strong>de</strong>l Anexo VI. Este subsector tiene <strong>la</strong><br />
particu<strong>la</strong>ridad <strong>de</strong> producir papa y arvejas durante todo el año, <strong>de</strong>bido a <strong>la</strong>s condicio -<br />
nes climáticas favorables; también tiene significación <strong>la</strong> producción <strong>de</strong> otras tuberosas ,<br />
tales como <strong>la</strong> "arracacha" (Arracada xanthorrhiza) y <strong>la</strong> pituca (Colocalcia sculenta) ,<br />
que se <strong>de</strong>stinan al consumo dé<strong>la</strong>s pob<strong>la</strong>ciones circundantes.
Pág. 388 ZONA NORTE DE CAJA MA RCA<br />
El subsector <strong>de</strong> Chota tuvo un área anual <strong>de</strong> producción <strong>de</strong> 16,423 Ha., <strong>de</strong> <strong>la</strong>s que se<br />
obtuvo 21,053 TM., valorizadas en S/. 102'094,000.00, <strong>de</strong>stacando el aporte <strong>de</strong> los<br />
siguientes cultivos: ei maiz, <strong>la</strong> papa, <strong>la</strong> arveja grano seco y <strong>la</strong> cebada, con el 37.8%,<br />
37.1%, 8.3% y 6.1% <strong>de</strong>l valor total <strong>de</strong> <strong>la</strong> producción, respectivamente, tal como se<br />
muestra en el Cuadro N 0 4 <strong>de</strong>l Anexo VI.<br />
El subsector <strong>de</strong> Santa Cruz tuvo un área anual <strong>de</strong> producción <strong>de</strong> 1,993 Ha., que produ<br />
¡eron 2,895 TM, valorizadas en S/. 10"651,000*00, <strong>de</strong>stacando el aporte <strong>de</strong> los siguien<br />
tes cultivos: el maiz, con el 50 (í 8%, <strong>la</strong> papa con el 26.3%y otros tubérculos (arracacha)<br />
con el 4.7% <strong>de</strong>l valor total <strong>de</strong> <strong>la</strong> producción, respectivamente, tal como se muestra<br />
en el Cuadro N 0 5 <strong>de</strong>l Anexo VI. Debe indicarse que <strong>la</strong> producción <strong>de</strong> arracacha<br />
se <strong>de</strong>stina al consumo local „<br />
El subsector <strong>de</strong> Hualgayoc tuvo un área anual <strong>de</strong> producción <strong>de</strong> 17,102 Ha., que produjo<br />
28,414 TM., valorizadas en S/.108 , 671,000„00, <strong>de</strong>stacando el aporte <strong>de</strong> los cul<br />
tivos <strong>de</strong> papa, maiz, cebada, oca y olluco, con el 47.8%, 24.8%, 12 J% y 8 0 2%<strong>de</strong>l<br />
valor total <strong>de</strong> <strong>la</strong> producción, respectivamente, tal como se muestra en el Cuadro N 0 6<br />
<strong>de</strong>l Anexo VI „<br />
El Sector II (Sur), con un área anual <strong>de</strong> producción <strong>de</strong> 32,918 Ha»,<br />
tuvo una producción <strong>de</strong> 74,242 TM., valorizados en S/»206'088,000»00, <strong>de</strong>stacando porsu<br />
mayor aporte el subsector <strong>de</strong> Cajamarca, proveniente <strong>de</strong> <strong>la</strong> producción <strong>de</strong> los cultivos <strong>de</strong><br />
papa, mafz y cebada, en mayor proporción.<br />
s<br />
El Subsector <strong>de</strong> Cajamarca tuvo un área anual <strong>de</strong> producción <strong>de</strong> 17,616 Ha., que produjeron<br />
44,510 TM., valorizadas en S/, 108'678,000.00, <strong>de</strong>stacando el aporie <strong>de</strong> los<br />
cultivos <strong>de</strong> papa, cebada, mafz, caña <strong>de</strong> azúcar y trigo, que aportaron el 23.0%,<br />
16.4%, 9 Í ,3% y el 7,5% <strong>de</strong>l valor total <strong>de</strong> !a producción, respectivamente, tal como<br />
se muestra en el Cuadto N 0 7 <strong>de</strong>l Anexo VI.<br />
El Subsector <strong>de</strong> San Miguel tuvo un área <strong>de</strong> producción <strong>de</strong> 11,173 Ha., que produjeron<br />
21,471 TM, valorizadas en S/.69*653,000„00, en <strong>la</strong>sque predominaron los cultivos <strong>de</strong><br />
papa, maTz y arroz, que aportaron el 31 „!%, 14o4% y el 9,5% <strong>de</strong>l valor total <strong>de</strong> <strong>la</strong><br />
producción, respectivamente, tal como se muestra en el Cuadro IS 0 8 <strong>de</strong>l Anexo VI. En<br />
este subsector, el área bajo riego representa el 44,0% <strong>de</strong>l área cultivada.<br />
El Subsector <strong>de</strong> Contumazá tuvo un área anual <strong>de</strong> producción <strong>de</strong> 4,129 Ha., que produ<br />
jeron 8,261 TM», valorizadas en S/.27*757,OOOoOO, <strong>de</strong>stacando el aporte <strong>de</strong> los cultivos<br />
<strong>de</strong> arroz, trigo y papa, que aportaron el 26.7%, 19.3% y el 13.6% <strong>de</strong>l valor total<br />
<strong>de</strong> <strong>la</strong> producción, respectivamente, tal como se muestra en el Cuadro N 0 9 <strong>de</strong>l Anexo<br />
VI „ En el cultivo <strong>de</strong> arroz, existe una campaña chica, cuya área ha sido estimada en<br />
un 60% <strong>de</strong>l área cultivada con este cereaL<br />
En resumen, el área anual <strong>de</strong> producción <strong>de</strong> <strong>la</strong> zona <strong>de</strong> estudio al —<br />
canzó a 84,517 Ha., que produjeron 157,428 TM., valorizadas en S/.507'676,000.00, co<br />
rrespondiéndole el mayor aporte al Sector I (Norte) con el 59.4%, que proviene principalmente<br />
<strong>de</strong> <strong>la</strong> producción <strong>de</strong> los subsectores <strong>de</strong> Hualgayoc y Chota, con el 21 .4% y el 20.1%
DIAGNOSTICO AGROPECUARIO Pág. 389<br />
<strong>de</strong>l valor total, respectivamente. El aporte <strong>de</strong>l Sector I (Sur) representa el 40.6%, proveniente<br />
principalmente <strong>de</strong> <strong>la</strong> producción <strong>de</strong>l subsector <strong>de</strong> Cajamarca, en <strong>la</strong> proporción <strong>de</strong>l<br />
21.4% <strong>de</strong>l valor total, respectivamente (Cuadro N 0 5-DA).<br />
A nivel <strong>de</strong> cultivos, <strong>de</strong>staca por su mayor aporte <strong>la</strong> papa, con el<br />
30.8%, el maiz con el 26.3%; <strong>la</strong> cebada con el 10.0% y <strong>la</strong> arveja grano seco con el 6.8%<br />
<strong>de</strong>l valor total, tal como se muestra en el Cuadro N 0 6-DA.<br />
CUADRO N 0 5-DA<br />
AREA, VOLUMEN Y VALOR DE LA PRODUCCIÓN AGRÍCOLA<br />
Sectores<br />
Area Anual <strong>de</strong><br />
Producción<br />
( 1974- 1975 )<br />
Producción<br />
Valor<br />
Ha.<br />
%<br />
TM<br />
%<br />
Miles <strong>de</strong> S/.<br />
%<br />
1. (Norte)<br />
51,599<br />
61.'<br />
83,186<br />
52.8<br />
301,588<br />
59.4<br />
Cutervo<br />
Chota<br />
Santa Cruz<br />
Hualgayoc<br />
16,081<br />
16,423<br />
1,993<br />
17,102<br />
19.0<br />
19.4<br />
2.4<br />
20.2<br />
30,824<br />
21,053<br />
2,895<br />
28,414<br />
19.6<br />
13.4<br />
1.8<br />
18.0<br />
80,, 172<br />
102,094<br />
10,651<br />
108,671<br />
15.8<br />
20.1<br />
2.1<br />
21.4<br />
II.<br />
(Sur)<br />
32,918<br />
39.a<br />
74,242<br />
47.2<br />
206,088<br />
40.6<br />
Cajamarca<br />
San Miguel<br />
Contumazó<br />
17,616<br />
11,173<br />
4,129<br />
20.8<br />
13.3<br />
4.9<br />
44,510<br />
21,471<br />
8,261<br />
28.3<br />
13.6<br />
5.3<br />
108,678<br />
69,653<br />
27,757<br />
21.4<br />
13.7<br />
5.5<br />
Total<br />
84,517<br />
100.0<br />
157,428<br />
100.0<br />
507,676<br />
100.0<br />
Fuente : ONERN, 1975.<br />
c„ Características <strong>de</strong> <strong>la</strong> Producción Pecuaria<br />
La producción pecuaria <strong>de</strong> <strong>la</strong> zona es importante por participar con<br />
el 12,1% y el 53,1% <strong>de</strong>l <strong>volumen</strong> y valor <strong>de</strong> <strong>la</strong> producción agropecuaria (Cuadro N 0 9-DA),<br />
y por estar ligada a <strong>la</strong> economía <strong>de</strong> mercado; esto es particu<strong>la</strong>rmente resaltante en el caso<br />
<strong>de</strong> <strong>la</strong> explotación vacuna, ya que su <strong>de</strong>sarrollo se ha <strong>de</strong>bido principalmente a <strong>la</strong> facilidad <strong>de</strong><br />
que dispone para colocar su producción en los centros <strong>de</strong> consumo <strong>de</strong>l país.<br />
A nivel <strong>de</strong> unidad productiva, también tiene importancia <strong>la</strong> producción<br />
pecuaria, ya que le permite al agricultor obtener los ingresos monetarios adicionales ne<br />
cesarías para adquirir una serie <strong>de</strong> productos indispensables para <strong>de</strong>sarrol<strong>la</strong>r su actividad a -<br />
gríco<strong>la</strong>, pecuaria o para vivir y, también, le permite aprovechar los rastrojos <strong>de</strong> <strong>la</strong>s cose -<br />
chas <strong>de</strong> <strong>la</strong>s parce<strong>la</strong>s agrico<strong>la</strong>s dispersas en <strong>la</strong>s áreas <strong>de</strong> pastoreo alejadas; a<strong>de</strong>más, este tipo<br />
<strong>de</strong> explotación se consi<strong>de</strong>ra segura, porque los productos o subproductos que se obtienen <strong>de</strong>
P3g„ 390 ZONA NORTE DE CAJAMARCA<br />
CUADRO N 0 6-DA<br />
AREA, VOLUMEN Y VALOR TOTAL POR CULTIVOS<br />
(1974-1975)<br />
Cultivos<br />
Area Anual <strong>de</strong><br />
Producción<br />
Volumen<br />
Valor<br />
Ha.<br />
%<br />
TM<br />
%<br />
Miles <strong>de</strong>S/.<br />
%<br />
1. Industriales<br />
1,690<br />
2,0<br />
34,989<br />
22.3<br />
19,334<br />
3.8<br />
Caña <strong>de</strong> azúcar<br />
Café<br />
Otros cultivos ind»<br />
(*) 1,397<br />
251<br />
42<br />
1.7<br />
0.3<br />
0.0<br />
34,900<br />
76<br />
13<br />
22.2<br />
0.1<br />
0.0<br />
17,<strong>45</strong>0<br />
1,506<br />
378<br />
3.4<br />
0.3<br />
0.1<br />
II. Alimenticios<br />
77,399<br />
91.6<br />
93^394<br />
59.3<br />
471,936<br />
93.0<br />
Papa<br />
Maíz<br />
Cebada<br />
Arveja grano seco<br />
Trigo<br />
Arroz<br />
Arveja grano ver<strong>de</strong><br />
Olluco<br />
Oca<br />
Camote<br />
Yuca<br />
Lenteja<br />
Hortalizas varias<br />
Otros tubérculos<br />
Fríjol<br />
Plátanos<br />
Haba<br />
Otros frutales<br />
Otros cereales<br />
Cítricos<br />
8,575<br />
33,399<br />
12,662<br />
5,776<br />
4,7<strong>03</strong><br />
743<br />
1,7<strong>45</strong><br />
2,469<br />
1,995<br />
824<br />
783<br />
779<br />
368<br />
714<br />
882<br />
255<br />
402<br />
147<br />
118<br />
60<br />
10.1<br />
39.5<br />
15.0<br />
6.8<br />
5.6<br />
0.9<br />
2.1<br />
2.9<br />
2.4<br />
1.0<br />
0.9<br />
0.9<br />
0.4<br />
0.9<br />
1.0<br />
0.3<br />
0.5<br />
0.2<br />
0.1<br />
0.1<br />
44,670<br />
13,359<br />
6,333<br />
1,734<br />
1,880<br />
2,229<br />
2,269<br />
4,868<br />
3,990<br />
2,884<br />
2,741<br />
196<br />
1,472<br />
2,856<br />
175<br />
1,020<br />
123<br />
368<br />
47<br />
180<br />
28.4<br />
8.5<br />
4.0<br />
1.1<br />
1.2<br />
1.4<br />
1.5<br />
3.1<br />
2.5<br />
1.8<br />
1.8<br />
0.1<br />
0.9<br />
1.8<br />
0.1<br />
0.7<br />
0.1<br />
0.2<br />
0.0<br />
0.1<br />
156,346<br />
133,596<br />
50,648<br />
34,656<br />
18,812<br />
17,832<br />
13,613<br />
12,3<strong>45</strong><br />
7,980<br />
4,328<br />
4,112<br />
3,895<br />
2,944<br />
2,856<br />
2,646<br />
2,040<br />
1,811<br />
735<br />
381<br />
360<br />
30.8<br />
26.3<br />
10.0<br />
6.8<br />
3 0 7<br />
3.5<br />
2.7<br />
2.4<br />
1.6<br />
0.9<br />
0.8<br />
0.8<br />
0.6<br />
0.6<br />
0.5<br />
0.4<br />
0.3<br />
0.1<br />
0.1<br />
0.1<br />
III. Pastos y Forrajes<br />
5,428<br />
6.4<br />
29,0<strong>45</strong><br />
18.4<br />
16,406<br />
3.2<br />
Trébol y Rye grass<br />
Otros forrajes<br />
Alfalfa<br />
Mafz cha<strong>la</strong><br />
1,196<br />
3,483<br />
566<br />
183<br />
1.4<br />
4.1<br />
0.7<br />
0,2<br />
9,568<br />
10,<strong>45</strong>5<br />
6,826<br />
2,196<br />
6.1<br />
6.6<br />
4.3<br />
1.4<br />
5,741<br />
5,229<br />
4,095<br />
1,341<br />
1.1<br />
1,0<br />
0.8<br />
0.3<br />
Total<br />
84,517<br />
100.0<br />
157,428<br />
100.0<br />
507,676<br />
100.0<br />
(í) : El área <strong>de</strong> cosecha anual <strong>de</strong> <strong>la</strong> caña <strong>de</strong> azúcar equivale al 50.0%,<br />
Fuente : ONERN.
DIAGNOSTICO AGROPECUARIO Pág, 391<br />
el<strong>la</strong> no son perecibles y pue<strong>de</strong>n ofertarse en cualquier momento.<br />
En el Cuadro N 0 7-DA, se muestra el valor <strong>de</strong> <strong>la</strong> pob<strong>la</strong>ción pecuaria<br />
actual <strong>de</strong> <strong>la</strong> zona estudiada, por sectores y subsectores, asi* como <strong>de</strong> <strong>la</strong>s especies domésticas<br />
que <strong>la</strong> conforman; esta valorización en vivo alcanzó a S/,, 1,551 '294,000.00, correspon -<br />
diéndo <strong>la</strong> mayor inversión al Sector I (Norte), ya que captó el 53.4% <strong>de</strong>l total. Destacan<br />
por su mayor participación los subsectores <strong>de</strong> Cajamarca, San Miguel y Cutervo, con el<br />
20,9%, 18o5%yel 17o8% <strong>de</strong>l valor total, respectivamente. Por especies, el valor <strong>de</strong> <strong>la</strong><br />
pob<strong>la</strong>ción vacuna representa el 84.7%, ratificando su importancia sobre <strong>la</strong>s otras crianzas,,<br />
La explotación tiene mucha trascen<strong>de</strong>ncia en <strong>la</strong> actividad agríco<strong>la</strong>, ya que proporciona <strong>la</strong><br />
fuerza <strong>de</strong> tracción necesaria para el <strong>la</strong>boreo <strong>de</strong> <strong>la</strong> tierra (barbecho,, siembra); <strong>de</strong> allf quefa<br />
falta <strong>de</strong> bueyes en <strong>la</strong>s zonas <strong>de</strong> fuertes pendientes resulta negativa para <strong>la</strong> actividad agrfco<br />
<strong>la</strong>. En esta estimación, no se ha consi<strong>de</strong>rado el valor <strong>de</strong>l ganado equino, compuesto por<br />
caballos, mulos y asnos, que si bien no dan beneficio directo en cambio el servicio que<br />
prestan en el area rural, como elemento <strong>de</strong> transporte, es muy importante.<br />
El <strong>de</strong>sarrollo <strong>de</strong> <strong>la</strong> gana<strong>de</strong>ría vacuna realizado es a base <strong>de</strong> ganado<br />
criollo no seleccionado y con animales <strong>de</strong> baja cruza, obtenidos <strong>de</strong> razas criol<strong>la</strong>s con ani -<br />
males mejorados, los que se caracterizan por ser <strong>de</strong> poca alzada, <strong>de</strong> gran rusticidad, resistentes<br />
a los cambios climáticos extremos y adaptables a <strong>la</strong>s condiciones topográficas acci -<br />
<strong>de</strong>ntadas en <strong>la</strong>s que <strong>de</strong>be <strong>de</strong>sp<strong>la</strong>zarse para buscar el sustento; estos animales tienen una con<br />
formación genotfpica y fenotfpica no bien <strong>de</strong>finidas, <strong>de</strong> aspecto generalmente fuerte, pro -<br />
vistos <strong>de</strong> osamentas <strong>de</strong>sarrol<strong>la</strong>das y <strong>de</strong> pe<strong>la</strong>jes muy variadoso<br />
La explotación <strong>de</strong> este tipo <strong>de</strong> ganado se lleva a cabo preferentemen<br />
te a nivel familiar y <strong>la</strong> producción <strong>de</strong> leche y carne se <strong>de</strong>stina al mercado. Las practicas <strong>de</strong><br />
selección <strong>de</strong> empadre, así como el control <strong>de</strong> <strong>la</strong> parición^, <strong>la</strong> sanidad y otras, se realizan <strong>de</strong><br />
manera tradicional, <strong>de</strong>bido al limitado conocimiento técnico que tienen los gana<strong>de</strong>ros, a<br />
<strong>la</strong> escasez <strong>de</strong> msumos pecuarios y a <strong>la</strong> falta <strong>de</strong> capital <strong>de</strong> trabajo,, Para <strong>la</strong> alimentación,se<br />
utilizan los pastos naturales y los rastrojos <strong>de</strong> cosechas y, en menor esca<strong>la</strong>, los pastos cultivados,<br />
en <strong>la</strong>s modalida<strong>de</strong>s <strong>de</strong> pastoreo extensivo, contro<strong>la</strong>do (a estaca) o al corte.<br />
Las enfermeda<strong>de</strong>s que tienen mayor inci<strong>de</strong>ncia en <strong>la</strong> pob<strong>la</strong>ción vacuna<br />
son <strong>la</strong>s <strong>de</strong> carácter infeccioso como <strong>la</strong> aftosa, e! carbunclo sintomaticOy <strong>la</strong> septicemia y<br />
el endoparasitismo: como <strong>la</strong> Distomatosís y <strong>la</strong> Verminosís gastro intestinal y pulmonar; <strong>la</strong> que<br />
tiene mayor significación es <strong>la</strong> Distomatosís hepática, que requiere una acción <strong>de</strong> carácter<br />
nacional para reducir el daño que ocasiona a <strong>la</strong> gana<strong>de</strong>ría„<br />
En algunos sectores <strong>de</strong> <strong>la</strong> zona, existen fundos gana<strong>de</strong>ros en los que<br />
<strong>la</strong> explotación se lleva a cabo en unida<strong>de</strong>s agropecuarias <strong>de</strong> gran extensión y a base <strong>de</strong> ani<br />
males mejorados <strong>de</strong> <strong>la</strong>s razas Holstein, Hereford y Brown Swiss, <strong>la</strong>s que cuentan con áreas<br />
<strong>de</strong> pastoreo y a <strong>la</strong>s que se les proporciona adicionalmente concentrados, atención veterinaria<br />
y manejo a<strong>de</strong>cuado. Cabe <strong>de</strong>stacar que, en el fundo Huacraucro (Distrito <strong>de</strong> San Juan -<br />
Cajamarca), <strong>la</strong> gana<strong>de</strong>rFa está muy bien conducida, disponiéndose <strong>de</strong> hatos <strong>de</strong> ganado <strong>de</strong> <strong>la</strong><br />
raza Hereford, que son alimentados a base <strong>de</strong> mezc<strong>la</strong>s forrajeras constituidas por gramíneas<br />
y leguminosas (Dactylis glomerata + Trifolium repens) en forma extensiva, obteniéndose ani<br />
males precoces y <strong>de</strong> buen rendimiento en carne.
13<br />
CUADRO N 0 7-DA<br />
— : _ CD<br />
to<br />
VALOR ESTIMADO DE LA POBLACIÓN PECUARIA POR SECTORES<br />
(Soles oro <strong>de</strong> 1974)<br />
v - x<br />
Crianzas<br />
Vacuno<br />
Ovinos-Caprinos<br />
Pob<strong>la</strong>ción<br />
Valor<br />
Pob<strong>la</strong>ción<br />
Valor<br />
Sectores<br />
^v<br />
N 0<br />
Ejemp,<br />
%<br />
Miles <strong>de</strong><br />
s/.<br />
%<br />
Ejemp.<br />
%<br />
Miles <strong>de</strong><br />
s/.<br />
%<br />
1 (Norte)<br />
87, 990<br />
56.0<br />
701,390<br />
53,4<br />
90,907<br />
47,0<br />
72,806<br />
47.0<br />
Cutervo<br />
Chota<br />
Santa Cruz<br />
Hualgayoc<br />
28,250<br />
27,920<br />
5,880<br />
25,940<br />
18.0<br />
17,8<br />
3 0 7<br />
16.5<br />
237,560<br />
225,650<br />
43,840<br />
194,340<br />
18.1<br />
17,2<br />
3.3<br />
14.8<br />
23,597<br />
26,340<br />
2,510<br />
38,460<br />
12,2<br />
13,6<br />
1.3<br />
19.9<br />
18,878<br />
21,072<br />
2,008<br />
30,848<br />
12.2<br />
13,6<br />
K3<br />
19.9<br />
II<br />
(Sur)<br />
68,900<br />
44.0<br />
612,740<br />
4ó„6<br />
102,340<br />
53.0<br />
81,872<br />
53.0<br />
Cajamarca<br />
San Miguel<br />
Contumazá<br />
28,370<br />
29,920<br />
10,610<br />
18.1<br />
19J<br />
6.8<br />
275,400<br />
249,880<br />
87,460<br />
21,0<br />
19.0<br />
6,6<br />
<strong>45</strong>,530<br />
34,000<br />
22,810<br />
23.6<br />
17.6<br />
11.8<br />
36,424<br />
27,200<br />
18,248<br />
23.6<br />
17.6<br />
11.8<br />
Total<br />
156,890<br />
100.0<br />
l'SH, 130<br />
100.0<br />
193,247<br />
100.0<br />
154,678<br />
100.0<br />
Valor Porcentual<br />
84.7<br />
¡\ '<br />
(Continúa).,,<br />
n
Cuadro N 0 7-DA (Cont.)<br />
><br />
o<br />
•z<br />
S<br />
H<br />
^v<br />
Crianzas<br />
Porcinos<br />
Aves<br />
Pob<strong>la</strong>ción<br />
Valor<br />
Pob<strong>la</strong>ción<br />
Valor<br />
Sectores<br />
1 (Norte)<br />
^v<br />
N 0<br />
Ejemp.<br />
33,730<br />
%<br />
66.6<br />
Miles <strong>de</strong><br />
S/.<br />
37,730<br />
%<br />
66.6<br />
N 0<br />
Ejemp,<br />
144,220<br />
%<br />
63.1<br />
Miles <strong>de</strong><br />
s/.<br />
14,422<br />
%<br />
63.1<br />
Cutervo<br />
Chota<br />
Santa Cruz<br />
Hualgayoc<br />
11,260<br />
10,990<br />
1,230<br />
10,250<br />
22.2<br />
21.7<br />
2.4<br />
20.3<br />
11,260<br />
10,990<br />
1,230<br />
10,250<br />
22.2<br />
21.7<br />
2.4<br />
20.3<br />
53, 970<br />
<strong>45</strong>,410<br />
9,910<br />
34,930<br />
23.6<br />
19.9<br />
4.3<br />
15.3<br />
5,397<br />
4,541<br />
991<br />
3,493<br />
23.6<br />
19.9<br />
4.3<br />
15.3<br />
II<br />
(Sur)<br />
16,890<br />
33.4<br />
16,890<br />
33.4<br />
84,180<br />
36.9<br />
8,418<br />
36.9<br />
Ca[amarca<br />
San Miguel<br />
Contumazó<br />
7,350<br />
6,620<br />
2,920<br />
14.5<br />
13.1<br />
5.8<br />
7,350<br />
6,620<br />
2,920<br />
14.5<br />
13,1<br />
5.8<br />
36,830<br />
26,680<br />
20,670<br />
16.1<br />
11.7<br />
9.1<br />
3,683<br />
2,668<br />
2,067<br />
16.1<br />
11.7<br />
9.1<br />
Total<br />
50,620<br />
100.0<br />
50,620<br />
100.0<br />
228,400<br />
100.0<br />
22,840<br />
100.0<br />
Valor Porcentual<br />
3.2<br />
1.5<br />
(Continúa)...<br />
to
Cuadro N 0 7-DA (Cont.)<br />
N. Crianza<br />
Cuyes<br />
Total<br />
Sectores \ .<br />
1 (Norte)<br />
Pob<strong>la</strong>ción<br />
N 0<br />
Ejemp.<br />
153,<strong>45</strong>0<br />
%<br />
68.0<br />
Miles <strong>de</strong><br />
s/.<br />
6,137<br />
Valor<br />
%<br />
68.0<br />
Miles <strong>de</strong><br />
s/.<br />
828,485<br />
Valor<br />
%<br />
53.4<br />
Cutervo<br />
Chota<br />
Santa Cruz<br />
Hualgayoc<br />
60,210<br />
49,040<br />
8,970<br />
35,230<br />
26.7<br />
21.7<br />
4.0<br />
15,6<br />
2,408<br />
1,961<br />
359<br />
1,409<br />
26.7<br />
21.7<br />
4.0<br />
15«,6<br />
275,5<strong>03</strong><br />
264,214<br />
48,428<br />
'240,340<br />
17.8<br />
17.0<br />
3.1<br />
15.5<br />
II<br />
(Sur)<br />
72,160<br />
32.0<br />
2,889<br />
32.0<br />
722,809<br />
46.6<br />
Ca¡amarca<br />
San Miguel<br />
Contumazá<br />
24,690<br />
30,300<br />
17,170<br />
10.9<br />
13.4<br />
7.7<br />
988<br />
1,212<br />
689<br />
10.9<br />
13.4<br />
7.7<br />
323,8<strong>45</strong><br />
287,580<br />
111,384<br />
20.9<br />
18.5<br />
7.2<br />
Total<br />
225,610<br />
100.0<br />
9,026<br />
100.0<br />
r55l,294<br />
100.0<br />
Valor Porcentual<br />
0.6<br />
100.0<br />
Fuente: CENAGRO, 1972.<br />
ONERN, 1975.
DIAGNOSTICO /, GROPtCU/, RIO Pág. 395<br />
La crianza <strong>de</strong> ovinos, caprinos, porcinos, aves y cuyes se lleva a<br />
cabo en forma doméstica, con <strong>la</strong> finalidad <strong>de</strong> proveerse <strong>de</strong> carne para el autoconsumo y el<br />
exce<strong>de</strong>nte ofertarlo al mercado. Por informaciones recogidas en <strong>la</strong> zona, se sabe que <strong>la</strong>po<br />
b<strong>la</strong>ción <strong>de</strong> ovinos ha disminuido, al parecer por <strong>la</strong> inci<strong>de</strong>ncia <strong>de</strong> <strong>la</strong>s enfermeda<strong>de</strong>s infeccio<br />
sas y parasitarias; a esta situación pue<strong>de</strong> atribuirse que <strong>la</strong>s áreas <strong>de</strong> pastos naturales <strong>de</strong> <strong>la</strong><br />
parte alta <strong>de</strong> Hualgayoc, San Miguel y Cajamarca están sin aprovechar. La crianza do —<br />
méstica <strong>de</strong> cuyes tiene trascen<strong>de</strong>ntal importancia en <strong>la</strong> zona y se lleva a cabo con <strong>la</strong> final i<br />
dad <strong>de</strong> obtener carne; su <strong>de</strong>sarrollo, sin embargo, se ve afectado por enfermeda<strong>de</strong>s y parásitos<br />
que limitan su expansión.<br />
d. Volumen y Valor <strong>de</strong> <strong>la</strong> Producción Pecuaria<br />
Según el Cuadro N 0 8-DA, <strong>la</strong> producción pecuaria alcanza un volu<br />
men <strong>de</strong> 21,865 TM.; <strong>de</strong> este total, 14,276 TM. correspon<strong>de</strong>n a <strong>la</strong> leche y 4,958 TM. a<br />
carnes <strong>de</strong> vacuno. El valor <strong>de</strong> <strong>la</strong> producción pecuaria alcanzó a S/.574 , l 96,000.00, <strong>de</strong><br />
los cuales el Sector I (Norte) generó el 55.1% y <strong>la</strong>'diferencia al Sector II (Sur). De este<br />
valor, le correspon<strong>de</strong> a <strong>la</strong> carne <strong>de</strong> vacuno S/.356'822,000.00 y a <strong>la</strong> leche S/.<br />
7r376,000.00.<br />
Respecto a <strong>la</strong> importancia que tienen los subsectores como centros <strong>de</strong><br />
producción, <strong>de</strong>be seña<strong>la</strong>rse que <strong>de</strong>stacan Cutervo, San Miguel y Cajamarca, que aportan<br />
el 19.4%, 18.8% y 18.5% <strong>de</strong>l valor total, respectivamente, siendo menor <strong>la</strong> participación<br />
'"<strong>de</strong> los subsectores <strong>de</strong> Santa Cruz y Contumazá; sin embargo, en el subsector <strong>de</strong> Hualgayoc ,<br />
se podría aumentar <strong>la</strong> pob<strong>la</strong>ción pecuaria en <strong>la</strong>s áreas <strong>de</strong> pastos naturales poco aprovecha -<br />
dos.<br />
En lo que se refiere a <strong>la</strong> gana<strong>de</strong>ría lechera, los rendimientos pue<strong>de</strong>n<br />
mejorarse sustancíalmente en <strong>de</strong>terminadas áreas, como Cutervo, Chota (Conchán-Chiguirip),<br />
San Miguel (Chumbil), Chetil<strong>la</strong> y otros, don<strong>de</strong> existen condiciones aparentes para introducir<br />
ganado lechero <strong>de</strong> calidad y se pue<strong>de</strong>n cultivar forrajes.<br />
e» Volumen y Valor <strong>de</strong> <strong>la</strong> Producción Agropecuaria<br />
En el Cuadro N 0 9-DA, se pue<strong>de</strong> apreciar que <strong>la</strong> producción agrope<br />
cuaria en <strong>la</strong> zona alcanzó un <strong>volumen</strong> <strong>de</strong> 179,293 TM, <strong>de</strong> <strong>la</strong>s cuales el 87.8% correspon —<br />
dio a <strong>la</strong> agricultura y <strong>la</strong> diferencia a <strong>la</strong> producción gana<strong>de</strong>ra, y cuyo valor ascendió a<br />
S/. 1,081 '872,000.00, correspondiendo el mayor aporte a <strong>la</strong> producción pecuaria, con el<br />
53.1%, y <strong>la</strong> diferencia a <strong>la</strong> agricultura; como pue<strong>de</strong> apreciarse, el valor <strong>de</strong> <strong>la</strong> producción<br />
agríco<strong>la</strong> y pecuaria es bastante equilibrado, correspondiendo el mayor <strong>volumen</strong> a los pro -<br />
ductos agríco<strong>la</strong>s, <strong>de</strong>bido a que tienen un menor costo unitario.<br />
La participación <strong>de</strong>l Sector I (Norte) en el valor bruto <strong>de</strong> <strong>la</strong> produc<br />
ción representó el 57.1% y <strong>la</strong> <strong>de</strong>l Sector II (Sur) el 42.9% <strong>de</strong>l total. En el Sector I (Norte),
CUADRO N 0 8-DA<br />
VOLUMEN Y VALOR DE LA PRODUCCIÓN PECUARIA POR SECTORES<br />
(Miles <strong>de</strong> Soles <strong>de</strong> 1975)<br />
•o<br />
OQ<br />
<strong>03</strong><br />
CO<br />
OÍ<br />
N. Productos<br />
Sectores N.<br />
1 (Norte)<br />
Cutervo<br />
Chota<br />
Santa Cruz<br />
Hualgayac<br />
II<br />
(Sur)<br />
Ca| amárco<br />
San Miguel<br />
Contumazá<br />
Total<br />
, Valor Porcentual<br />
Leche<br />
Produce i6n<br />
TM<br />
7,152<br />
2,885<br />
2,299<br />
<strong>45</strong>9<br />
1,509<br />
7,124<br />
3,896<br />
2,598<br />
630<br />
14,276<br />
%<br />
50.1<br />
20.2<br />
16.1<br />
3.2<br />
10.6<br />
49.9<br />
27.3<br />
18.2<br />
4.4<br />
100.0<br />
Valor<br />
Miles <strong>de</strong><br />
SA<br />
35,761<br />
14,424<br />
11,496<br />
2,295<br />
7,546<br />
35,615<br />
19,473<br />
12,992<br />
3,150<br />
71,376<br />
%<br />
50.1<br />
20.2<br />
16.1<br />
3.2<br />
10.6<br />
49.9<br />
27.3<br />
18.2<br />
4.4<br />
100.0<br />
12.4%<br />
' 1 • • • 1<br />
Carnes<br />
Vacunos<br />
Produccl6n<br />
TM<br />
2,642<br />
907<br />
830<br />
172<br />
733<br />
2,316<br />
875<br />
1,060<br />
381<br />
4,958<br />
%<br />
53.3<br />
18.3<br />
16.7<br />
3.5<br />
14.8<br />
46.7<br />
17.6<br />
21.4<br />
7.7<br />
100.0<br />
__<br />
Valor<br />
Miles <strong>de</strong><br />
SA<br />
189,869<br />
65,295<br />
59,220<br />
12,358<br />
52,996<br />
166,953<br />
63,093<br />
76,366<br />
27,494<br />
356,822<br />
%<br />
53.2<br />
18.3<br />
16.6<br />
3.5<br />
H.8<br />
46.8<br />
17.7<br />
21.4<br />
7.7<br />
100.0<br />
62.1%<br />
Ovinos<br />
Producci6n<br />
TM<br />
171<br />
47<br />
57<br />
5<br />
62<br />
241<br />
102<br />
69<br />
70<br />
412<br />
%<br />
41.5<br />
11.4<br />
13.8<br />
1.2<br />
15.1<br />
58.5<br />
24.8<br />
16.7<br />
17.0<br />
100.0<br />
Valor<br />
Miles <strong>de</strong><br />
SA<br />
10,568<br />
2,925<br />
3,516<br />
310<br />
3,817<br />
14,569<br />
6,236<br />
4,263<br />
4,070<br />
25,137<br />
%<br />
42.0<br />
11.6<br />
14.0<br />
1.2<br />
15.2<br />
58.0<br />
24.8<br />
17.0<br />
16.2<br />
100.0<br />
4.4%<br />
Porcinos<br />
Producción<br />
TM<br />
508<br />
169<br />
165<br />
20<br />
154<br />
253<br />
110<br />
99<br />
44<br />
761<br />
%<br />
66.7<br />
22.2<br />
21.7<br />
2.6<br />
20.2<br />
33.3<br />
14.5<br />
13.0<br />
5.8<br />
100.0<br />
Valor<br />
Miles <strong>de</strong><br />
SA<br />
29,422<br />
9,796<br />
9,558<br />
1,148<br />
8,920<br />
14,694<br />
6,395<br />
5,759<br />
2,540<br />
44,116<br />
%<br />
66.7<br />
22.2<br />
21.7<br />
2.6<br />
20.2<br />
33.3<br />
14.5<br />
13.0<br />
5.8<br />
100.0<br />
7.7% 1<br />
\ ^ Productos<br />
Sectores N.<br />
1 Norte<br />
1 Cutervo<br />
Che<strong>la</strong><br />
Santa Cruz<br />
Hualgayoc<br />
III<br />
Sur<br />
Ca|amarca<br />
San Miguel<br />
Contumazá<br />
1 Total<br />
Valor Porcentual<br />
Carnes<br />
Aves<br />
Producclín<br />
TM<br />
433<br />
162<br />
.136<br />
30<br />
105<br />
253<br />
111<br />
80'<br />
62 •<br />
686<br />
%<br />
63.1<br />
23.6<br />
19.8<br />
4.4<br />
15.3<br />
36.9<br />
16.2<br />
11.7<br />
9.0<br />
100.0<br />
Valor<br />
Miles<br />
<strong>de</strong>SA<br />
25,956<br />
9,714<br />
8,172<br />
1,782<br />
6,288<br />
15,150<br />
6,630<br />
4,800<br />
3,720<br />
41,106<br />
%<br />
63.1<br />
23.6<br />
19.9<br />
4.3<br />
15.3<br />
36.9<br />
16.1<br />
11.7<br />
9.1<br />
100.0<br />
7.2%<br />
Cuy<br />
Producción<br />
TM<br />
384<br />
151<br />
123<br />
22<br />
88<br />
181<br />
62<br />
76<br />
43<br />
565<br />
%<br />
68.0<br />
26.7<br />
21.8<br />
3.9<br />
15.6<br />
?2.0<br />
11.0<br />
13.4<br />
7.6<br />
100.0<br />
es<br />
Valor<br />
Miles<br />
<strong>de</strong>S/.<br />
19,180<br />
7,525<br />
6,130<br />
1,120<br />
4,405<br />
8,263<br />
3,085<br />
3,<strong>03</strong>2<br />
2,146<br />
27,443<br />
%<br />
69.9<br />
27.4<br />
22.3<br />
4.1<br />
16.1<br />
30.1<br />
11.2<br />
11.1<br />
7.8<br />
100.0<br />
4.8%<br />
Total<br />
Producción<br />
TM<br />
4,138<br />
1,436<br />
1,311<br />
249<br />
1,142<br />
3,244<br />
1,260<br />
1,384<br />
600<br />
7,382<br />
%<br />
56.1<br />
19.4<br />
17.8<br />
3.4<br />
15.5<br />
43.9<br />
17.1<br />
18.7<br />
8.1<br />
100.0<br />
Valor<br />
Miles<br />
<strong>de</strong>SA<br />
274,995<br />
95,255<br />
86,596<br />
16,718<br />
76,426<br />
219,629<br />
85,439<br />
94,220<br />
39,970<br />
494,624<br />
%<br />
55.6<br />
19.3<br />
15.4<br />
44.4<br />
17.3<br />
19.0<br />
8.1<br />
100.0<br />
98.6%<br />
Huevos<br />
Producción<br />
TM<br />
131<br />
49<br />
41<br />
9<br />
32<br />
76<br />
33<br />
24<br />
19<br />
207<br />
%<br />
63.3<br />
23.7<br />
19.8<br />
4.4<br />
15.4<br />
36.7<br />
15.9<br />
11.6<br />
9.2<br />
100.0<br />
Valor<br />
Miles <strong>de</strong><br />
SA<br />
5,184<br />
1,944<br />
1,620<br />
360<br />
1,260<br />
3,012<br />
1,316<br />
956<br />
740<br />
8,196<br />
%<br />
63.3<br />
23.7<br />
19.8<br />
4.4<br />
15.4<br />
36.7<br />
16.0<br />
11.7<br />
9.0<br />
100.0<br />
1.4%<br />
Total<br />
Producción<br />
TM<br />
11,421<br />
4,370<br />
3,651<br />
717<br />
2,483<br />
10,444<br />
5,189<br />
4,006<br />
1,249<br />
21,865<br />
%<br />
52.3<br />
20.0<br />
16.7<br />
3.3<br />
12.3<br />
47.7<br />
23.7<br />
18.3<br />
5.7<br />
100.0<br />
Valor<br />
Miles <strong>de</strong><br />
SA<br />
315,940<br />
111,623<br />
99,712<br />
19,373<br />
85,232<br />
258,256<br />
106,228<br />
108,166<br />
43,860<br />
574,196<br />
%<br />
55.1<br />
19.4<br />
17.4<br />
3.4<br />
14.9<br />
44.9<br />
18.5<br />
' 18.8<br />
7.6<br />
100.0<br />
1<br />
100.0%<br />
N<br />
O<br />
Z<br />
><br />
2<br />
O<br />
f8<br />
H<br />
tn<br />
O<br />
Pi<br />
n<br />
><br />
><br />
S<br />
><br />
O<br />
><br />
Fuente: ONERN
. 7<br />
DIAGNOSTICO AGROPECUARIO<br />
CUADRO N 0 9-DA<br />
VOLUMEN Y VALOR DE LA PRODUCCIÓN AGROPECUARIA<br />
(1974-1975)<br />
^v.<br />
SubsacMr<br />
ProducclónN.<br />
1. AarTcolo<br />
Industría<strong>la</strong>s<br />
Alimenticios<br />
Pastos y forrajes<br />
II. Pecuaria<br />
Leche<br />
Comes<br />
Vacunos<br />
Ovinos<br />
Porcinos<br />
Aves<br />
Cuy-<br />
Huevos<br />
Total<br />
Valor<br />
Porcentual<br />
Cutervo<br />
Volumen<br />
TM<br />
30,824<br />
9,920<br />
13,014<br />
7,890<br />
4,370<br />
2,885<br />
1,436<br />
907<br />
47<br />
169<br />
162<br />
151<br />
49<br />
35,194<br />
%<br />
87.6<br />
28.2<br />
37.0<br />
22.4<br />
12.4<br />
8.2<br />
4.1<br />
2.6<br />
0.1<br />
0.5<br />
0.5<br />
0.4<br />
0.1<br />
100.0<br />
Valor<br />
Miles <strong>de</strong><br />
Soles<br />
80,172<br />
6,326<br />
69,607<br />
4,239<br />
111,623<br />
14, «4<br />
95,255<br />
65,295<br />
2,925<br />
9,796<br />
9,714<br />
7,525<br />
1,944<br />
191,795<br />
%<br />
41.8<br />
3.3<br />
36.3<br />
2.2<br />
58.2<br />
7.5<br />
49.7<br />
34.1<br />
1.5<br />
5.1<br />
5.1<br />
3.9<br />
1.0<br />
100.0<br />
17.7 %<br />
Chota<br />
Volumen<br />
TM<br />
21,053<br />
1,653<br />
18,663<br />
737<br />
3,651<br />
2,299<br />
1,311<br />
830<br />
57<br />
165<br />
136<br />
123<br />
41^<br />
24,704<br />
%<br />
85.2<br />
6.7<br />
75.5<br />
3.0<br />
14.8<br />
9.3<br />
5.3<br />
3.4<br />
0.2<br />
0.7<br />
0.5<br />
0.5<br />
0.2<br />
100.0<br />
Valor<br />
Miles <strong>de</strong><br />
Soles<br />
102,094<br />
873<br />
100,780<br />
441<br />
99,712<br />
11,496<br />
86,596<br />
59,220<br />
3,516<br />
9,558<br />
8,172<br />
6,130<br />
1,620<br />
201,806<br />
%<br />
50.5<br />
0.4<br />
49.9<br />
0.2<br />
49.5<br />
43.0<br />
29.4<br />
1.7<br />
4.7<br />
4.1<br />
3.0<br />
0.8<br />
100.0<br />
18.7 %<br />
Santa Cruz<br />
Volumen<br />
TM<br />
2,895<br />
352<br />
2,543<br />
717<br />
<strong>45</strong>9<br />
249<br />
172<br />
5<br />
20<br />
30<br />
22<br />
9<br />
3,812<br />
%<br />
80.1<br />
9.7<br />
70.4<br />
19.9<br />
12.7<br />
7.0<br />
4.8<br />
0.1<br />
0.6<br />
0.9<br />
0.6<br />
0.2<br />
100.0<br />
Valor<br />
Mi les <strong>de</strong><br />
Soles<br />
10,651<br />
217<br />
10,434<br />
19,373<br />
2,295<br />
16,718<br />
12,358<br />
310<br />
1,148<br />
1,782<br />
1,120<br />
360<br />
30,024<br />
%<br />
35.5<br />
0.7<br />
34.8<br />
64.5<br />
55.6<br />
41.2<br />
1.0<br />
3.8<br />
5.9<br />
3.7<br />
1.2<br />
100.0<br />
2.8%<br />
Hualgayoc<br />
Volumen<br />
TM<br />
28,414<br />
24,044<br />
4,370<br />
2,683<br />
1,509<br />
1,142<br />
733<br />
62<br />
154<br />
105<br />
88<br />
E<br />
3i, on<br />
%<br />
91.4<br />
77.3<br />
14.1<br />
8.6<br />
4.9<br />
3^<br />
2.3<br />
0.2<br />
0.5<br />
0.3<br />
0.3<br />
0.1<br />
100.0<br />
Valor<br />
Miles <strong>de</strong><br />
Soles<br />
108,671<br />
106,338<br />
2,333<br />
85,232<br />
7,546<br />
76,426<br />
52,996<br />
3,817<br />
8,920<br />
6,288<br />
4,405<br />
1,620<br />
193,9<strong>03</strong><br />
%<br />
56.0<br />
54.8<br />
1.2<br />
44.0<br />
3.9<br />
39.3<br />
27.3<br />
1.9<br />
4.6<br />
3.2<br />
2.3<br />
0.8<br />
100.0<br />
17.9 %<br />
^S.<br />
Subsactor<br />
Producción^<br />
1. Asrfco<strong>la</strong><br />
Industriales<br />
Alimenticios<br />
Pastos y forrajes<br />
II. Pecuario<br />
ijfJiiii<br />
Total<br />
Valor<br />
Porcentual<br />
Cajamarca<br />
Volumen<br />
TM<br />
44,510<br />
20,209<br />
18,715<br />
5,586<br />
5,189<br />
3,896<br />
1,260<br />
875<br />
102<br />
110<br />
111<br />
62<br />
33<br />
49,699<br />
%<br />
89.6<br />
40.7<br />
37.7<br />
11.2<br />
10.4<br />
2.5<br />
1.8<br />
0.2<br />
0.2<br />
0.2<br />
0.1<br />
100.0<br />
Valor<br />
Milotd.<br />
Soles<br />
108,678<br />
10,3«1<br />
95,012<br />
3,305<br />
106,228<br />
í?,473<br />
85,439<br />
63,093<br />
6,236<br />
6,395<br />
6,630<br />
3,085<br />
1,316<br />
214,906<br />
%<br />
50.6<br />
4.8<br />
44.2<br />
1.6<br />
49.4<br />
9.1<br />
39.7<br />
29.3<br />
2.9<br />
3.0<br />
3.1<br />
1.4<br />
M<br />
100.0<br />
19.9 %<br />
San Miguel<br />
Volumen<br />
TM<br />
21,471<br />
3<br />
12,355<br />
9,113<br />
4,006<br />
2,598<br />
1,384<br />
1,060<br />
69<br />
99<br />
80<br />
76<br />
24<br />
25,477<br />
%<br />
84.3<br />
48.5<br />
35.8<br />
15.7<br />
10.2<br />
5.4<br />
4.1<br />
0.3<br />
0.4<br />
0.3<br />
0.3<br />
0.1<br />
100.0<br />
Valor<br />
Milei<strong>de</strong><br />
Soles<br />
69,653<br />
69<br />
64,302<br />
5,282<br />
108,168<br />
12,992<br />
94,220<br />
76,366<br />
4,263<br />
5,759<br />
4,900<br />
3,<strong>03</strong>2<br />
956<br />
177,821<br />
%<br />
39,2<br />
36.2<br />
3.0<br />
60.8<br />
53.0<br />
43.0<br />
2.4<br />
3.2<br />
2.7<br />
1.7<br />
0.5<br />
100.0<br />
16.4 %<br />
Contumaz^<br />
Volumen<br />
TM<br />
8,261<br />
2,852<br />
4,060<br />
1,349<br />
1,249<br />
630<br />
600<br />
381<br />
70<br />
44<br />
62<br />
43<br />
19<br />
9,510<br />
%<br />
86.9<br />
30.0<br />
42.7<br />
14.2<br />
13.1<br />
6.6<br />
M<br />
4.0<br />
0.7<br />
0.5<br />
0.7<br />
0.4<br />
100.0<br />
Valor<br />
Miles <strong>de</strong><br />
Soles<br />
27,757<br />
1,488<br />
25,463<br />
806<br />
43,860<br />
3,150<br />
39,970<br />
27,494<br />
4,070<br />
2,540<br />
3,720<br />
2,146<br />
740<br />
71,617<br />
%<br />
38.8<br />
2.1<br />
35.6<br />
1.1<br />
61.2<br />
4.4<br />
55,8<br />
38.4<br />
5.7<br />
3.5<br />
5.2<br />
3.0<br />
1.0<br />
100.0<br />
6.6 %<br />
Total<br />
Volumen<br />
TM<br />
157,428<br />
34,989<br />
93,394<br />
29,0<strong>45</strong><br />
21,865<br />
14,276<br />
7,382<br />
4,958<br />
412<br />
761<br />
686<br />
565<br />
207<br />
179,293<br />
%<br />
87.8<br />
19.5<br />
52.1<br />
16.2<br />
12.2<br />
8.0<br />
4.1<br />
2.8<br />
0.2<br />
0.4<br />
0.4<br />
0.3<br />
0.1<br />
100.0<br />
Valor<br />
Miles<strong>de</strong><br />
Soles<br />
507,676<br />
19,334<br />
471,936<br />
16,406<br />
574,196<br />
71,376<br />
494,624<br />
356,822<br />
25,137<br />
44,116<br />
41,106<br />
27,443<br />
8,196<br />
l'081,872<br />
%<br />
46.9<br />
1.8<br />
43.6<br />
1.5<br />
53.1<br />
6.6<br />
<strong>45</strong>.7<br />
33.0<br />
2.3<br />
4.1<br />
3.8<br />
2.5<br />
M.<br />
100.0<br />
too.o %<br />
Fuente: ONERN, 1975<br />
Bíg. 397
Pág. 398 ZONA NORTE DE CAJAMARCA<br />
<strong>de</strong>staca el aporte <strong>de</strong> los subsectores <strong>de</strong> Chota, Hualgayoc y Cutervo y, en menor porcentaje,<br />
Santa Cruz; en este sector, el mayor aporte lo realiza <strong>la</strong> gana<strong>de</strong>ría, por <strong>la</strong> producción<br />
<strong>de</strong> carne y leche <strong>de</strong> vacunos, seguido <strong>de</strong> <strong>la</strong> producción <strong>de</strong> alimentos en agricultura. En el<br />
Sector II (Sur), <strong>de</strong>staca el aporte <strong>de</strong> los subsectores <strong>de</strong> Ca¡amarca y San Miguel y, en me -<br />
nor porcentaje, Contumazá; en este sector, los mayores aportes también lo realiza <strong>la</strong> gana<br />
<strong>de</strong>ría, por <strong>la</strong> producción <strong>de</strong> carnes y leche, seguido <strong>de</strong> <strong>la</strong> producción <strong>de</strong> alimentos en <strong>la</strong> a<br />
gricultura^ Como se observa los mayores ingresos han sido generados por <strong>la</strong> explotación vacuna,<br />
<strong>de</strong>bido a <strong>la</strong> gran extensión <strong>de</strong> área que se <strong>de</strong>stina para esta actividad y a <strong>la</strong>s condi -<br />
ciones favorables que presenta <strong>la</strong> zona para el <strong>de</strong>sarrollo <strong>de</strong> especies forrajeras„<br />
4. Factores <strong>de</strong> Producción<br />
a. Tierra<br />
(1). Tenencia y Distribución<br />
En el área <strong>de</strong> estudio, existen diferentes modalida<strong>de</strong>s <strong>de</strong> tenencia <strong>de</strong> <strong>la</strong> tierra, <strong>la</strong>s que<br />
<strong>de</strong> manera general pue<strong>de</strong>n agruparse en <strong>la</strong>s tres siguientes :<br />
Los conductores directos, constituidos por los agricultores que, al amparo <strong>de</strong>l tftu<br />
lo <strong>de</strong> propiedad, trabajan directamente <strong>la</strong> tierra, y los cuales pue<strong>de</strong>n c<strong>la</strong>sificarse<br />
<strong>de</strong> acuerdo a <strong>la</strong> extensión en: gran<strong>de</strong>s, medianos y pequeños propietarios» Este 01<br />
timo grupo tiene especial significación y esta constituido por unida<strong>de</strong>s agríco<strong>la</strong>s a<br />
<strong>la</strong>s que, por su reducida extensión, se les pue<strong>de</strong> catalogar como minifundios, con<br />
el agravante que muchos <strong>de</strong> ellos están situados en diferentes lugares preferente -<br />
mente en zonas aledañas a los centros pob<strong>la</strong>dos, constituyendo minifundios dispersoso<br />
Los conductores indirectos, constituidos por los agricultores que trabajan predios<br />
que legalmente no les pertenece, es <strong>de</strong>cir, que son ajenos y por los cuales, <strong>de</strong> a<br />
cuerdo a un convenio verbal o escrito, <strong>de</strong>ben pagar una merced conductiva en dinero,<br />
especies o servicios; estos fundos pue<strong>de</strong>n ser <strong>de</strong> propiedad pública o privada,<br />
teniendo extensiones variables que van dd minifundio a <strong>la</strong>s gran<strong>de</strong>s propieda<strong>de</strong>s .<br />
En éstas, a su vez, se dan formas antisociales <strong>de</strong> explotación <strong>de</strong> <strong>la</strong> tierra, <strong>la</strong>s que<br />
actualmente tratan <strong>de</strong> modificarse o abolirse por acción <strong>de</strong>l proceso <strong>de</strong> reforma a-<br />
graria.<br />
Las tierras comunales, trabajadas por agricultores que nominalmente están agrupados<br />
en comunida<strong>de</strong>s y que, <strong>de</strong> acuerdo a <strong>la</strong> ley, no son propietarios <strong>de</strong> <strong>la</strong>s parce -<br />
<strong>la</strong>s agríco<strong>la</strong>s» En <strong>la</strong> práctica, <strong>la</strong> gran mayoría ostenta títulos <strong>de</strong> propiedad por di<br />
ferentes conceptos (posesión, sucesión, compra-venta y otros), <strong>de</strong>svirtuando esta<br />
forma <strong>de</strong> tenencia; en cuanto a <strong>la</strong>s áreas <strong>de</strong> pastos, éstas son usadas por los comuneros<br />
con muy pocas limitaciones.<br />
Al efectuar un análisis <strong>de</strong> <strong>la</strong>s diferentes'modalida<strong>de</strong>s <strong>de</strong> tenencia <strong>de</strong> <strong>la</strong> tierra,<br />
se
CUADRO N" 10-DA<br />
DISTRIBUCIÓN DE LA TIERRA POR UNIDADES EN LOS SUBSECTORES DE CAJAMARCA<br />
NORTE<br />
^v.<br />
Subsectores<br />
Cutervo<br />
Chota<br />
Santa Cruz<br />
Hualgayoc<br />
Subestratos^v,^ Uní <strong>de</strong>letes<br />
(Ha.) ^^s^<br />
Menos <strong>de</strong> 1<br />
1 - 5<br />
5-20<br />
20-100<br />
100-500<br />
500-más<br />
1,280<br />
4,287<br />
2,736<br />
3<strong>03</strong><br />
8<br />
4<br />
%<br />
14.9<br />
49.8<br />
39.7<br />
3.5<br />
0.1<br />
0.0<br />
Ha.<br />
393<br />
10,747<br />
23,335<br />
9,540<br />
1,159<br />
11,491<br />
%<br />
0.7<br />
19.0<br />
41.2<br />
16.8<br />
2.0<br />
20.3<br />
Unida<strong>de</strong>s<br />
2,368<br />
6,406<br />
2,066<br />
128<br />
12<br />
1<br />
%<br />
21.6<br />
58.3<br />
18.8<br />
1.2<br />
o.i<br />
0.0<br />
Ha,<br />
1,<strong>03</strong>6<br />
14,637<br />
16,740<br />
14,544<br />
2,044<br />
588<br />
%<br />
2.1<br />
29.5<br />
33.8<br />
29.3<br />
4.1<br />
1.2<br />
Unida<strong>de</strong>s<br />
262<br />
881<br />
414<br />
43<br />
1<br />
%<br />
16.4<br />
55.0<br />
25.9<br />
2.7<br />
0.0<br />
Ha.<br />
88<br />
2,136<br />
3,417<br />
1,196<br />
400<br />
%<br />
1.2<br />
29.5<br />
47.2<br />
16.6<br />
5.5<br />
Unida<strong>de</strong>s<br />
3,218<br />
6,6<strong>45</strong><br />
2,118<br />
331<br />
31<br />
1<br />
%<br />
26,1<br />
53.8<br />
17.2<br />
2.7<br />
0.2<br />
0.0<br />
Ha.<br />
1,389<br />
14,990<br />
18,258<br />
12,762<br />
5,918<br />
500<br />
%<br />
2.6<br />
27.9<br />
33.9<br />
23.7<br />
11.0<br />
0.9<br />
Total<br />
8,618<br />
100.0<br />
56,665<br />
100.0<br />
10,981<br />
100.0<br />
49,589<br />
100.0<br />
1,601<br />
100.0<br />
7,237<br />
100.0<br />
12,344<br />
100.0<br />
53,817<br />
100.0<br />
^\Subsec tores<br />
Cajamarca<br />
San Miguel<br />
Contumazó<br />
Total<br />
Subes trataS*--..<br />
Unida<strong>de</strong>s<br />
(Ha.) ^ \<br />
%<br />
Ha.<br />
%<br />
Unida<strong>de</strong>s<br />
%<br />
Ha.<br />
%<br />
Unida<strong>de</strong>s<br />
%<br />
Ha.<br />
%<br />
Unida<strong>de</strong>s<br />
%<br />
Ha.<br />
%<br />
Menos <strong>de</strong> 1<br />
1 - 5<br />
5-20<br />
20 - 100<br />
100-500<br />
500-más<br />
1,798<br />
3,686<br />
2,0<strong>45</strong><br />
400<br />
31<br />
13<br />
22.6<br />
46.2<br />
25.6<br />
5.0<br />
0.4<br />
0.2<br />
586<br />
8,950<br />
18,529<br />
14,683<br />
6,008<br />
36,801<br />
0.7<br />
10.6<br />
21.9<br />
16.2<br />
7.1<br />
43,5<br />
1,312<br />
2,807<br />
1,563<br />
715<br />
116<br />
13<br />
20.1<br />
43.0<br />
24.0<br />
11.0<br />
1.7<br />
0.2<br />
467<br />
6,523<br />
14,592<br />
28,017<br />
20,431<br />
14,328<br />
0.6<br />
7.7<br />
17.3<br />
33.2<br />
24.2<br />
17.0<br />
385<br />
1,130<br />
698<br />
193<br />
36<br />
6<br />
15,7<br />
46.2<br />
28.5<br />
7.9<br />
1.5<br />
0.2<br />
140<br />
2,808<br />
6,230<br />
7,912<br />
6,601<br />
13,729<br />
0.4<br />
7.5<br />
16.6<br />
21.2<br />
17.6<br />
36.7<br />
10,623<br />
25,842<br />
11,640<br />
2,113<br />
235<br />
38<br />
21.0<br />
51.2<br />
23.0<br />
4.2<br />
0.5<br />
0.1<br />
4,099<br />
60,791<br />
101,101<br />
87,654<br />
42,561<br />
77,437<br />
1.1<br />
16.3<br />
27.0<br />
23.5<br />
11.4<br />
20.7<br />
Total<br />
7,973<br />
100.0<br />
84,557<br />
100.0<br />
6,526<br />
100.0<br />
84,358<br />
100.0<br />
2,448<br />
100.0<br />
37,420<br />
100.0<br />
50,491<br />
100.0<br />
373,643<br />
100.0<br />
Fuente : CENAGRO, 1972
DIAGNOSTICO AGROPECUARIO Pág, 399<br />
ha podido verificar cualitativamente que predomina <strong>la</strong> forma <strong>de</strong> conducción indi -<br />
recta, existiendo gran número <strong>de</strong> unida<strong>de</strong>s agropecuarias <strong>de</strong> extensiones variables<br />
que se encuentran arrendadas, sub-arrendadas, en anticresis y enfeudadas. En <strong>la</strong>s<br />
tierras comunales, <strong>la</strong>s formas <strong>de</strong> trabajo "al partir" son muy comunes y su cuantifi -<br />
cación no ha sido efectuada porque no se dispone <strong>de</strong> catastros rurales.<br />
Con referencia a <strong>la</strong> distribución <strong>de</strong> <strong>la</strong> tierra <strong>de</strong> acuerdo a <strong>la</strong> extensión <strong>de</strong> <strong>la</strong>s unida<br />
<strong>de</strong>s agríco<strong>la</strong>s, se ha utilizado los resultados <strong>de</strong>l Censo Nacional Agropecuario <strong>de</strong><br />
1972, tal como se observa en el Cuadro N 0 10-DA; en el que se aprecia que el<br />
72,2% <strong>de</strong> <strong>la</strong>s unida<strong>de</strong>s agríco<strong>la</strong>s menores <strong>de</strong> 5.0 Ha. ocupan sólo el 17.4% <strong>de</strong>l área<br />
total, lo que equivale a un promedio <strong>de</strong> 1.74 Ha. por unidad agríco<strong>la</strong>, cuya situación<br />
se agrava por el hecho <strong>de</strong> que es común encontrar minifundios dispersos que no<br />
alcanzan a tener <strong>la</strong> extensión promedio. En este grupo <strong>de</strong> unida<strong>de</strong>s, el área agrf -<br />
co<strong>la</strong> útil es probable que sólo represente <strong>de</strong>l 60 al 70% <strong>de</strong>l área total y <strong>la</strong> diferencia<br />
está constituida por tierras eriazas o improductivas. En contraposición, se observa<br />
que el 006% <strong>de</strong> <strong>la</strong>s unida<strong>de</strong>s agríco<strong>la</strong>s (273 fundos) mayores <strong>de</strong> 100 Ha» ocu -<br />
pan el 32,1% <strong>de</strong>l área total y en el<strong>la</strong>s el área agríco<strong>la</strong> útil es probable que abar -<br />
que sólo entre el 5 y el 10% <strong>de</strong>l total, estando el resto constituido por áreas eriazas<br />
que, en algunos casos están cubiertas por pastos naturales, bosques aprovechables o<br />
áreas inaptas para el uso agropecuario.<br />
(2)c Acciones <strong>de</strong> Reforma Agraria<br />
Las acciones <strong>de</strong> reforma agraria se llevan a cabo cumpliendo lo dispuesto por el Deere<br />
to Ley N 0 17716, aplicándose preferentemente los títulos N 0 IV, V y Vil <strong>de</strong> <strong>la</strong> citada<br />
ley; con estas acciones, avanza el proceso y se trata <strong>de</strong> cambiar <strong>la</strong> antigua y consol i -<br />
dar <strong>la</strong> nueva estructura <strong>de</strong>! sector rural.<br />
De <strong>la</strong>s informaciones obtenidas, pue<strong>de</strong> concluirse que <strong>la</strong>s acciones <strong>de</strong> reforma agraria<br />
más importantes llevadas a cabo durante el año 1974 son <strong>la</strong>s que se muestran en el Cua<br />
dro N 0 11-DA, <strong>de</strong>stacando <strong>la</strong>s que han tenido lugar en el ámbito <strong>de</strong> <strong>la</strong>s oficinas agrá -<br />
rias <strong>de</strong> Chota, Cajamarca y Chepén,, En el caso <strong>de</strong> <strong>la</strong>s acciones <strong>de</strong> reforma agraria en<br />
<strong>la</strong> agencia agraria <strong>de</strong> Cajamarca, se incluye <strong>la</strong>s realizadas en Cajamarca (valle), Cajabamba<br />
y Celendín,, provincias no consi<strong>de</strong>radas en este estudio por no haber sido posi<br />
ble su <strong>de</strong>sconsolidación <strong>de</strong> <strong>la</strong> información obtenida»<br />
Analizando <strong>la</strong>s principales acciones, se observa que <strong>la</strong>s más importantes son <strong>la</strong>s resolu<br />
clones zonales <strong>de</strong> inafectación que están dirigidas a amparar, normar, regu<strong>la</strong>r y conso<br />
lidar <strong>la</strong> pequeña y mediana propiedad explotada directamente por sus dueños en virtud<br />
<strong>de</strong> los Decretos Ley Nos, 19977, 21166 y 20136; y <strong>la</strong>s resoluciones zonales <strong>de</strong> afecta_<br />
ción con <strong>la</strong>sque se propone realizar <strong>la</strong> transofrmación <strong>de</strong> <strong>la</strong> estructura agraria sustituyendo<br />
los regímenes arcaicos <strong>de</strong>l <strong>la</strong>tifundio y <strong>de</strong> conducción indirecta por <strong>la</strong>s explotaciones<br />
<strong>de</strong> carácter asociativo y <strong>de</strong> conducción directa, respectivamente»
Pao. 400 ZONA NORTE DE CAJAMARCA<br />
CUADRO N o n-DA<br />
ACCIONES DE REFORMA AGRARIA<br />
Oficina<br />
Agraria<br />
Subsec tores<br />
comprendidos<br />
Acciones<br />
Predios<br />
Ha.<br />
Chota<br />
Cutervo<br />
Chota<br />
Santa Cruz<br />
Hualgayoc<br />
Notificaciones <strong>de</strong> P<strong>la</strong>no<br />
Resolución Zonal <strong>de</strong> Afectación<br />
Elevación <strong>de</strong> Expediente<br />
Toma <strong>de</strong> Posesión<br />
N 0 17<br />
8<br />
34<br />
14<br />
10,330<br />
13,473<br />
3,938<br />
13,532<br />
;<br />
Cajamarca<br />
Cajamarca<br />
Cajabamba<br />
Celendm<br />
Notificación <strong>de</strong> P<strong>la</strong>no<br />
Resolución Zonal <strong>de</strong> Afectación<br />
Elevación <strong>de</strong> Expediente<br />
Toma <strong>de</strong> Posesión<br />
Resolución <strong>de</strong> Inafectación<br />
163<br />
219<br />
140<br />
28<br />
1,440<br />
63,776<br />
59,933<br />
56,505<br />
30,954<br />
3,783<br />
Chepén<br />
San Miguel<br />
Contumazá<br />
Notificación <strong>de</strong> P<strong>la</strong>no<br />
Resolución Zonal <strong>de</strong> Afectación<br />
Elevación <strong>de</strong> Expediente<br />
Toma <strong>de</strong> Posesión<br />
8<br />
4<br />
4<br />
2<br />
7,304<br />
2,929<br />
5,714<br />
2,375<br />
Fuente : Ministerio <strong>de</strong> Agricultura - Memoria Anual <strong>de</strong> <strong>la</strong>s Oficinas Agrarias <strong>de</strong> Chota, Chepén y<br />
Cajamarca, 1974.<br />
b. Mano <strong>de</strong> Obra<br />
(1). Aspectos Generales <strong>de</strong> <strong>la</strong> Mano <strong>de</strong> Obra<br />
La pob<strong>la</strong>ción asentada en <strong>la</strong> zona <strong>de</strong> estudio, según el Censo Nacional <strong>de</strong> Pob<strong>la</strong>ción <strong>de</strong>!<br />
año 1972, alcanzó a 260,214 habitantes, <strong>de</strong> los cuales el 24.9% (64,809 habitantes )<br />
conforman <strong>la</strong> pob<strong>la</strong>ción económicamente activa (P.E.A,), constituida por hombres y mu<br />
jeres que superan ios 6 años y que tienen empleo o están ocupadas y a <strong>la</strong>s que buscan e n<br />
pleo o esfón <strong>de</strong>socupadas. De este total, el 98,2% (63,659 habitantes) están en condi<br />
ción <strong>de</strong> ocupados en <strong>la</strong>s diferentes ramas <strong>de</strong> actividad, ocupando el sector agropecuario<br />
el 75,9% (48,309 habitantes); <strong>la</strong> industria manufacturera el 12.3% (7,822 habitantes) ; '<br />
servicios el 5.1% (3,244 habitantes) y <strong>la</strong>s otras ramas <strong>de</strong> actividad el 6.7% (4,284 habitantes).<br />
Debe puntualizarse que <strong>la</strong>s cifras consi<strong>de</strong>radas en este análisis proporcionan un porcentaje<br />
sumamente elevado <strong>de</strong> ocupación, no acor<strong>de</strong> con ia realidad <strong>de</strong> ía zona <strong>de</strong> estu -<br />
dio, caracterizada por una fuerte <strong>de</strong>manda <strong>la</strong>boral sobre los re<strong>la</strong>tivamente escasos recur<br />
sos económicos que, a su vez, oferta„ Es asF como el subempleo o subocupación se dis<br />
fraza bajo <strong>la</strong> pobfación ocupada en el sector agropecuario, don<strong>de</strong> <strong>de</strong> <strong>la</strong>s siete catego -<br />
rias <strong>de</strong> ocupación existentes, tres están conceptualmente <strong>de</strong>finidas en un 100% como
DIAGNOSTICO AGROPECUARIO Pág, 401<br />
. subocupadas (trabajadores familiares no .remunerados, trabajadores in<strong>de</strong>pendie,-1 .s ' -ite<br />
gorFa no especificada), constituyendo aproximadamente el 88.5% <strong>de</strong> <strong>la</strong> PEA ocupada<br />
(42,753 pob<strong>la</strong>dores).<br />
Como resultado <strong>de</strong> esta disgres ion analítica, el elevado número <strong>de</strong> pob<strong>la</strong>ción ocupada<br />
disminuye significativamente en el sector agropecuario a sólo 5,556 pob<strong>la</strong>dores, reduciendo<br />
su participación re<strong>la</strong>tiva a 26.5%, luego <strong>de</strong> ser <strong>de</strong>ducidas <strong>la</strong>s tres categorias a<br />
rriba mencionadas. El saldo <strong>de</strong> pob<strong>la</strong>ción ocupada total sería <strong>de</strong> 20,906 trabajadores"<br />
mientras que <strong>la</strong> pob<strong>la</strong>ción subocupada total pasaría a ser 42,753 pob<strong>la</strong>dores.<br />
Al margen <strong>de</strong> estas consi<strong>de</strong>raciones, se observa que <strong>la</strong> pob<strong>la</strong>ción ocupada en activida<strong>de</strong>s<br />
agropecuarias en el Sector I (Norte) representa el 68.4% y en el Sector II (Sur) el<br />
31 ,6%, lo que indudablemente asevera que <strong>la</strong> mayor actividad agropecuaria está concentrada<br />
en el Sector I (Norte).<br />
(2). La Remuneración <strong>de</strong> <strong>la</strong> Mano <strong>de</strong> Obra<br />
La forma <strong>de</strong> pago <strong>de</strong> <strong>la</strong> mano <strong>de</strong> obra obe<strong>de</strong>ce a costumbres locales, remunerándose los<br />
servicios con dinero y/o comida y/o con productos agríco<strong>la</strong>s o pecuarios. Los sa<strong>la</strong>rios,<br />
por lo general, son más bajos que lo establecido por <strong>la</strong> Ley; sin embargo, al agregar el<br />
valor que tienen los productos y <strong>la</strong> comida proporcionada, igua<strong>la</strong>n o sobrepasan ese va<br />
I or, según <strong>la</strong> zona y época.<br />
En el pago <strong>de</strong> sa<strong>la</strong>rios <strong>de</strong> los trabajos familiares no se hacen <strong>de</strong>sembolsos monetarios,<br />
por el hecho <strong>de</strong> que ese gasto no es tomado en cuenta por los agricultores como costo ,<br />
porque se supone que estos valores son tras<strong>la</strong>dados en el producto a los mercados <strong>de</strong> <strong>la</strong>s<br />
ciuda<strong>de</strong>s, resultando, en algunos casos, que los precios <strong>de</strong> venta <strong>de</strong>l producto son menores<br />
que el <strong>de</strong>l costo <strong>de</strong> producción. Esto <strong>de</strong>termina una pérdida real que inci<strong>de</strong> en<br />
que <strong>la</strong>s remuneraciones no pagadas <strong>de</strong>jan <strong>de</strong> beneficiar a los productores <strong>de</strong> <strong>la</strong> zona.<br />
(3), Uso <strong>de</strong> <strong>la</strong> Mano <strong>de</strong> Obra en <strong>la</strong> Actividad Agropecuaria<br />
En el presente estudio sólo se ha tomado en cuenta los requerimientos <strong>de</strong> mano <strong>de</strong> obra<br />
que <strong>de</strong>mandan los cultivos en <strong>la</strong>s <strong>la</strong>bores <strong>de</strong> campo, tal como se muestra en los Cuadros<br />
N" 10, 11, 12, 13, 14, 15 y 16 <strong>de</strong>l Anexo VI; en cambio, <strong>la</strong>s <strong>la</strong>bores conexas al proceso<br />
<strong>de</strong> producción que se realiza en casa, no han sido consi<strong>de</strong>radas por lo difícil <strong>de</strong><br />
su estimación. En general, <strong>la</strong> <strong>de</strong>manda <strong>de</strong> mano <strong>de</strong> obra por cultivos para cada sector<br />
es muy parecida, presentándose variaciones respecto al costo unitario <strong>de</strong>l jornal; por<br />
esa razón, ONERN ha consi<strong>de</strong>rado como promedio <strong>de</strong> jornal S/.30.00 al día para <strong>la</strong><br />
mayoría <strong>de</strong> los cultivos, excepto para <strong>la</strong> caña <strong>de</strong> azúcar y el arroz, don<strong>de</strong> se estima<br />
que el jornal es <strong>de</strong> S/.60,Q0 al día. Detesta forma, se estimó que, para el área estudiada,<br />
se requieren 3'379, 870 jornales, con un valor <strong>de</strong> S/.104 , 385,000.00, <strong>de</strong>terminándose<br />
que el Sector 1 (Norte), absorbió 2'090,785 tareas, equivalentes a S/.<br />
63"578, 000,00, <strong>de</strong> <strong>la</strong>s cuales los subsectores <strong>de</strong> Hualgayoc-Chota yCajamarca- San<br />
Miguel <strong>de</strong>mandaron <strong>la</strong> mayor cantidad <strong>de</strong> tareas al año.<br />
En los Gráficos N 0 1 y 2-DA, se muestra <strong>la</strong> forma en que se usa <strong>la</strong> tierra en <strong>la</strong>s diferen
PSg. 402 ZONA NORTE DE CAJAMARCA<br />
tes etapas <strong>de</strong> <strong>la</strong>boreo en los dos sectores así como <strong>la</strong> <strong>de</strong>manda <strong>de</strong> mano <strong>de</strong> obra que se<br />
requiere en cada <strong>la</strong>bor, a <strong>la</strong>s que con fines <strong>de</strong> evaluación se <strong>la</strong>s ha agrupado en siembra,<br />
crecimiento y cosecha.<br />
En ambos sectores, se observa que el máximo empleo <strong>de</strong> <strong>la</strong> tierra tiene lugar entre los<br />
meses <strong>de</strong> Noviembre y Mayo, asumiéndose que ese también es el perfodo <strong>de</strong> máxima <strong>de</strong><br />
manda <strong>de</strong> mano <strong>de</strong> obra en <strong>la</strong> actividad agríco<strong>la</strong>.<br />
El uso <strong>de</strong> mano <strong>de</strong> obra en <strong>la</strong> gana<strong>de</strong>ría es permanente y generalmente familiar, siendo<br />
<strong>la</strong> explotación vacuna <strong>la</strong> actividad que absorbe mayor cantidad durante el año. A nivel<br />
general, se ha estimado una <strong>de</strong>manda <strong>de</strong> 1 '276,750 tareas, valorizadas en S/.<br />
35 , 749,000.00, <strong>de</strong> <strong>la</strong>s que comparativamente el Sector I (Norte) absorbió <strong>la</strong> mayor pro<br />
porción, siendo los subsectores <strong>de</strong> Cutervo-Chota y San Miguel-Cajamarca, respect! -<br />
vamente, los que <strong>de</strong>mandaron <strong>la</strong> mayor cantidad <strong>de</strong> mano <strong>de</strong> obra.<br />
(4). Oferta<br />
En el Capítulo II, se indica que <strong>la</strong> PEA <strong>de</strong> <strong>la</strong> zona <strong>de</strong> estudio para el año 1972 fue <strong>de</strong><br />
64,809 habitantes. El área rural contribuyó con 55,616 habitantes, constituyendo,ca<br />
si en su totalidad, <strong>la</strong> oferta total <strong>de</strong> mano <strong>de</strong> obra para <strong>la</strong>bores vincu<strong>la</strong>das al sector a<br />
grario.<br />
(5). Demanda<br />
En los Cuadros N 0 10, 11, 12, 13, 14, 15 y 16 <strong>de</strong>l Anexo VI, se muestran los requerimientos<br />
<strong>de</strong> mano <strong>de</strong> obra para los diferentes cultivos por unidad <strong>de</strong> superficie. Tenien<br />
do en cuenta los diferentes grados <strong>de</strong> tecnología empleados para cada cultivo, se ha es<br />
timado <strong>la</strong> <strong>de</strong>manda <strong>de</strong> {órnales por año calendario-cultivo, tal como se muestra en el<br />
Cuadro N 0 17 <strong>de</strong>l Anexo VI. En dicho Cuadro, se observa que el maíz, <strong>la</strong> papa y <strong>la</strong>ce<br />
bada que, en conjunto compren<strong>de</strong>n el mayor porcentaje <strong>de</strong> área total cultivada, em -<br />
picaron, a su vez, también el mayor número <strong>de</strong> jornales (2*338,510), si se consi<strong>de</strong>ra<br />
que el estimado total fue <strong>de</strong> 3*379,870 jornales.<br />
El Gráfico N 0 3-DA, que incorporó los jornales para tareas pecuarias, muestra <strong>la</strong> reía<br />
ción entre <strong>la</strong> oferta y <strong>de</strong>manda <strong>de</strong> mano <strong>de</strong> obra para tareas agropecuarias, en <strong>la</strong> zona<br />
<strong>de</strong> estudio. En él se observa que los meses <strong>de</strong> Febrero, Abril, Octubre y Diciembre a-<br />
cusaron <strong>la</strong> mayor <strong>de</strong>manda <strong>de</strong> jornales en contraposición a los meses <strong>de</strong> Enero, Julio<br />
Agosto y Setiembre, que acusaron los menores niveles en <strong>la</strong> <strong>de</strong>manda. Se consi<strong>de</strong>ra,al<br />
incorporarse los jornales para tareas pecuarias, que éstos representan 3,500 trabajadores<br />
por mes. Asimismo, se estima que <strong>la</strong> <strong>de</strong>manda teórica permanente <strong>de</strong> obreros era <strong>de</strong><br />
15,500 trabajadores al mes para el sector rural en conjunto.<br />
c. Tecnología<br />
En <strong>la</strong> zona estudiada, se ha <strong>de</strong>tectado que el uso <strong>de</strong> <strong>la</strong> tecnología es
DIAGNOSTICO AGROPECUARIO Pág, 4<strong>03</strong><br />
GRÁFICO N 0 1-DA<br />
FORMAS DE USO DE LA TIERRA Y CALENDARIO DE CULTIVOS<br />
SECTOR I<br />
(1974- 1975)<br />
Culfivos<br />
Area<br />
<strong>de</strong><br />
Producción<br />
Meses<br />
R/S(*)<br />
Ha.<br />
Enero Febn Marzo Abril Mayo Junio Julio Agosto Setiembre Octubre Noviembre Diciembre<br />
Mafz<br />
Mafz<br />
Papa<br />
Papa<br />
Cebada<br />
Cebada<br />
Arveja, grano seco<br />
Arveja, grano seco<br />
Oca<br />
Oca<br />
Olluco<br />
Olluco<br />
Otras tuberosas<br />
Otras tuberosas<br />
Arveja, grano ver<strong>de</strong><br />
Arveja, grano ver<strong>de</strong><br />
Lenteja<br />
Lenteja<br />
Capote<br />
Camote<br />
Frijol<br />
Frijol<br />
Yuca<br />
Yuca<br />
Haba<br />
Haba<br />
Trigo<br />
Trigo<br />
Hortalizas varias<br />
Hortalizas varias<br />
Mafz cha<strong>la</strong><br />
Mafz cha<strong>la</strong><br />
Otros cereales<br />
Otros cereales<br />
Arroz<br />
Arroz<br />
R<br />
S<br />
R<br />
S<br />
R<br />
S<br />
R<br />
S<br />
R<br />
S<br />
R<br />
S<br />
R<br />
S<br />
R<br />
S<br />
R<br />
S<br />
R<br />
S<br />
R<br />
S<br />
R<br />
S<br />
R<br />
S<br />
R<br />
S<br />
R<br />
S<br />
R<br />
S<br />
R<br />
S<br />
R<br />
S<br />
1,414<br />
24,687<br />
1,351<br />
4,334<br />
223<br />
5,109<br />
138<br />
3,400<br />
48<br />
1,422<br />
35<br />
1,428<br />
10<br />
701<br />
38<br />
647<br />
2<br />
576<br />
30<br />
522<br />
16<br />
492<br />
47<br />
267<br />
6<br />
275<br />
11<br />
227<br />
12<br />
112<br />
4<br />
54<br />
1<br />
16<br />
1<br />
1<br />
xxxxxxx>fxxxxxxxxxx SOOOOOOOO KOOOOOOOOOt OOOOOOftOOOO<br />
OOOOOOOC OOOOOOOC 3000OOO0C ¡KJOOOOOC -<br />
CXXXXXXXX CXXXXXXXXXX) xxxxxxxxxxx<br />
XXXXXXXX OOOOOOOC JOOOOOOO JOOOOOOOOO KJOOOOOOO<br />
OOOOOOOC OOOOOOOC D0OOOOOOa -<br />
5ÜOOOOOOOOC "<br />
OOOOOOOC OOOOOOOC OOOOOOOOC MOOOOOO -<br />
«XXXXXXXXXX CXXXXXXXXXXK<br />
OOOOOOOC OOOOOOOC 300000000<br />
xxxxxxxxjoooooooctooooooooodooooooooo XJOOOOOOOOOC OOOOOOOOOOO<br />
oooooooc oooooooc ooooooooa ooooooooboooooocloooooooobooooooo<br />
- CXXXXXXXX [XXXXXXXXXXX OOOOOOOOOOO<br />
xxxxxxx; oooooooc oooooooo- <br />
XXXXXXXJ OOOOOOOC OOOOOOOOC XÍOOOOO<br />
XXXXXXX (OOOOOOOOOC OOOOOOOOC OOOOOOOOOOO<br />
KXXXXXXXXKXXXXXX> OOOOOOOC OOOOOOOC<br />
(XXXXXXX tOOOOOOO >OOOOOOOOOCOOOOOOOOC OOOOOOOOOOO<br />
OOOOOOCX OOOOOOOC OOOOOOOOO MOOOOOOT<br />
OOOOOOCX OOOOOOOC OOOOOOOOC<br />
OOOOOOOC OOOOOOOC OOOOOOOOO<br />
(XXXXXXX<br />
XXXXXX» OOOMOOC OOOOOOOO MOOOOOC<br />
cxxxxx» OOOOOOOOOO KKXJOOOOO KJOOOOOOOOO<br />
XXXXXXX)OOOOOOOO JOOOOOOCOOOOOOOOOO SOOOOOOOO<br />
XXXXXXX] XXXXXXX)OOOOOOOOC 30000000 3OOOO0OC<br />
XXXXXXX) XXXXXXX] OOOOOOOC OOOOOOOO ÜOOOOOCK i<br />
XXXXXXX] XXXXXXX» OOOOOOOOC oooooooo<br />
OOOOOOOC OOOOOOOC OOOOOOOOOoooooooo<br />
OOOOOOOC OOOOOOOC DOOOOOOOO 50000000<br />
XXXXX ÍXXXXX<br />
[XXXXXXXXXXX<br />
:XXXXXXXXXXK<br />
xxxxxxxxxxpoooooooo «OOOOOOOOOO ÍOOOOOOOOOOS<br />
XXXXXXXXXXX? XXXXXXXXXXX<br />
~ XXXXXXXXXXX)XXXXXXXXXXX<br />
OOOOOOOOC XXXXXXXXXXX OOOOOOOOOOC<br />
(XXXXXXXXXX)<br />
KXXXXXXXXXX> KXXXXXXXXXX)<br />
ÜÜÜOOOC OOOOOOOOOO XWOOOOOO XJOOOOOOOOOC -<br />
«XXXXXXXXXX> OOOOOCXXXXX)<br />
KXXXXXXXXXX> kooooooooooc<br />
Alfalfa y otros pastos<br />
Cafia <strong>de</strong> azúcar<br />
Frutales diversos<br />
Otros cultivos industríales<br />
R/S<br />
R/S<br />
R/S<br />
R/S<br />
3,121<br />
474<br />
101<br />
246<br />
OOOOOOOC OOOOOOOC OOOOOOOOO OOOOOOOO OOOOOOOC oooooooo WOOOOOO KJOOOOOC OOOOOOOOOO toooooooo KJOOOOOOOOOO lOOOOOOOOOOO<br />
OOOOOOOC OOOOOOOC OOOOOOOOO OOOOOOOO OOOOOOOC OOOOOOOO KXXJOOOO «OOOOOC OOOOOOOOOO X>0000000 «OOOOOOOOOOO «OOOOOOOOOOO<br />
OOOOOOCX OOOOOOOC OOOOOOOOO OOOOOOOC OOOOOOOC OOOOOOOO >ooooooo »OOOOOOC OOOOOOOOOO XJOOOOOOO KXMOOOOOOOO lOOOOOOOOOOO<br />
Area Anual 51,599<br />
Total Area Cultivada Neta 46,525 47,621 47,941 <strong>45</strong>,541 31,8<strong>03</strong> 19,070 8,8<strong>03</strong> 7,196 8,873 18,632 30,977 43,779<br />
(*)<br />
Riego<br />
Secano<br />
Símbolos<br />
Siembra<br />
Crecimiento<br />
Cosecha<br />
xxxxx<br />
ooooo<br />
Fuente : ONERN
Pág. 404<br />
ZONA NORTE DE CAJAMARCA<br />
GRÁFICO N 0 2-DA<br />
FORMAS DE USO Df LA TIERRA Y CALENDARIOS DE CULTIVOS<br />
SECTOR II<br />
(1974-75)<br />
Cultivos<br />
Area da<br />
Producción<br />
R/S(*) Ha. Enero Febrero Marzo Abril Mayo Junio Julio Agosto Setiembre Octubre Noviembre Diciembre<br />
Cebada<br />
Cebada<br />
Maíz<br />
Mofz<br />
Trigo<br />
Trigo<br />
Papa<br />
Papa<br />
Arvefa, grano seco<br />
Arveja, grano seco<br />
Arveja, grano ver<strong>de</strong><br />
Arveja, grano ver<strong>de</strong><br />
Olluco<br />
Olluco<br />
Arroz<br />
Arroz<br />
Oca<br />
Oca<br />
Yuca<br />
Yuca<br />
Frijol<br />
Frijol<br />
Camote<br />
Camote<br />
Mortal izas varias<br />
Mortal Izas varias<br />
Lenteja<br />
Lenteja<br />
Maíz cha<strong>la</strong><br />
Mafc cha<strong>la</strong><br />
Haba<br />
Haba<br />
Otros cereales<br />
Otros cereales<br />
Otras tuberosas<br />
Otras tuberosos<br />
R<br />
S<br />
R<br />
S<br />
R<br />
S<br />
R<br />
S<br />
R<br />
S<br />
R<br />
S<br />
R<br />
S<br />
R<br />
S<br />
R<br />
S<br />
R<br />
S<br />
R<br />
S<br />
R<br />
S<br />
R<br />
S<br />
R<br />
S<br />
R<br />
S<br />
R<br />
S<br />
R<br />
S<br />
R<br />
S<br />
939<br />
6,391<br />
3,509<br />
3,789<br />
596<br />
3,869<br />
1,099<br />
1,791<br />
439<br />
1,799<br />
241<br />
819<br />
28<br />
978<br />
733<br />
8<br />
23<br />
502<br />
439<br />
30<br />
302<br />
72<br />
253<br />
19<br />
180<br />
64<br />
50<br />
151<br />
37<br />
88<br />
11<br />
110<br />
28<br />
73<br />
2<br />
5<br />
XXXXXXX3 XXXXXXXX >ooooooc sooooooa roooooooooc -<br />
XXXXXXXJ OOOOOOOC 300000000 XXKMMOC DOOOOOOp<br />
KXXXXXXXXX»<br />
KXXXXXXXfOCXXXXXXXX) OOOOOOCK» OOOOOOOOOOOiooooooooooo<br />
OOOOCXXX OOOOOOOC OOOOOOOOC<br />
(XXXXXXXX LXXXXXXXXXXX CXXXXXXXXXX)<br />
tXXXXXX>dxXXXXXXXbOOOOOOOOO< OOOOOOOOC 300000000004<br />
xxxxxxx: XXXXXXXJ ooooooooc xtoooooc DOOOOOOC<br />
XXXXXXXXXXX<br />
xxxxxxx4xxxxxxx)9cxxxxxx)q0ooooooapooooooooo< ooooooooc<br />
OOOOOOCX OOOOOOOC OOOOOOOOC<br />
OOOOOCXX OOOOOOOC<br />
OOOOOOOC OOOOOOOC OOOOOOOOC DOOOOOOC<br />
XXXXXXXJ OOOOOOOC OOOOOOOOC -<br />
XXXXXXXJ OOOOOOOC OOOOOOOOC OOOOOOOC<br />
xxxxxxx: xxxxxxx OOOOOOOC DOOOOOOC<br />
OOOOOOCX<br />
XXXXXXXJ OOOOOOOC OOOOOOOOC<br />
XXXXXXX) XXXXXXX)OOOOOOOOC OOOOOOOC<br />
OOOOOOOC OOOOOOOC ooooooooc<br />
(XXXXXXX KXXXXXXX >OOOOOOOOOC OOOOOOOOC -'<br />
cxxxxxx^xxxxxxxxpoooooooocxtooooooooc 50000000000<br />
KXXXXXXXXXX^XXXXXXXXXXX<br />
(XXXXXXXXXJjXXXXXXXXÍ XXXXXXXXXXX} XXXXXXXXXXX<br />
«xxxxxxx >ooooooooo( OOOOOOOOC DOOOOOOOOOOC ooooooooooo<br />
KXXXXXXX XJOOOOOOOOÍ OOOOOOOOC 30000000000 -'<br />
XXXXXXXXXXX) XXXXXXXXXXX<br />
xxxxxxx^xxxxxx)^xxxxxxxboooooodDooooooooo4cx>ooooooc|oocxx>oooooo(^ooooooooooo<br />
KXXXXXXX KXXXXXXXXX DOOOOOOOO KJOOOOOOOOOO xxxwoooooo<br />
KXXXXXXX Kxxxxxxxpoooooooooqooooooooc<br />
XXXXXXX)xxxxxxxx Dooooooobooooooooo4-<br />
XXXXXXX> KXXXXXX> DOOOOOOOOOt OOOOOOOOC<br />
XXXXXXXXXXX<br />
XXXXXXXXXXX<br />
Kxxxxxxxxkxxxxxxxxxxa soooooooooo<br />
XXXXXXXXXXX<br />
XXXXXXX) XXXXXXXX DOOOOOOC ¿ooooooooc*<br />
XXXXXXXXXXX)f XXXXXXXXXXX<br />
xxxxxxx)dxxxxxxx>toooooooooodooooooooc ooooooooooo<br />
XXXXXXXXXX)<br />
KXXXXXXXXXJ 300000000 XXXJOOOOOOOC 0000000000<br />
Alfalfa y otros pastos<br />
Cafta da azúcar<br />
Frutales di varaos<br />
Otros cultivos industriales<br />
R/S<br />
R/S<br />
R/S<br />
R/S<br />
2,124<br />
923<br />
361<br />
47<br />
OOOOOOOC OOOOOOOC OOOOOOOOC OOOOOOOC OOOOOOOC OOOOOOOC »oooooo >ooooooo toooooooooc OOOOOOOOC XJOOOOOOOOOC DOOOOOOOOO<br />
OOOOOOCX OOOOOOOC OOOOOOOOC OOOOOOOC OOOOOOCX OOOOOOOC OOOOOOOO >0000000 XXDOOOOOOCK OOOOOOOOC XJOOOOOOOOOC DOOOOOOOOO<br />
Area Anual 32,918<br />
Area Cultivada Neta 23,604 23,937 24,2<strong>03</strong> 21,835 18,740 13,124 10,657 9,486 11,5<strong>03</strong> 13,063 116,717 21,797<br />
(•)<br />
Riego<br />
Secano<br />
Símbolos<br />
Siembra<br />
Crecimiento<br />
Cosecha<br />
xxxxx<br />
ooooo<br />
Fuente : ONERN
DIAGNOSTICO AGROPECUARIO Pig. 405<br />
RELACIÓN ENTRE LA OFERTA Y DEMANDA DE MANO DE OBRA PARA TAREAS<br />
AGROPECUARIAS EN LA ZONA DE ESTUDIO<br />
Gráfico N" 3<br />
Oforta Total di Trabo(odorM<br />
(P.E.A. RURAL)<br />
Dtmanda Ttór<strong>la</strong>a<br />
Otmanda Eitoolonal<br />
40,000-<br />
J 50,000-<br />
'5<br />
J 40,000-<br />
2<br />
30,000-<br />
20,000-<br />
10^00-<br />
Meses
Pág. 406<br />
ZONA NORTE DE CAJAMARCA<br />
muy limitado <strong>de</strong>bido a un conjunto <strong>de</strong> factores interre<strong>la</strong>cionados entre sF, incidiendo prind<br />
pálmente los siguientes:<br />
Uso limitado, porque gran proporción <strong>de</strong> <strong>la</strong> producción no está ligada a <strong>la</strong> economPa<br />
<strong>de</strong> mercado; así", los cultivos <strong>de</strong> <strong>la</strong> papa y el arroz, que si tienen esta caracterrstica ,<br />
han <strong>de</strong>sarrol<strong>la</strong>do-un buen nivel tecnológico, que se manifiesta en el empleo <strong>de</strong> fertilizantes<br />
y pestici<strong>de</strong>s.<br />
Ubicación <strong>de</strong> <strong>la</strong>s unida<strong>de</strong>s <strong>de</strong> producción, <strong>de</strong>bido a que aquel<strong>la</strong>s que están cerca <strong>de</strong> los<br />
centros pob<strong>la</strong>dos o que tienen acceso a <strong>la</strong>s carreteras hacen uso más intenso <strong>de</strong> <strong>la</strong> tecno<br />
logia, en comparación con <strong>la</strong>s que carecen <strong>de</strong> vfas <strong>de</strong> comunicación.<br />
Precio <strong>de</strong> venta <strong>de</strong> los productos agrFco<strong>la</strong>s, en razón <strong>de</strong> que el mayor precio <strong>de</strong> venta<br />
<strong>de</strong> los productos estimu<strong>la</strong> <strong>la</strong> producción y para alcanzar este objetivo se recurre al uso<br />
<strong>de</strong> insumes (fertilizantes, pestici<strong>de</strong>s,, semil<strong>la</strong>s), cuya aplicación #xige innovaciones <strong>de</strong><br />
or<strong>de</strong>n tecnológico.<br />
Escasez y alto precio, que limita el uso <strong>de</strong> insumas y <strong>la</strong> adopción <strong>de</strong> nuevas tecnolo —<br />
gias, asfeomo <strong>la</strong> falta <strong>de</strong> un a<strong>de</strong>cuado sistema <strong>de</strong> asistencia técnica, especialmente <strong>de</strong><br />
extensión agríco<strong>la</strong>.<br />
Factores climáticos, que impi<strong>de</strong>n el empleo <strong>de</strong> tecnología, <strong>de</strong>bido a que un alto porcentaje<br />
<strong>de</strong> cultivos se conducen en secano, estando su <strong>de</strong>sarrollo ligado a <strong>la</strong> escasez o<br />
abundancia <strong>de</strong> lluvias.<br />
En cuanto al uso <strong>de</strong> insumes agríco<strong>la</strong>s, el <strong>de</strong> mayor trascen<strong>de</strong>ncia por<br />
su costo es <strong>la</strong> semil<strong>la</strong>, que presenta variaciones para <strong>de</strong>terminada especie aún <strong>de</strong>ntro <strong>de</strong> ca<br />
da sector; esta situación se acentúa más cuando existen variaciones climáticas <strong>de</strong>sfavora -<br />
bles.<br />
El bajo nivel <strong>de</strong> uso <strong>de</strong> pesticidas en los cultivos <strong>de</strong>termina que se<br />
produzcan pérdidas consi<strong>de</strong>rables en <strong>la</strong> producción. Esta inci<strong>de</strong>ncia es mayor en el cultivo<br />
<strong>de</strong> <strong>la</strong> papa, tubérculos menores, hortalizas, menestras y frutales diversos, <strong>de</strong>bido a que son<br />
atacados por p<strong>la</strong>gas, enfermeda<strong>de</strong>s y ma<strong>la</strong>s hierbas, a pesar que son contro<strong>la</strong>bles en <strong>la</strong> ac -<br />
tualidad mediante productos químicos, medios culturales y biológicamente.<br />
En el Cuadro N" 12-DA, se observa que el valor <strong>de</strong> los insumos agrf<br />
co<strong>la</strong>s utilizados en <strong>la</strong> campaña agríco<strong>la</strong> 1974-75 alcanzó a S/.108 l 392,000,00,<strong>de</strong>stacando<br />
que el monto invertido en semil<strong>la</strong>s representó el 81.3%, en los fertilizantes el 15.6% y en<br />
pesticidas el 3,1% <strong>de</strong>l valor total| el valor <strong>de</strong> <strong>la</strong>s semil<strong>la</strong>s generalmente es absorbido por<br />
pocos cultivos, requiriendo en el caso <strong>de</strong> <strong>la</strong> papa <strong>de</strong> un gran <strong>volumen</strong> por unidad <strong>de</strong> área,<br />
lo cual motiva que se tenga un promedio <strong>de</strong> inversión <strong>de</strong> S/.l,040.00 por Ha. cultivada ;<br />
en contraposición^, el promedio <strong>de</strong> inversión <strong>de</strong> fertilizantes por Ha, sólo llega a S/.200 o 00<br />
y, se se consi<strong>de</strong>ra que una proporción significativa <strong>de</strong> ese valor es invertida en el cultivo<br />
<strong>de</strong> papa, se pue<strong>de</strong> concluir que en <strong>la</strong> zona eí uso <strong>de</strong> abonos es muy limitado. En el caso <strong>de</strong><br />
pesticidas^ su empleo también se dirige al cultivo <strong>de</strong> papa y <strong>de</strong> arroz, cuyos productos son<br />
<strong>de</strong> intercambio.
CUADRO N 0 12-DA £<br />
VALOR DE LOS IN SUMOS AGRÍCOLAS POR SECTORES 2<br />
><br />
o<br />
z<br />
Sectores<br />
Area Anual <strong>de</strong><br />
Producción<br />
Ha.<br />
%<br />
Semil<strong>la</strong>s<br />
Miles <strong>de</strong> S/.<br />
%<br />
(1974-1975) g<br />
o<br />
Fertilizantes<br />
Miles <strong>de</strong> S/.<br />
%<br />
Pestici<strong>de</strong>s<br />
Miles <strong>de</strong> S/»<br />
%<br />
Total<br />
Miles <strong>de</strong> %/. %<br />
1 (Norte)<br />
51,599<br />
61.0<br />
53,773<br />
61.1<br />
8,158<br />
48.9<br />
1,936<br />
53.6<br />
63,867<br />
58.9<br />
Cutervo<br />
Chota<br />
Santa Cruz<br />
Hualgayoc<br />
16,081<br />
16,423<br />
1,993<br />
17,102<br />
19.0<br />
19o4<br />
2,4<br />
20.2<br />
11,247<br />
17,681<br />
1,695<br />
23,150<br />
12.8<br />
20.1<br />
1.9<br />
26.3<br />
1,633<br />
3,702<br />
320<br />
2,5<strong>03</strong><br />
9.8<br />
22.2<br />
1.9<br />
15.0<br />
380<br />
901<br />
48<br />
607<br />
10.5<br />
25.0<br />
1.3<br />
16.8<br />
13,260<br />
22,284<br />
2,063<br />
26,260<br />
12.2<br />
20.6<br />
1.9<br />
24.2<br />
II (Sur)<br />
32,918<br />
39.0<br />
34,335<br />
38.9<br />
8,521<br />
51.1<br />
1,669<br />
46.4<br />
44,525<br />
41.1<br />
Cajamarca<br />
San Miguel<br />
Contumazá<br />
Total<br />
17,616<br />
11,173<br />
4,129<br />
84,517<br />
20.8<br />
13.3<br />
4.9<br />
100.00<br />
18,073<br />
12,444<br />
3,818<br />
88,108<br />
20.5<br />
14.1<br />
4.3<br />
100.00.<br />
3,746<br />
3,409<br />
1,366<br />
16,679<br />
22.5<br />
20.4<br />
8.2<br />
100.00<br />
763<br />
705<br />
¿01<br />
3,605<br />
21.2<br />
19.6<br />
5.6<br />
100.00<br />
22,582<br />
16,558<br />
5,385<br />
108,392<br />
20.8<br />
15.3<br />
5.0<br />
100.00<br />
Promedio <strong>de</strong> Inversion por Ha.<br />
1,040<br />
200<br />
40<br />
1,280<br />
Valor porcentual<br />
81.3%<br />
15.6%<br />
3.1%<br />
100.0%<br />
Fuente : ONERN.<br />
era<br />
o<br />
-3
Pa? 408<br />
ZONA<br />
NORTE DF CATAMARCA<br />
A nivel global, resulta que el promedio <strong>de</strong> inversión alcanza a S/.<br />
1,280,00 por hectárea, suma insignificante que <strong>de</strong>muestra <strong>la</strong> existencia <strong>de</strong> una agricultura<br />
tradicional. Suponiendo que se fertilizaran 33,500 Ha, <strong>de</strong> maíz y 8,575 Ha. <strong>de</strong> papa con<br />
400 Kg/Ha, <strong>de</strong> una mezc<strong>la</strong> <strong>de</strong> 60-40-40 <strong>de</strong> N, P, K, se tendría <strong>la</strong> necesidad <strong>de</strong> adquirir<br />
16,800 TM <strong>de</strong> estos productos con un costo adicional <strong>de</strong> S/. 168"000,000.00, Este tipo <strong>de</strong><br />
especu<strong>la</strong>ción permite dimensionar el atraso <strong>de</strong>l sector agrario y <strong>la</strong> necesidad <strong>de</strong> implemen -<br />
tar una a<strong>de</strong>cuada estructura <strong>de</strong> comercialización, almacenamiento, distribución y financia<br />
clon <strong>de</strong> insumos en <strong>la</strong> zona, si es que se <strong>de</strong>sea que esta actividad <strong>de</strong>sarrolle.<br />
En el caso <strong>de</strong> <strong>la</strong> actividad pecuaria, <strong>la</strong> tecnología se limita al uso<br />
<strong>de</strong> vacunas, medicamentación antiparasitaria y el uso eventual <strong>de</strong> medicinas <strong>de</strong> emergen -<br />
cia. En cuanto al uso <strong>de</strong> tecnologfa, merece <strong>de</strong>stacar <strong>la</strong> explotación vacuna que se realiza<br />
en el fundo Huacraucro, con una pob<strong>la</strong>ción <strong>de</strong> más <strong>de</strong> 5,000 cabezas, a <strong>la</strong>s que se les<br />
proporciona alimentación a base <strong>de</strong> pastos cultivados (mezc<strong>la</strong>s <strong>de</strong> gramíneas y leguminosas),<br />
manejo a<strong>de</strong>cuado y asistencia sanitaria oportuna, obteniendo buenos rendimientos como re<br />
sultado <strong>de</strong> <strong>la</strong> a<strong>de</strong>cuada administración <strong>de</strong> esta empresa asociativa. En contraposición, se<br />
pudo observar que en <strong>la</strong>s explotaciones lecheras tradicionales, <strong>la</strong> tecnología aplicada resul<br />
ta muy <strong>de</strong>ficiente, <strong>de</strong>bido al ba¡o nivel <strong>de</strong> conocimientos, tanto en lo referente a cruces ,<br />
manejo y alimentación como en el aspecto sanitario; en el campo agríco<strong>la</strong>, esta situación<br />
es simi<strong>la</strong>r, lo cual pue<strong>de</strong> atribuirse a <strong>la</strong> ausencia <strong>de</strong> un sistema <strong>de</strong> extensión agrfco<strong>la</strong> y a<br />
<strong>la</strong> <strong>de</strong>sorganización <strong>de</strong> los agricultores, que les imposibilita financiar un servicio <strong>de</strong> esta na<br />
tu raleza.<br />
d. Capital <strong>de</strong> Trabajo<br />
El capital <strong>de</strong> trabajo está expresado sólo por los costos directos <strong>de</strong><br />
producción, en <strong>la</strong> actividad agríco<strong>la</strong> se consi<strong>de</strong>ra como tales los gastos en insumos^ en mano<br />
<strong>de</strong> obra y en tracción animal, en <strong>la</strong> actividad pecuaria, los gastos directos están represen<br />
todos por los <strong>de</strong>al rmeniación, <strong>de</strong> mano <strong>de</strong> obra /<strong>de</strong> medicinas, no habiérdose consi<strong>de</strong>rado dado"<br />
el nivel <strong>de</strong> estudio, otros gastos que intervienen en el proceso productivo. En el caso <strong>de</strong> ia<br />
actividad agríco<strong>la</strong>, el capital <strong>de</strong> trabajo casi en su totalidad proviene <strong>de</strong>l agricultor y <strong>de</strong><br />
<strong>la</strong>s inversiones realizadas que, por lo general, resultan insuficientes; esto es explicable por<br />
<strong>la</strong> actitud cautelosa <strong>de</strong>l agricultor al no comprometer un capital fuerte por los riesgos que<br />
implica <strong>la</strong> producción, así como por <strong>la</strong> variabilidad <strong>de</strong> los precios <strong>de</strong> venta <strong>de</strong> los productos<br />
en chacra„<br />
En el caso <strong>de</strong> <strong>la</strong> producción pecuaria, el capital <strong>de</strong> trabajo proce<strong>de</strong><br />
íntegramente <strong>de</strong>l gana<strong>de</strong>ro-agricultor y los gastos que realiza se dirigen preferentemente a<br />
ia obtención <strong>de</strong> medicinas y al pago <strong>de</strong> <strong>la</strong> mano <strong>de</strong> obra en algunos casos, ya que <strong>la</strong> mayor<br />
proporción en este rubro es aportado por el gana<strong>de</strong>ro con su familia.<br />
(1). Costos Directos <strong>de</strong> Producción Agropecuaria<br />
Tal como se muestra en el Cuadro N 0 13-DA, los costos directos <strong>de</strong> <strong>la</strong> producción agrí<br />
co<strong>la</strong> alcanzan a S/.335*725,000.00, correspondiendo <strong>la</strong> mayor inversión al Sector I
1—1<br />
><br />
o<br />
z<br />
o<br />
CUADRO N° 13-DA «*?<br />
—= ••••-'••=•• i-J<br />
COSTOS DIRECTOS DE PRODUCCIÓN AGRÍCOLA 0<br />
><br />
(1974-1975), , , / O<br />
Sectores<br />
Area Anual <strong>de</strong><br />
Producción<br />
Ha,<br />
lo<br />
Miles<br />
SI<br />
Insumos<br />
%<br />
Mano <strong>de</strong> Obra<br />
Miles<br />
SI<br />
%<br />
=, =, ==—= «n<br />
Tracción<br />
Miles<br />
S/<br />
%<br />
Otros Gastos<br />
Miles<br />
SI<br />
%<br />
Miles<br />
SI<br />
Total<br />
%<br />
I<br />
CNorte,)<br />
Cutervo<br />
Chota<br />
Santa Cruz<br />
Hualgavoc<br />
51.599<br />
16,801<br />
16,423<br />
1,993<br />
17.102<br />
61.0<br />
19,0<br />
19.4<br />
2.4<br />
20.2<br />
63,867<br />
13,260<br />
22,284<br />
2,063<br />
26,260<br />
58.9<br />
12.2<br />
20.6<br />
1.9<br />
24.2<br />
63.578<br />
18,753<br />
20,728<br />
2,574<br />
21 523<br />
60 9<br />
18.0<br />
19.9<br />
2,5<br />
20 6<br />
57,369<br />
15,105<br />
19,416<br />
2,250<br />
20 598<br />
62,0<br />
16.3<br />
21,0<br />
2,4<br />
22J3<br />
18,483<br />
4,714<br />
6,243<br />
689<br />
6.837<br />
60,6<br />
15,4<br />
20,5<br />
2.3<br />
22,4<br />
2<strong>03</strong>.297<br />
51,832<br />
68,671<br />
7,576<br />
75,218<br />
60 6<br />
15,4<br />
20.5<br />
2.3<br />
22.4<br />
II.<br />
(Sur)<br />
32,918<br />
&(< 0<br />
44,525<br />
41 1<br />
40,807<br />
39,1<br />
35,053<br />
38 0<br />
12,043<br />
39,4<br />
132,428<br />
39,4<br />
C ajamarca<br />
San Miguel<br />
Contumazá<br />
17,616<br />
11,173<br />
4.129<br />
20,8<br />
13,3<br />
4.9<br />
22,582<br />
16,558<br />
5.385<br />
20,8<br />
15 3<br />
5.0<br />
22,620<br />
12,901<br />
5,286<br />
21 7<br />
12 4<br />
5.0<br />
18,932<br />
11,535<br />
4.586<br />
20,5<br />
12.5<br />
5.0<br />
6,416<br />
4,099<br />
1.528<br />
21.0<br />
13,4<br />
5,0<br />
70,550<br />
<strong>45</strong>,093<br />
16.785<br />
21.0<br />
13.4<br />
5.0<br />
Total<br />
84,517<br />
100,0<br />
108,392<br />
100.0<br />
104,385<br />
100.0<br />
92,422<br />
100,0<br />
30,526<br />
100.0<br />
335,725<br />
100.0<br />
Valor Porcentual<br />
32.3%<br />
31.1%<br />
27.5%<br />
9.1%<br />
100.0%<br />
Fuente : ONERN<br />
•T3
CUADRO N" 14-DA<br />
COSTOS DIRKTOS DE PRODUCCIÓN AGRÍCOLA<br />
HA<br />
#><br />
l-«<br />
o<br />
Cultivos<br />
Area Anual <strong>de</strong><br />
Producción<br />
Insumos<br />
Mano <strong>de</strong> Obra<br />
Tracclín<br />
Otros Gastos<br />
Total<br />
Ha.<br />
%<br />
Miles <strong>de</strong> %/.<br />
%<br />
Miles <strong>de</strong> $/.<br />
%<br />
Milu <strong>de</strong> V.<br />
%<br />
Miles <strong>de</strong> S/.<br />
%<br />
Miles <strong>de</strong> S/.<br />
%<br />
1 Industriales<br />
1,690<br />
2.0<br />
464<br />
0.4<br />
5,391<br />
5.2<br />
555<br />
0.6<br />
643<br />
2.1<br />
7,053<br />
2.1<br />
Caña <strong>de</strong> azúcar<br />
Café<br />
Otros cultivos<br />
1,397(*)<br />
251<br />
42<br />
1.7<br />
0.3<br />
0.0<br />
464<br />
—<br />
—<br />
0.4<br />
—<br />
—<br />
5,025<br />
301<br />
65<br />
4.8<br />
0.3<br />
0.1<br />
555<br />
—<br />
—<br />
0.6<br />
—<br />
—<br />
605<br />
31<br />
7<br />
2.0<br />
0.1<br />
0.0<br />
6,649<br />
332<br />
72<br />
2.0<br />
0.1<br />
0.0<br />
II<br />
Alimenticios<br />
77,399<br />
91.6<br />
107,049<br />
99.0<br />
95,974<br />
92.0<br />
91,3*9<br />
98.9<br />
29,460<br />
96.5<br />
324,<strong>03</strong>2<br />
96.5<br />
Papa<br />
Mafz<br />
Cebada<br />
Arveja, grano seco<br />
Trigo<br />
Arroz<br />
Arveja, grano ver<strong>de</strong><br />
01 luco<br />
Oca<br />
Camote<br />
Yuca<br />
Lenteja<br />
Hortalizas varias<br />
Otros tubérculos<br />
Frijol<br />
Plátanos<br />
Haba<br />
Otros frutales<br />
Otros cereales<br />
CÍITÍCOS<br />
8,575<br />
33,399<br />
12,662<br />
5,776<br />
4,7<strong>03</strong><br />
743<br />
1,7<strong>45</strong><br />
2,469<br />
1,995<br />
824<br />
783<br />
779<br />
368<br />
714<br />
882<br />
255<br />
402<br />
147<br />
118<br />
60<br />
10.1<br />
39.5<br />
15.0<br />
6.8<br />
5.6<br />
0.9<br />
2.1<br />
2.9<br />
2.4<br />
1.0<br />
0.9<br />
0.9<br />
0.4<br />
0.9<br />
1.0<br />
0.3<br />
0.5<br />
0.2<br />
0.1<br />
0.1<br />
63,333<br />
13,359<br />
8,104<br />
6,930<br />
3,762<br />
2,973<br />
2,790<br />
1,853<br />
1,197<br />
412<br />
392<br />
312<br />
810<br />
359<br />
265<br />
—<br />
322<br />
—<br />
76<br />
—-<br />
58.4<br />
12.3<br />
7.5<br />
6.4<br />
3.5<br />
2.7<br />
2.6<br />
1.7<br />
1.1<br />
0.4<br />
0.4<br />
0.3<br />
0.8<br />
0.3<br />
0.2<br />
0.3<br />
_<br />
0.1<br />
—<br />
20,579<br />
40,078<br />
9,497<br />
5,198<br />
4,233<br />
2,706<br />
2,092<br />
2,963<br />
2,394<br />
988<br />
1,175<br />
701<br />
883<br />
857<br />
530<br />
384<br />
361<br />
177<br />
89<br />
89<br />
19.7<br />
38.4<br />
9.1<br />
5.0<br />
4.1<br />
2.6<br />
2.0<br />
2.8<br />
2.3<br />
0.9<br />
1.1<br />
0.7<br />
0.9<br />
0.8<br />
0.5<br />
0.4<br />
0.3<br />
0.2<br />
0.1<br />
0.1<br />
21,439<br />
33,399<br />
12,662<br />
6,719<br />
4,7<strong>03</strong><br />
978<br />
2,000<br />
2,469<br />
1,995<br />
988<br />
935<br />
934<br />
368<br />
714<br />
443<br />
—<br />
482<br />
—<br />
121<br />
—<br />
23.2<br />
36.1<br />
13.7<br />
7.3<br />
5.1<br />
1.1<br />
2.2<br />
2.8<br />
2.2<br />
1.1<br />
1.0<br />
1.0<br />
0.4<br />
0.7<br />
0.4<br />
—<br />
0.5<br />
—<br />
0.1<br />
10,535<br />
8,682<br />
3,026<br />
1,884<br />
1,271<br />
666<br />
689<br />
728<br />
559<br />
239<br />
250<br />
196<br />
206<br />
193<br />
124<br />
39<br />
118<br />
18<br />
28<br />
9<br />
34.5<br />
28.4<br />
9.9<br />
6.2<br />
4.2<br />
2.2<br />
2.3<br />
2.4<br />
1.8<br />
0.8<br />
0.8<br />
0.6<br />
0.7<br />
0.6<br />
0.4<br />
0.1<br />
0.4<br />
0.1<br />
0.1<br />
0.0<br />
115,886<br />
95,518<br />
33,289<br />
20,731<br />
13,969<br />
7,323<br />
7,571<br />
8,013<br />
6,1<strong>45</strong><br />
2,627<br />
2,752<br />
2,143<br />
2,267<br />
2,123<br />
1,362<br />
423<br />
1,283<br />
195<br />
314<br />
98<br />
34.5<br />
28.4<br />
9.9<br />
6.2<br />
4.2<br />
2.2<br />
2^<br />
2.4<br />
1.8<br />
0.8<br />
0.8<br />
0.6<br />
0.7<br />
0.6<br />
0.4<br />
0.1<br />
0.4<br />
0.1<br />
0.1<br />
0.0<br />
N<br />
O<br />
z<br />
><br />
z<br />
o<br />
po<br />
H<br />
m<br />
III<br />
Pastos y Forrajes<br />
Trébol + Rye grass<br />
Otros forrajes<br />
Alfalfa<br />
Mafz cha<strong>la</strong><br />
TOTAL<br />
5,428<br />
1,196<br />
3,483<br />
566<br />
183<br />
84,517<br />
6.4<br />
1.4<br />
4.1<br />
0.7<br />
0.2<br />
100.0<br />
879<br />
181<br />
—<br />
264<br />
234<br />
108,392<br />
(*) El área <strong>de</strong> cosecha anual <strong>de</strong> <strong>la</strong> caña <strong>de</strong> azúcar equivale al 50%.<br />
Fuente: ONERN -1975.<br />
0.6<br />
0.2<br />
—<br />
0.2<br />
0.2<br />
100.0<br />
3,020<br />
1,076<br />
1,047<br />
678<br />
219<br />
104,385<br />
2.8<br />
1.0<br />
1.0<br />
0.6<br />
0.2<br />
100.0<br />
518<br />
128<br />
—<br />
207<br />
183<br />
92,422<br />
0.5<br />
0.1<br />
—<br />
0.2<br />
0.2<br />
100.0<br />
423<br />
139<br />
106<br />
115<br />
63<br />
30,526<br />
1.4<br />
0.5<br />
0.3<br />
0.4<br />
0.2<br />
100.0<br />
4,640<br />
1,524<br />
1,153<br />
1,264<br />
699<br />
335,725<br />
1.4<br />
0.5<br />
0.3<br />
0.4<br />
0.2<br />
100.0<br />
O<br />
m<br />
O<br />
><br />
•—I<br />
><br />
><br />
n<br />
> •
Sectores<br />
I ¿Nortel<br />
Mi&s <strong>de</strong><br />
s/.<br />
.178.980.<br />
Vacunos<br />
"lo<br />
56.3<br />
Miles <strong>de</strong><br />
s/.<br />
7.727<br />
CUADRO N" 15-DA<br />
COSTO DE PRODUCCIÓN PECUARIA POR ESPECIES<br />
Ovinos<br />
lo<br />
'47.0<br />
Miles <strong>de</strong><br />
s/.<br />
12.143<br />
1974-1975<br />
Porcinos<br />
lo<br />
66.6<br />
Aves<br />
Miles <strong>de</strong><br />
s/.<br />
. 8.654 .<br />
lo<br />
63.2<br />
Miles <strong>de</strong><br />
S/.<br />
8.069<br />
Cuyes<br />
«fc<br />
68.0<br />
Miles <strong>de</strong><br />
s/.<br />
? m.573<br />
Total<br />
lo<br />
56.8<br />
O<br />
I—t<br />
><br />
o<br />
z<br />
o<br />
Vi<br />
H<br />
I—t<br />
n<br />
o<br />
•><br />
CD<br />
TO<br />
O<br />
-o<br />
n<br />
><br />
50<br />
Cutervo<br />
Chota<br />
Santa Cruz<br />
Hualgayoc<br />
56,500<br />
55,840<br />
11,760<br />
51,880<br />
18.1<br />
17.8<br />
3.8<br />
16.6<br />
2,006<br />
2,239<br />
213<br />
3,269<br />
12.2<br />
13.6<br />
1.3<br />
19.9<br />
4.054<br />
3,956<br />
443<br />
3,690<br />
22.2<br />
21.7<br />
2.4<br />
20.3<br />
3,238<br />
2,725<br />
595<br />
2,096<br />
23.6<br />
19.9<br />
4.4<br />
15.3<br />
1.204<br />
981<br />
179<br />
705<br />
26.7<br />
21.7<br />
4.0<br />
15.6<br />
67,002<br />
65,741<br />
13,190<br />
61.640<br />
18.3<br />
18.0<br />
3.6<br />
16.9<br />
II fSur)<br />
136.9Q0<br />
43.7<br />
8.699<br />
53.0<br />
6.080<br />
33.4<br />
5.051<br />
36.8<br />
1:448*<br />
32.0<br />
158.178<br />
43.2<br />
Cajamarca<br />
San Miguel<br />
Contumazá<br />
56, 740<br />
59,840<br />
29.320<br />
18.1<br />
19.1<br />
6.5<br />
3,870<br />
2,890<br />
1.939<br />
23.6<br />
17.6<br />
11.8<br />
2,646<br />
2,383<br />
1.051<br />
14.5<br />
13.1<br />
5.8<br />
2,210<br />
1,601<br />
1.240<br />
16.1<br />
11.7<br />
9.0<br />
499<br />
606<br />
343<br />
11.0<br />
13.4<br />
7.6<br />
65,965<br />
67,320<br />
24.893<br />
18.0<br />
18.4<br />
6.8<br />
Total<br />
312,880<br />
100.0<br />
16,426<br />
100.0<br />
18,223<br />
100.0<br />
13,705<br />
100.0<br />
4,517<br />
100.0<br />
365,751<br />
100.0<br />
Valor Porcentual<br />
85,6%<br />
4.5 0 /
Pág. 412 ZONA NORTE DE CAJAMARCA<br />
(Norte), que <strong>de</strong>mandó el 60.6% <strong>de</strong>l total; a nivel <strong>de</strong> subsectores, Hualgayoc, Caja -<br />
marca y Chota tuvieron los mayores gastos al requerir el 22.4%, 21.0% y el 20.5%<strong>de</strong>l<br />
total, respectivamente. En el valor <strong>de</strong> los costos directos, los insumas representan el<br />
32.2%, <strong>la</strong> mano <strong>de</strong> obra el 31.1% y <strong>la</strong> tracción el 27.5%, tal como se <strong>de</strong>tal<strong>la</strong> en el ci<br />
tado Cuadro.<br />
Analizando los costos <strong>de</strong> producción a nivel <strong>de</strong> zona estudiada, en los diferentes culti<br />
vos se tiene que <strong>la</strong> papa <strong>de</strong>mandó el 34.5%, el mafz el 28.4%, <strong>la</strong> cebada el 9.9% y<br />
<strong>la</strong> arveja grano seco el 6^2% <strong>de</strong>l valor total, tal como se observa en el Cuadro N 0 14-<br />
DA. Estos mayores costos en <strong>la</strong> papa se <strong>de</strong>ben al alto valor <strong>de</strong> <strong>la</strong>s semil<strong>la</strong>s y, en el<br />
maTz, a <strong>la</strong> amplitud <strong>de</strong>l área <strong>de</strong> cultivo en <strong>la</strong> zona. Los costos directos <strong>de</strong> producción<br />
por cultivo y por subsectores se observan en los Cuadros N 0 10, 11, 12, 13, 14, 15 y<br />
16 <strong>de</strong>l Anexo VI „ Es importante seña<strong>la</strong>r que, en el rubro mano <strong>de</strong> obra, no se ha consi<strong>de</strong>rado<br />
el aporte <strong>de</strong> <strong>la</strong> familia, ya que <strong>de</strong> hacerse efectivo este valor, <strong>la</strong> participa -<br />
ción <strong>de</strong> este rubro tendría un incremento significativo.<br />
En el Cuadro N 0 1 5-DA, se muestra el estimado <strong>de</strong> los costos directos <strong>de</strong> <strong>la</strong> producción<br />
pecuaria que, en conjunto, alcanzaron a S/.365751,000„00; <strong>de</strong> este total, el 56„8%<br />
fue <strong>de</strong>mandado por el Sector I (Norte) y <strong>la</strong> diferencia por el Sector II (Sur). A nivel<br />
<strong>de</strong> subsectores, <strong>la</strong> mayor proporción le correspondió a San Miguel y Cutervo, con el<br />
18.4% y el 18.3%, y los menores porcentajes, a Santa Cruz y Contumazá, con el<br />
3.6% y 6.8% <strong>de</strong>l costo total, respectivamente.<br />
Realizando un análisis por tipo <strong>de</strong> crianza, se observa que el costo <strong>de</strong> mayor significación<br />
correspon<strong>de</strong> a <strong>la</strong> explotación vacuna (85.6%), siendo reducida <strong>la</strong> participación <strong>de</strong><br />
<strong>la</strong>s crianzas <strong>de</strong> ovinos, porcinos, aves y cuyes. En el costo total, lo que se paga en<br />
efectivo es el valor <strong>de</strong> <strong>la</strong>s medicinas, no haciéndose en los otros rubros <strong>de</strong>sembolsos mo<br />
netarios, por que <strong>la</strong> alimentación es a base <strong>de</strong> pastos naturales y <strong>la</strong> mano <strong>de</strong> obra es<br />
familiar; esto inci<strong>de</strong> negativamente en <strong>la</strong> economia <strong>de</strong>l agricultor y/o gana<strong>de</strong>ro, porque<br />
tras<strong>la</strong>da el valor agregado a <strong>la</strong>s ciuda<strong>de</strong>s, don<strong>de</strong> se le abonan precios que, en muchos<br />
casos, están por <strong>de</strong>bajo <strong>de</strong>l costo <strong>de</strong> producción y no le permite <strong>de</strong>sarrol<strong>la</strong>r su capacidad<br />
empresarial.<br />
En resumen, los costos directos <strong>de</strong> producción agropecuaria alcanzaron a S/.<br />
701'476,000. 00, correspondiendo el 52.1% y el 47„9% <strong>de</strong> <strong>la</strong> inversión a <strong>la</strong>s activida<strong>de</strong>s<br />
agríco<strong>la</strong>s y pecuarias, respectivamente. Desagregando los costos estimados por sec<br />
tores, se observa que el Sector I (Norte) absorbió el 58.6% <strong>de</strong>l total y el Sector II (Sur)<br />
captó <strong>la</strong> diferencia (41.4%); a nivel <strong>de</strong> subsectores, los que <strong>de</strong>mandaron <strong>la</strong> mayor in -<br />
versión fueron los <strong>de</strong> Hualgayoc, Cajamarca y Chota, con el 19.5% y el 19,2% <strong>de</strong>l<br />
total, respectivamente, tal como se observa en el Cuadro N 0 16-DA.<br />
e. Utilida<strong>de</strong>s Estimadas <strong>de</strong> <strong>la</strong> Actividad Agropecuaria<br />
Las utilida<strong>de</strong>s generadas por <strong>la</strong> actividad agropecuaria alcanzaron a<br />
S/.380 , 396,000.00, correspondiendo el mayor aporte al Sector I (Norte) con el 54.3% <strong>de</strong>l
DIAGNOSTICO AGROPECUARIO Pig. .413<br />
CUADRO N 0 16-DA<br />
COSTOS DIRECTOS DE LA PRODUCCIÓN AGROPECUARIA<br />
(1974-1975)<br />
Sectores<br />
Costos Agríco<strong>la</strong>s<br />
Miles <strong>de</strong> S/.<br />
%<br />
Costos Pecuarios<br />
Miles <strong>de</strong> S/.<br />
%<br />
Costos Agropecuarios |<br />
Miles <strong>de</strong>S/.<br />
%<br />
i<br />
(Norte)<br />
2<strong>03</strong>, 297<br />
60.6<br />
207,573<br />
56.8<br />
410,870<br />
58,6<br />
Cutervo<br />
Chota<br />
Santa Cruz<br />
Huaigayoc<br />
II (Sur)<br />
51,832<br />
68,671<br />
7,576<br />
75,218<br />
132,428<br />
15.4<br />
20.5<br />
2.3<br />
22.4<br />
39.4<br />
67,002<br />
65,741<br />
13,190<br />
61,640<br />
158,178<br />
18.3<br />
18.0<br />
3.6<br />
16.9<br />
43.2<br />
118,834<br />
134,412<br />
20,766<br />
136,858<br />
290,606<br />
17.0<br />
19.2 !<br />
2.9 í<br />
•9.5 !<br />
i<br />
41.4 i<br />
Ca¡amarca<br />
San Miguel<br />
Contumazá<br />
70,550<br />
<strong>45</strong>,093<br />
16,785<br />
21.0<br />
13.4<br />
5.0<br />
65,965<br />
67,320<br />
24,893<br />
18.0<br />
18.4<br />
6.8<br />
136,515<br />
112,413<br />
41,678<br />
19.5 !<br />
ló.O |<br />
5.9 i<br />
Total<br />
335,725<br />
100.0<br />
365,751<br />
100.0<br />
701,476 100.0 j<br />
Valor Porcentual<br />
47.9 %<br />
52.1 -'o<br />
100.0 >ó<br />
Fuente<br />
ONERN<br />
— 1<br />
total y <strong>la</strong> diferencia al Sector II (Sur); si se hace el análisis por tipo <strong>de</strong> actividad, se tiene<br />
que <strong>la</strong> gana<strong>de</strong>rfa es <strong>la</strong> más importante, ya que generó el 54.8% <strong>de</strong> los ingresos totales y ia<br />
agricultura aportó el <strong>45</strong>.2% restante, tal como se muestra en el Cuadro N 0 17-DA. Á ni -<br />
vel <strong>de</strong> subsectores, se observa que Cajamarca y Cutervo son los que hicieron los mcyores a<br />
portes (20.6% y 19.2% <strong>de</strong>l total, respectivamente); en cambio, Santa Cruz y Conrumazá<br />
son los que obtuvieron <strong>la</strong>s menores utilida<strong>de</strong>s (2.4% y 7.9% <strong>de</strong>l total).<br />
La mayor utilidad generada por <strong>la</strong> actividad pecuaria pone en evi -<br />
<strong>de</strong>ncia <strong>la</strong> importancia que tiene en esta zona, ya que permite transformar en carne y leche<br />
los recursos naturales (pastos y rastrojos) que, <strong>de</strong> otra manerq, no serían aprovechados y cu<br />
yo valor alcanzó a S/.208'<strong>45</strong>5 f 000.00; <strong>de</strong> ese total, <strong>la</strong> explotación vacuna aportó el 55.3<br />
%, mientras que en <strong>la</strong>s otras crianzas los aportes son menores, siendo en aves <strong>de</strong>l or<strong>de</strong>n <strong>de</strong><br />
17.1% y en porcinos <strong>de</strong>l 12.4%, tal como se observa en el Cuadro N 0 18-DA. Cabe men -<br />
clonar que <strong>la</strong> explotación ovina es <strong>la</strong> que aporta menos y <strong>de</strong>¡a menores utilida<strong>de</strong>s, situación<br />
que pue<strong>de</strong> atribuirse a que <strong>la</strong> explotación se lleva a cabo en minifundios, con técnicas <strong>de</strong><br />
crianza muy rudimentarias y en condiciones muy sensibles a <strong>la</strong> alicuya y otras enfermeda<strong>de</strong>s.
Pág. 414 ZONA NORTE DE CAJAMARCA<br />
En <strong>la</strong> actividad agríco<strong>la</strong>, <strong>la</strong>s utilida<strong>de</strong>s obtenidas durante <strong>la</strong> cam —<br />
paña 1974-1975 alcanzaron a S/. 171 '951,000.00, <strong>de</strong>stacando los aportes generados por el<br />
Sector I (Norte), que alcanzaron al 57.2% <strong>de</strong>l total, correspondiendo el 42.8% al Sector<br />
II (Sur). A nivel <strong>de</strong> subsectores, los mayores aportes fueron generados por Cajamarca,<br />
Hualgayoc y Chota con el 22.1%, 19.5% y el 19.4% <strong>de</strong>l valor total, respectivamente,<br />
tal como se observa en el Cuadro N 0 19-DA. Analizando <strong>la</strong> participación que tienen los<br />
cultivos en <strong>la</strong> formación <strong>de</strong> <strong>la</strong>s utilida<strong>de</strong>s, se tiene que <strong>la</strong> papa aportó el 23.5%, el maiz<br />
22.2%, <strong>la</strong> cebada el 10.1%, <strong>la</strong> arveja grano seco el 8.1% y <strong>la</strong> caña <strong>de</strong> azúcar el 6.3%<br />
<strong>de</strong>l valor total, como se pue<strong>de</strong> observar en el Cuadro N o 20-DA. El mayor .aporte <strong>de</strong> <strong>la</strong>pa<br />
pa se thsbia erque es un cultivo con gran <strong>volumen</strong> <strong>de</strong> cosechas,asi" como un alto valor unita<br />
rio en el mercado;en el caso <strong>de</strong>l maíz,se originó <strong>de</strong>bido a fa gran amolítud <strong>de</strong> área que se<br />
<strong>de</strong>dica a este cultivo. Las utilida<strong>de</strong>s generadas por cultivos y por subsectores se observan en<br />
los Cuadros N 0 18, 19, 20, 21, 22, 23,y 24 <strong>de</strong>l Anexo VI.<br />
5. Factores Institucional es<br />
a. Ministerio <strong>de</strong> Agricultura<br />
El Ministerio <strong>de</strong> Agricultura presta asistencia técnica en <strong>la</strong> zona <strong>de</strong><br />
estudio a través <strong>de</strong> <strong>la</strong>s Oficinas Agrarias <strong>de</strong> Cajamarca, Chota y Chepén, pertenecientes a<br />
<strong>la</strong> Zona Agraria II, que actualmente tiene como se<strong>de</strong> <strong>la</strong> ciudad <strong>de</strong> Cajamarca. El ámbito<br />
geográfico <strong>de</strong> dichas Oficinas Agrarias compren<strong>de</strong> <strong>la</strong>s provincias <strong>de</strong> Cajamarca, Cutervo ,<br />
Chota, Santa Cruz, Hualgayoc, San Miguel y Contumazá; su acción se ejerce a través <strong>de</strong><br />
sus respectivas agencias ysecfores agrarios, tal como se pue<strong>de</strong> observar en el Cuadro N 0<br />
21-DA.<br />
El personal que atien<strong>de</strong> <strong>la</strong> zona estudiada se encuentra <strong>de</strong>tal<strong>la</strong>do en<br />
el Cuadro N 0 22-DA, observándose que, no obstante el carácter gana<strong>de</strong>ro <strong>de</strong> <strong>la</strong> zona, sólo<br />
se dispone <strong>de</strong> un médico veterinario. En el Cuadro N 0 23-DA, se objetiviza el presu -<br />
puesto para el <strong>de</strong>sempeño <strong>de</strong> sus funciones durante el bienio 1973-74. No incluye el presupuesto<br />
<strong>de</strong> los sectores <strong>de</strong> San Juan y Magdalena que pertenecen a <strong>la</strong> Oficina Agraria <strong>de</strong><br />
Cajamarca, por no haberse podido <strong>de</strong>sconsolidar.<br />
Las principales acciones realizadas por <strong>la</strong>s Oficinas Agrarias <strong>de</strong> Ca<br />
¡amarca. Chota y Chepén son <strong>la</strong>s siguientes :<br />
División <strong>de</strong> Producción y Comercialización:en <strong>la</strong> actividad agropecuaria, <strong>de</strong>stacan <strong>la</strong>s<br />
acciones <strong>de</strong> asesoramiento en el establecimiento y consolidación técnico-económica<br />
<strong>de</strong> <strong>la</strong>s empresas campesinas, el control <strong>de</strong> <strong>la</strong>s p<strong>la</strong>gas y enfermeda<strong>de</strong>s, <strong>la</strong> producción <strong>de</strong><br />
semil<strong>la</strong>s, que actualmente resultan insuficientes para cubrir <strong>la</strong>s necesida<strong>de</strong>s en el ámbito<br />
<strong>de</strong> atención <strong>de</strong> cada Oficina (Asf, en el caso <strong>de</strong> <strong>la</strong> papa <strong>la</strong>s 120 Ha. <strong>de</strong> semille -<br />
ros existentes sólo proporcionarán semil<strong>la</strong>s para sembrar 1,000 Ha., con lo que se cu -<br />
brirá sólo el 11 .,7% <strong>de</strong>l área anual <strong>de</strong> este cultivo). En <strong>la</strong> actividad pecuaria, <strong>de</strong>stacan<br />
<strong>la</strong>s acciones <strong>de</strong> asesoramiento en <strong>la</strong> distribución <strong>de</strong> reproductores vacunos y ovi —<br />
nos, asi* como <strong>de</strong> sanidad animal, habiéndose aplicado 70,000 dosis <strong>de</strong> vacunas y dosi<br />
ficaciones y realizado más <strong>de</strong> 26,000 tratamientos antiparasitarios y pruebas diagnósti
CUADRO hP 17-DA<br />
UTILIDADES DE LA ACTIVIDAD AGROPECUARIA<br />
z<br />
o<br />
H<br />
n<br />
o<br />
(1974-1975)<br />
><br />
o<br />
Sectores<br />
Agríco<strong>la</strong><br />
" Miles <strong>de</strong> S/.<br />
Actividad<br />
Pecuaria<br />
% Miles <strong>de</strong> S/.<br />
%<br />
1<br />
Miles <strong>de</strong> S/.<br />
Tot al<br />
%<br />
"O<br />
ra<br />
n<br />
a<br />
><br />
JO<br />
1 (Norte)<br />
98,291<br />
' 57.2<br />
" 108,367<br />
52.0<br />
206,658<br />
54.3<br />
Cutervo<br />
Chota<br />
Santa Cruz<br />
Hualgayoc<br />
28,340<br />
33,423<br />
3 f 075<br />
33,<strong>45</strong>3<br />
16.5<br />
19.4<br />
1.8<br />
19.5<br />
44,621<br />
33,971<br />
6,183<br />
23,592<br />
21.4<br />
16.3<br />
3.0<br />
11.3<br />
72,961<br />
67,394<br />
9,258<br />
57,0<strong>45</strong><br />
19.2<br />
17.7<br />
2.4<br />
15.0<br />
II (Sur)<br />
73,660<br />
42.8<br />
100,078<br />
48.0<br />
173,738<br />
<strong>45</strong>.7<br />
Ca ¡amárco<br />
San Miguel<br />
Contumaza<br />
38,128<br />
24,560<br />
10,972<br />
22.1<br />
14.3<br />
6.4<br />
40,263<br />
40,848<br />
18,967<br />
19.3<br />
19.6<br />
9.1<br />
78,391<br />
65,408<br />
29,939<br />
20.6<br />
17.2<br />
7.9<br />
Total<br />
171,951<br />
100.0<br />
208,4<strong>45</strong><br />
100.0<br />
380,396<br />
100.0<br />
Valor<br />
Porcentual<br />
<strong>45</strong>.2 % •<br />
54.8%<br />
J00.0%<br />
Fuente : ONERN.<br />
I"<br />
OH<br />
OQ<br />
OÍ
13<br />
tu<br />
ero<br />
*><br />
i-»<br />
OÍ<br />
CUADRO N° 18 'DA<br />
UTILIDADES ESTIMADAS DE LA ACTIVIDAD. PECUARIA,<br />
19^5<br />
I<br />
Sectores<br />
(Norte)<br />
Cutervo<br />
Chota<br />
Santa Cruz<br />
llualsayoc<br />
II (Sur)<br />
Cajamarca<br />
San Miguel 1<br />
Contumaza<br />
Total<br />
Valor Porcentual<br />
Fuente<br />
ONERN<br />
Vacunos<br />
Miles <strong>de</strong> Si<br />
49 650<br />
23 219<br />
14 876<br />
2 893<br />
8 CG2<br />
65 668<br />
25 826<br />
29 518<br />
10 324<br />
115,318<br />
0<br />
55 3%<br />
lo<br />
43.0<br />
20 1<br />
12 9<br />
2,5<br />
7 5<br />
57.0<br />
22 4<br />
25 6<br />
9 0<br />
100,0<br />
OvmoN<br />
Porcinos<br />
...<br />
4 2o¡ 0<br />
12 4%<br />
Miles <strong>de</strong> SI<br />
2 841<br />
919<br />
1 21"<br />
9"<br />
548<br />
5 8 r '0<br />
2 366<br />
1 373<br />
2 131<br />
8,-711<br />
lo<br />
32 5<br />
10 5<br />
14 6<br />
1 1<br />
6 i<br />
67 5<br />
27 2<br />
is 8<br />
24 5<br />
100 0<br />
Miles <strong>de</strong> S/<br />
17,279<br />
5 S 742<br />
5,602<br />
705<br />
5 230<br />
8 r 614<br />
3 749<br />
3 376<br />
1,489<br />
25 893<br />
fo<br />
66 7<br />
22,2<br />
21 6<br />
2 7<br />
20 2<br />
33 3<br />
14 4<br />
13 1<br />
5 8<br />
100 0<br />
Aves<br />
Miles <strong>de</strong> S,<br />
22 486<br />
8 420<br />
7 067<br />
1 547<br />
5 <strong>45</strong>2<br />
13 111<br />
5 736<br />
4 155<br />
3 220<br />
35,597<br />
17 Ify<br />
"/o<br />
63,2<br />
23 7<br />
19 9<br />
4 3<br />
15 3 .<br />
36 8<br />
16 1<br />
11 7<br />
9 0<br />
100 0<br />
Cuyes<br />
Miles <strong>de</strong> i>l<br />
16,111<br />
6,321<br />
5 149<br />
941<br />
3,700<br />
6 815<br />
2 586<br />
2,426<br />
1 8<strong>03</strong><br />
22,926<br />
11 0
! Sectores<br />
CUADRO N 3 1 9TDA<br />
U TILIDADES ESTIMADAS DE LA ACTIVIDAD AGRÍCOLA<br />
(1974-1975)<br />
Area An ual <strong>de</strong><br />
Ingreso Bruto<br />
Costos Dilectos<br />
Produc ción<br />
Utilida<strong>de</strong> s<br />
O<br />
i—i<br />
><br />
O<br />
•z<br />
o<br />
en<br />
H<br />
O<br />
O<br />
><br />
o<br />
ja<br />
O<br />
13<br />
W<br />
O<br />
><br />
53<br />
Ha „<br />
%<br />
Miles <strong>de</strong> S/,<br />
%<br />
Miles <strong>de</strong> S/.<br />
%<br />
Miles <strong>de</strong> S/.<br />
%<br />
1 (Norte;<br />
51,599<br />
61,0<br />
301,588<br />
59,4<br />
2<strong>03</strong>,297<br />
60.6<br />
98,291<br />
! 57,2 [<br />
Cutervo<br />
Chota<br />
Santa Cruz<br />
HuaSgayoc<br />
16,08!<br />
16,423<br />
1,993<br />
17,¡02<br />
19.0<br />
19,4<br />
2.4<br />
20.2<br />
80.172<br />
102,094<br />
10,651<br />
108,671<br />
15,8<br />
20.1<br />
2.1<br />
21,4<br />
51,832<br />
68,671<br />
7,576<br />
75,218<br />
15,4<br />
20,5<br />
2,3<br />
22,4<br />
28,340<br />
33,423<br />
3,075<br />
33,<strong>45</strong>3<br />
16.5<br />
19.4 !<br />
1.8 1<br />
19,5<br />
II (Sur)<br />
32,918<br />
3?.0<br />
206,088<br />
40,6<br />
132,428<br />
39.4*<br />
73,660<br />
42,8<br />
Cajamoica<br />
San Miguel<br />
Contumazá<br />
17,616<br />
'1,173<br />
4,129<br />
20,8<br />
13,3<br />
4,9<br />
108,678<br />
69,653<br />
27,757<br />
21.4<br />
13,7<br />
5.5<br />
70,550<br />
<strong>45</strong>,093<br />
16,785<br />
21.0<br />
13.4<br />
5.0<br />
38,128<br />
24,560<br />
10, 972<br />
22,1<br />
14.3<br />
6.4<br />
Tota 1<br />
84,517<br />
100.0<br />
507,676<br />
100,0<br />
335 ; 725<br />
100,0<br />
171,951<br />
100,0<br />
Fuente ONF.'JK 1''<br />
ti<br />
Ctq<br />
i-"
Pag- 418<br />
ZONA NORTE DE CAJAMARCA<br />
CUADRO N° 20-DA<br />
UTILIDADES^ ESTIMADAS DE LA ACTiypAD AGRÍCOLA<br />
Cultivos<br />
l p Industriales<br />
Cana <strong>de</strong> azúcar<br />
Café<br />
Otros cultivos ind.<br />
II. Alimenticios<br />
Papa<br />
Mafz<br />
Cebada<br />
Arveja, grano seco<br />
Trigo<br />
Arroz<br />
Arveja, grano ver<strong>de</strong><br />
Olluco<br />
Oca<br />
Camote<br />
Yuca<br />
Lenteja<br />
Hortalizas varias<br />
Otros tubérculos<br />
Frijol<br />
Plátanos<br />
Haba<br />
• Otros frutales<br />
Otros cereales<br />
Cítricos<br />
JJÍ, Pactos v forrajes<br />
Trébol * Rye grass<br />
Otros forrajes<br />
Alfalfa<br />
Mafz cha<strong>la</strong><br />
Total<br />
Area Anual <strong>de</strong><br />
Producción<br />
Ha.<br />
1.690<br />
1,397*<br />
251<br />
42<br />
77.399<br />
8,575<br />
33,399<br />
12,662<br />
5.776<br />
4,7<strong>03</strong><br />
743<br />
1,7<strong>45</strong><br />
2,469<br />
1,995<br />
824<br />
783<br />
779<br />
368<br />
714<br />
882<br />
255<br />
402<br />
147<br />
118<br />
60<br />
5.428<br />
1,196<br />
3,483<br />
566<br />
183<br />
84,517<br />
"Jo<br />
2.0<br />
1.7<br />
0.3<br />
0.0<br />
91.6<br />
10.1<br />
39.5<br />
15.0<br />
6.8<br />
5.6<br />
0.9<br />
2.1<br />
2.9<br />
2.4<br />
1.0<br />
0.9<br />
0.9<br />
0.4<br />
0.9<br />
1.0<br />
0,3<br />
0,5<br />
0.2<br />
0,1<br />
6,4<br />
1.4<br />
4.1<br />
0.7<br />
0.2<br />
100.0<br />
(1974-1975)<br />
i<br />
Ingresos<br />
Miles <strong>de</strong><br />
SI.<br />
19.334<br />
17,<strong>45</strong>0<br />
1,506<br />
378<br />
471.936<br />
156,346<br />
133,596<br />
50,648<br />
34,656<br />
18,812<br />
17,832<br />
13,613<br />
12,3<strong>45</strong><br />
7,980<br />
4,328<br />
4,112<br />
3,895<br />
2,944<br />
2,856<br />
2,646<br />
2,040<br />
1,811<br />
735<br />
381<br />
360<br />
16.406<br />
5.741<br />
5,229<br />
4,095<br />
1.341<br />
507,676<br />
t<br />
°1°<br />
3.8<br />
3.4<br />
0.3<br />
0.1<br />
93.0<br />
30.8<br />
26.3<br />
10.0<br />
6.8<br />
3.7<br />
3.5<br />
2.7<br />
2.4<br />
1.6<br />
0.9<br />
0.8<br />
0.8<br />
0.6<br />
0.6<br />
0.5<br />
0.4<br />
0.3<br />
0,1<br />
0,1<br />
0.1<br />
3.2<br />
1.1<br />
1.0<br />
0.8<br />
0.3<br />
100.0<br />
!<br />
Egresos<br />
Miles <strong>de</strong><br />
SI.<br />
7.053<br />
6,649<br />
332<br />
72<br />
324.<strong>03</strong>2<br />
115,886<br />
95, 518<br />
33,289<br />
20,731<br />
13,969<br />
7,323<br />
7,571<br />
8,013<br />
6,1<strong>45</strong><br />
2,627<br />
2,752<br />
2,143<br />
2.267<br />
2,123<br />
1,362<br />
423<br />
1,283<br />
195<br />
314<br />
98<br />
4.640<br />
1,524<br />
1,153<br />
1,264<br />
699<br />
f335,725<br />
lo<br />
2.1<br />
2.0<br />
0,1<br />
0.0<br />
96.5<br />
34.5<br />
28.5<br />
9.9<br />
6.2<br />
4.2<br />
2.2<br />
2.3<br />
2.4<br />
1.8<br />
0.8<br />
0.8<br />
0.6<br />
0.7<br />
0.6<br />
0.4<br />
0,1<br />
0.4<br />
0.0<br />
0,1<br />
0.0<br />
1.4<br />
0.4<br />
0,4<br />
0.4<br />
0.2<br />
100,0<br />
Utilida<strong>de</strong>s<br />
Miles <strong>de</strong><br />
Sí<br />
12.281<br />
10,801<br />
1,174<br />
306<br />
147.904<br />
40,460<br />
38,078<br />
17,359<br />
13,925<br />
4,843<br />
10,509<br />
6,042<br />
4,332<br />
1,835<br />
1,701<br />
1,360<br />
1,752<br />
677<br />
733<br />
1,284<br />
1,617<br />
528<br />
540<br />
67<br />
262<br />
11,766<br />
4,217<br />
4,076<br />
2,831<br />
642<br />
171,951<br />
"lo<br />
7.1<br />
6.3<br />
0.7<br />
0.1<br />
86.0<br />
23.5<br />
22,2<br />
10.1<br />
8.1<br />
2.8<br />
6.1<br />
3.5<br />
2.5<br />
1,1<br />
1.0<br />
0.8<br />
1.0<br />
0.4<br />
0.4<br />
0.8<br />
0.9<br />
0.3<br />
0.3<br />
0.0<br />
0,2<br />
6.9<br />
2.5<br />
2,4<br />
1.6<br />
0.4<br />
100.0<br />
(*) El área <strong>de</strong> cosecha anual <strong>de</strong> <strong>la</strong> caña <strong>de</strong> azúcar equivale al 5(Pjo<br />
Fuente: ONERN - 1975.
DIAGNOSTICO AGROPECUARIO Kg. 419<br />
CUADRO N 0 21-DA<br />
AREA DE ACCIÓN DEL MINISTERIO DE AGRICULTURA - ZONA AGRARIA II<br />
1975 '<br />
Sectores <strong>de</strong> Zona Oficinas Agencias<br />
Estudio Agraria Agrarias Agrarias<br />
Sectores Agrarios<br />
1 (Norte)<br />
Cutervo<br />
Chota<br />
Santa Cruz<br />
Hualgayoc<br />
II (Sur)<br />
Cajamarca<br />
San Miguel<br />
Contumazá<br />
Z.A. II<br />
Caiamarca<br />
Fuente: Ministerio <strong>de</strong>^Agricultura, -<br />
Agrónomos<br />
Abogados<br />
Médico Veterinario<br />
Asistenta Social<br />
Topógrafos<br />
Dibujantes<br />
Tec. Agrop.<br />
Asistente Adm,<br />
Obreros<br />
Chota<br />
Cajamarca<br />
Chepén<br />
Cutervo<br />
Chota<br />
Bambamarca<br />
Santa Cruz<br />
Cajamarca<br />
Chilete<br />
CUADRO N 0 22-DA<br />
Cutervo, San Andrés<br />
Chota,Cochabamba, Lajas<br />
Cha<strong>la</strong>, Bambamarca, L<strong>la</strong>ucán<br />
Santa Cruz<br />
San Juan, Magdalena<br />
Chilete, San Miguel<br />
San Pablo, Contumazá<br />
PERSONAL DEL MINISTERIO DE AGRICULTURA EN LA ZONA DE ESTUDIO<br />
, 1975 ,<br />
• Oficina Agraria Chota<br />
Agencia<br />
Agencia<br />
Oficina Agencia Agencia Agencia Agencia<br />
Personal Agraria<br />
Agraria<br />
Agraria Agraria Agraria Agraria Agraria<br />
Cajamarcc<br />
Chilete<br />
Chota Chota Cutervo Bambamar .S. Cruz<br />
1<br />
2<br />
1<br />
Fuente; Ministerio <strong>de</strong> Agricultura.<br />
Código<br />
01.00<br />
02.00<br />
<strong>03</strong>.00<br />
04.00<br />
9<br />
2<br />
1<br />
1<br />
2<br />
1<br />
50<br />
17<br />
21<br />
1<br />
1<br />
8<br />
1<br />
2<br />
1<br />
9<br />
1<br />
3<br />
CUADRO N 0 23-DA<br />
PRESUPUESTO DEL MINISTERIO DE AGRICULTURA EN LA ZONA DE ESTUDIC<br />
Partidas<br />
Remuneraciones<br />
Bienes<br />
Servicios<br />
Transf. corrientes<br />
Total<br />
(Soles Oro <strong>de</strong> 1973-74)<br />
1<br />
7<br />
1<br />
2<br />
5<br />
1<br />
12<br />
1<br />
2<br />
Monto<br />
Oficina Aararia Chota Aaencia Aararia Chilete<br />
1'<strong>45</strong>0,840.00<br />
1'570,100.00<br />
1 '656,000.00<br />
174,000.00<br />
4 , 850,940.00<br />
Fuente : Memoria 1974 " Oficiru t ^reiría <strong>de</strong> dota, agencia Agraria Chilete.<br />
186,504.80<br />
246,200.00<br />
159,800.00<br />
26,963.20<br />
619,468.00
Pdg. 420<br />
ZONA<br />
NORTE DE CAJAMARCA<br />
cas, etc. Las acciones <strong>de</strong> comercialización están dirigidas al control e inspección <strong>de</strong><br />
camales y <strong>de</strong> establecimientos comerciales que se <strong>de</strong>dican a <strong>la</strong> compra-venta <strong>de</strong> insu -<br />
mos agropecuarios, así como al control <strong>de</strong> salida <strong>de</strong> <strong>la</strong> producción agropecuaria,.<br />
División <strong>de</strong> Recursos Naturales: <strong>de</strong>stacan <strong>la</strong>s acciones <strong>de</strong> producción y distribución <strong>de</strong><br />
1 '580,000 p<strong>la</strong>ntones forestales, que fueron insta<strong>la</strong>dos en 724 Ha. en los diferentes sub<br />
sectores <strong>de</strong>l ámbito estudiado.<br />
División <strong>de</strong> Reforma Agraria y Asentamiento Rural: <strong>la</strong>s acciones principales se dirigieron<br />
a <strong>la</strong> afectación, valorización y adjudicación <strong>de</strong> tierras, en cumplimiento <strong>de</strong>l De -<br />
creto Ley N 0 17716.<br />
División <strong>de</strong> Investigaciones: conducción <strong>de</strong> los campos experimentales, con I meas <strong>de</strong> in<br />
vestigación <strong>de</strong> productividad y mejoramiento en maíz, trigo y papa que, en conjunto ,<br />
alcanzaron a 22 experimentos por campaña<br />
Los servicios que presta el Ministerio <strong>de</strong> Agricultura son importan-<br />
OÍ: pero,, <strong>la</strong> amplitud <strong>de</strong> <strong>la</strong> zona <strong>de</strong> atención, <strong>la</strong> escasa capacidad <strong>de</strong> operación y <strong>la</strong> falta<br />
<strong>de</strong> personal técnico hacen que el área <strong>de</strong> atención cubierta sea muy reducida y <strong>la</strong>s innováronos<br />
<strong>de</strong> carácter técnico lleguen sólo a un limitado número <strong>de</strong> agricultores y/o gana<strong>de</strong>ros<br />
<strong>de</strong> cada uno <strong>de</strong> los sectores que integran <strong>la</strong> zona <strong>de</strong> estudiOo Estas <strong>de</strong>ficiencias, que pue -<br />
<strong>de</strong>.i ser atribuidas a <strong>la</strong> falta <strong>de</strong> personal técnico y <strong>de</strong> a<strong>de</strong>cuados programas <strong>de</strong> capacitación,<br />
osf como al reducido presupuesto operativo y a <strong>la</strong> escasez <strong>de</strong> equipo <strong>de</strong> trabajo y movilidad,<br />
no permiten mejorar y/o satisfacer <strong>la</strong>s necesida<strong>de</strong>s <strong>de</strong> atención técnica que requiere el sector<br />
agrario *<br />
bo Sistema Nacional <strong>de</strong> Apoyo a <strong>la</strong> Movilización Social (SINAMOS)<br />
El Sistema Nacional <strong>de</strong> Apoyo a <strong>la</strong> Movilización Social tiene por<br />
f'nclidad lograr <strong>la</strong> activa participación <strong>de</strong> <strong>la</strong> pob<strong>la</strong>ción en <strong>la</strong>s tareas que <strong>de</strong>man<strong>de</strong> el <strong>de</strong>sa -<br />
froüo económico y sociaL En <strong>la</strong> zona <strong>de</strong> esrudio, opera a través <strong>de</strong> <strong>la</strong>s Oficinas Zonales<br />
ce Apoyo a <strong>la</strong> Movilización Social {OZAt'S} <strong>de</strong> Chole y <strong>de</strong> Cajamarca, ambas <strong>de</strong>pendientes<br />
'Je !- Oficina Regional <strong>de</strong> Apoyo a <strong>la</strong> /v'ovilización Social II (ORAMS) <strong>de</strong> Chic<strong>la</strong>yo y actúa<br />
c : 'cc/cmente en e! sector a través <strong>de</strong> Sas Ateas <strong>de</strong> Organización Rural y <strong>de</strong> Organización <strong>de</strong><br />
I P'O'-a <strong>de</strong> Interés Social (OE1S)<br />
El A»~ea <strong>de</strong> OrcanÍ7ccione r , RurcSes tiene por objetivo lograr el esta<br />
.loe'- •c-'-í-o <strong>de</strong> organ¡7aciorí>3 econor.vcc; r-o -jC-nafivas <strong>de</strong> lo poDÍación cc v !pe.-ír¡a / ejei<br />
c- el ccntio! social <strong>de</strong>l seco, rural, permiiie>do que cciítibcyan con si, pa ic¡poción e-i<br />
í<br />
r '" iv.c'^n <strong>de</strong> asociación»-*, Üg.» y Vc/e^ucij ~, c_, cíias. Jo cofifo .niü^d c'i 'J>iC-t,^ Lty<br />
1 " *QJ, <strong>de</strong>l 9 <strong>de</strong> Moyo <strong>de</strong> 1972, Lo re<strong>la</strong>c'c <strong>de</strong> lo*, diferentes organizucioneb ae base se<br />
o-.cue,-' , iQ <strong>de</strong>tal<strong>la</strong>da en los Cuadros N 0 24, 25 / 2Ó-DA.<br />
Entre los grupos organizados, <strong>de</strong>staca por su importancia <strong>la</strong> Fe<strong>de</strong>ración<br />
Agraria <strong>de</strong> Campesinos <strong>de</strong>l Departamento <strong>de</strong> Cajamarca; esta orcr ,i~r' " ' cS á
DIAGNOSTICO A GROPKC U A RIO Pág. 421<br />
lri:£-;,rac!aDer<strong>la</strong>s !:^ci3cr5rarías,queagruDcin,a nivel Provincia, a | as comunida<strong>de</strong>s <strong>de</strong> su área<br />
<strong>de</strong> influencia, tal como se observa en el Cuadro N 0 26-DA. En cambio, <strong>la</strong>s asociaciones<br />
tienen menor importancia, ya que <strong>la</strong>s acciones que realizan en favor <strong>de</strong> sus asociados son<br />
limitadas.<br />
CUADRO N 0 24-DA<br />
ASOCIACIONES AGRARIAS DE CONDUCTORES DIRECTOS<br />
_ ^ _ 1975<br />
Fecha <strong>de</strong> Número <strong>de</strong><br />
Nombre<br />
Provincia Distrito<br />
Registro Socios<br />
OZAMS<br />
San Juan <strong>de</strong> Lirio <strong>de</strong>l<br />
Distrito <strong>de</strong> Hualgayoc<br />
14.06.74<br />
154<br />
Hualgayoc<br />
Hualgayoc<br />
Chota<br />
Anaximandro Vega<br />
Mattio<strong>la</strong><br />
06.<strong>03</strong>.75<br />
118<br />
Chota<br />
Lajas<br />
Chota<br />
Eleodoro Benel<br />
—<br />
Chota<br />
Chota<br />
Chota<br />
Fuente . SIN AMOS.<br />
CUADRO N 0 25-DA<br />
GRUPOS ORGANIZADOS<br />
1975<br />
Nombre <strong>de</strong> <strong>la</strong>s Organizaciones<br />
Provincia<br />
Distrito<br />
Número <strong>de</strong><br />
Socios<br />
Observaciones<br />
i<br />
CA <strong>de</strong> los Arrendatarios <strong>de</strong> los<br />
fundos Cadmalca-iraca<br />
CAS El Salvador<br />
GC Cha<strong>la</strong>pampa<br />
GC Huangamarca<br />
GC Huilcate<br />
GC Cha<strong>la</strong>-A<strong>la</strong>n<br />
GC Tuco-Santa Rosa<br />
GC Chiribamba<br />
Chota<br />
Hualgayoc<br />
Hualgayoc<br />
Hualgayoc<br />
Hualgayoc<br />
Hualgayoc<br />
Hualgayoc<br />
Chota<br />
Lajas<br />
Bambamarca<br />
Bambamarca<br />
Bambamarca<br />
Huilcate<br />
Bambamarca<br />
Bambamarca<br />
Lajas<br />
150<br />
300<br />
522<br />
440<br />
385<br />
885<br />
540<br />
1<strong>45</strong><br />
__<br />
En trámite<br />
—<br />
—<br />
—<br />
—<br />
—'<br />
Fuente : SINAMOS<br />
CA - Cooperativa Agraria<br />
CAS - Cooperativa Agraria <strong>de</strong> Servicios<br />
GC - Grupos Campesinos
ZONA NORTE DE CAJAMARCA<br />
CUADRO N 0 26-DA<br />
LIGAS AGRARIAS<br />
r<br />
!<br />
I<br />
S<br />
¡<br />
í<br />
Ligas<br />
Agrarias<br />
Provincia <strong>de</strong><br />
Cijamarcrs<br />
Provincia <strong>de</strong><br />
Ccntumazó<br />
Provincia <strong>de</strong><br />
Cutervo<br />
Provincia<br />
<strong>de</strong> Chota<br />
Libertador<br />
San Martin<br />
<strong>de</strong> <strong>la</strong> Prov.<br />
<strong>de</strong> Hual -<br />
gayoc<br />
Organizaciones <strong>de</strong> Base <strong>de</strong> <strong>la</strong> Li ga<br />
Número Fecha <strong>de</strong><br />
Comunida<strong>de</strong>s Campesinas • Distrito j <strong>de</strong> - Reconocimiento<br />
Personas<br />
Catil<strong>la</strong>mbi<br />
San Juan <strong>de</strong> Yanac<br />
Catoche<br />
Guatum Vista Alegre<br />
Cumbicos<br />
Guivinchán<br />
San Luis<br />
San Bernardino y San<br />
Antonio <strong>de</strong> Cachis<br />
Chaman! Sapuy<br />
Cuzquidén y San Francisco<br />
<strong>de</strong>l Monte<br />
Catul<strong>la</strong> y sus Anexos<br />
San Juan <strong>de</strong> Cachilgón y<br />
sus Anexos<br />
Unanca<br />
Toled<br />
Huertas<br />
San Juan <strong>de</strong> L<strong>la</strong>llán<br />
Santa Catalina<br />
Catán<br />
Trinidad<br />
Chipuluc<br />
Pauca<br />
Pandalle<br />
Muquesa<strong>de</strong>n <strong>de</strong> Liclipampa<br />
Chu<strong>la</strong>cmache<br />
Ligón Gran<strong>de</strong><br />
Ligón <strong>de</strong> Santo So<strong>la</strong>no<br />
<strong>de</strong> Coñor<br />
Chugur<br />
Pinqullo<br />
El Tingo<br />
La Tranca <strong>de</strong> Pújupe<br />
Moran Pata<br />
Asunción<br />
San Juan<br />
Magdalena<br />
Asunción<br />
Magdalena<br />
San Juan<br />
San Pablo<br />
San Pablo<br />
Asunción<br />
San Pablo<br />
Asunción<br />
Asunción<br />
San Pablo<br />
Contumazá<br />
Chilete<br />
Chílete<br />
Trinidad<br />
Trinidad<br />
Trinidad<br />
Cutervo<br />
Cutervo<br />
Socota<br />
Cutervo<br />
Chota<br />
Chota<br />
Chota<br />
Chugur<br />
Hualgayoc<br />
Hualgayoc<br />
Hualgayoc<br />
Hualgayoc<br />
151<br />
325<br />
137<br />
125<br />
250<br />
198<br />
300<br />
240<br />
230<br />
__<br />
520<br />
195<br />
343<br />
100<br />
200<br />
510<br />
540<br />
31<br />
40<br />
46<br />
32<br />
38<br />
110<br />
80<br />
280<br />
144<br />
136<br />
250<br />
528<br />
23-04-46<br />
30-10-43<br />
24-02-60<br />
25-04-66<br />
02-05-62<br />
04-08-64<br />
05-04-65<br />
29-09-55<br />
01-04-64<br />
28-05-48<br />
28-04-61<br />
23-11 -49<br />
22-<strong>03</strong>-38<br />
30-10-43<br />
16-06-<strong>45</strong><br />
04-10-46<br />
09-01-43<br />
22-11-46<br />
09-01-43<br />
24-02-43<br />
01-06-44<br />
14-12-57<br />
09-07-59<br />
—,<br />
—<br />
—<br />
11-10-65<br />
23-09-68<br />
27-10-56<br />
29-12-67<br />
—<br />
Número<br />
iResoJ-Uciora<br />
Suprema<br />
15<br />
141<br />
063<br />
297<br />
150<br />
16<br />
69<br />
050<br />
__<br />
--<br />
__<br />
—<br />
—<br />
__<br />
—<br />
—<br />
—,<br />
64<br />
29<br />
—<br />
—<br />
—<br />
__<br />
><br />
0282-TC<br />
61<br />
. 361<br />
—<br />
(continúa).<br />
i
DIAGNOSTICO AGROPECUARIO<br />
,, í > ág.423<br />
(continuación)..<br />
Ligas<br />
Agrarias<br />
Organizaciones <strong>de</strong> Base <strong>de</strong> <strong>la</strong> -iga<br />
Número Fecha <strong>de</strong><br />
Comunida<strong>de</strong>s Campesinas Distrito <strong>de</strong> Reconocí -<br />
Personas miento<br />
Número<br />
Resolución<br />
Suprema<br />
Provincia <strong>de</strong><br />
San<br />
Miguel<br />
San Antonio <strong>de</strong> Oyos<br />
Suyto-Orco<br />
Calquis<br />
Pampa <strong>de</strong> Cuyoc La Colpa<br />
L<strong>la</strong>pa<br />
Calquis<br />
Calquis<br />
L<strong>la</strong>pa<br />
96<br />
56<br />
350<br />
301<br />
08-05-67<br />
08-<strong>03</strong>-62<br />
30-10-46<br />
08-05-67<br />
141<br />
043<br />
140<br />
Provincia <strong>de</strong><br />
Santa Cruz<br />
Pachudén-Yanayacu<br />
Yauyucán<br />
Yauyucán<br />
Yauyucán<br />
14-05-46<br />
Fuente : SINAMOS, 1975.<br />
c. Créditos<br />
La participación <strong>de</strong>l crédito en el proceso <strong>de</strong> producción es muy im<br />
portante, por lo que se ha estimado conveniente incluir su estudio en este diagnóstico, con<br />
el fin <strong>de</strong> conocer <strong>la</strong>s modalida<strong>de</strong>s <strong>de</strong> su uso, <strong>de</strong>scribiendo <strong>la</strong>s principales fuentes <strong>de</strong> crédito,<br />
c<strong>la</strong>ses, montos y otras caracteristicas referidas al sector agropecuario.<br />
Las necesida<strong>de</strong>s financieras <strong>de</strong> <strong>la</strong> zona son cubiertas principalmente<br />
por el Banco Agrario, quien proporciona préstamos recurriendo a sus recursos económicos o<br />
a los fondos que opera en fi<strong>de</strong>icomiso <strong>de</strong> acuerdo a convenios internacionales y que se ca -<br />
nalizan a través <strong>de</strong> esa entidad. También tienen importancia los hábilitadores partícu<strong>la</strong> -<br />
res; pero no se ha podido cuantificar los montos ni <strong>la</strong>s condiciones bajo <strong>la</strong>s cuales otorgan<br />
préstamos a los agricultores y gana<strong>de</strong>ros <strong>de</strong> <strong>la</strong> zona. Por último, <strong>de</strong>be <strong>de</strong>stacarse el aporte<br />
económico <strong>de</strong> los agricultores; en este caso, los recursos no se generan en <strong>la</strong> actividad a -<br />
graria regional, sino que provienen <strong>de</strong>l trabajo estacional que tiene lugar en <strong>la</strong> minerfa o<br />
en <strong>la</strong>s unida<strong>de</strong>s agnco<strong>la</strong>s <strong>de</strong> <strong>la</strong> Costa.<br />
El monto <strong>de</strong> los créditos otorgados durante el año 1974 fue <strong>de</strong><br />
S/. 18'441,260.00, tal como se <strong>de</strong>tal<strong>la</strong> en el Cuadro N 0 27-DA, <strong>de</strong>stacando el Banco Agra<br />
rio como el principal agente financiero, proporcionando el 61.0% <strong>de</strong>l total aviado con sus<br />
propios fondos; mientras que con recursos <strong>de</strong>l Fondo en Fi<strong>de</strong>icomiso se cubrió el 39.0% restante.<br />
Haciendo un análisis <strong>de</strong> <strong>la</strong> distribución <strong>de</strong>l crédito por sectores, se aprecia que el<br />
Sector II (Sur) captó S/. 12"127, 000.00, suma que representó el 65.8% <strong>de</strong>l total y que el<br />
Sector II (Norte) captó <strong>la</strong> diferencia; esta ten<strong>de</strong>ncia pue<strong>de</strong> atribuirse a que <strong>la</strong> me¡or accesi<br />
bilidad e implementación <strong>de</strong>l Banco Agrario en el Sector II (Sur) le permite tener una mejor<br />
flui<strong>de</strong>z <strong>de</strong> recursos.<br />
(1). Banco Agrario<br />
El Banco Agrario, en base a <strong>la</strong> Ley Orgánica N 0 21227 que <strong>la</strong> norma, tiene como ob_
Pág. 424<br />
ZONA NORTE DE CAJAMARCA<br />
¡etivo a<strong>de</strong>cuar sus funciones a los requerimientos <strong>de</strong>l <strong>de</strong>sarrollo <strong>de</strong> <strong>la</strong> actividad agraria<br />
<strong>de</strong>l pafs. Esta institución opera en <strong>la</strong> zona a través <strong>de</strong> <strong>la</strong> Agencia Chota, <strong>de</strong>pendiente<br />
<strong>de</strong> <strong>la</strong> Sucursal <strong>de</strong> Cajamarca, y <strong>de</strong> <strong>la</strong> Inspección Chilete, <strong>de</strong>pendiente <strong>de</strong> <strong>la</strong> Sucursal<br />
<strong>de</strong> Trujillo. Otorga a los agricultores y gana<strong>de</strong>ros <strong>la</strong>s siguientes c<strong>la</strong>ses <strong>de</strong> préstamos,<br />
cuyas características se aprecian a continuación.<br />
(a)»<br />
Préstamos <strong>de</strong> Sostenimiento<br />
Se otorgan con el objeto <strong>de</strong> constituir el capital <strong>de</strong> trabajo o <strong>de</strong> explotación que<br />
se requiere para obtener producciones agríco<strong>la</strong>s, pecuarias o <strong>de</strong> carácter fores —<br />
tal; así como para realizar procesos <strong>de</strong> transformación primaria o <strong>de</strong> conserva<br />
ción <strong>de</strong> productos agropecuarios, cuyas producciones finales son vendibles en<br />
penados cortos, no mayores <strong>de</strong> un año. El p<strong>la</strong>zo no podrá exce<strong>de</strong>r <strong>de</strong> un año ,<br />
salvo que se trate <strong>de</strong> cultivos cuyo ciclo <strong>de</strong> <strong>de</strong>sarrollo requiere <strong>de</strong> un período ma<br />
yor pero, en ningún caso, podrá superar los dos años»<br />
(b)c<br />
Préstamos <strong>de</strong> Comercialización<br />
Son aquellos que se otorgan con <strong>la</strong> garantía <strong>de</strong>l producto <strong>de</strong>positado, con el objeto<br />
<strong>de</strong> evitar que el producto sufra <strong>la</strong>s consecuencias <strong>de</strong> <strong>la</strong> <strong>de</strong>presión estacional<br />
<strong>de</strong> precios, pudiendo usarse también para <strong>la</strong> adquisición <strong>de</strong> insumes <strong>de</strong> uso agropecuario,<br />
con <strong>la</strong> garantía <strong>de</strong> los bienes adquiridos. El p<strong>la</strong>zo <strong>de</strong> reembolso pue<strong>de</strong><br />
ser <strong>de</strong> un año.<br />
(c) u<br />
Préstamos <strong>de</strong> Capitalización o <strong>de</strong> Promoción<br />
Son aquellos <strong>de</strong>stinados a financiar, total o parcialmente, <strong>la</strong> adquisición, cons -<br />
trucción o insta<strong>la</strong>ción <strong>de</strong> bienes <strong>de</strong> capital en <strong>la</strong> empresa agropecuaria y consti -<br />
tuidos, en general, por todas <strong>la</strong>s inversiones que, por su naturaleza, sólo pue<strong>de</strong>n<br />
ser recuperables a mediano o <strong>la</strong>rgo p<strong>la</strong>zo.<br />
En este régimen <strong>de</strong> préstamos se consi<strong>de</strong>ra los <strong>de</strong>stinados a insta<strong>la</strong>r y mantener has<br />
ta el estado <strong>de</strong> producción <strong>la</strong>s p<strong>la</strong>ntaciones agríco<strong>la</strong>s y forestales, <strong>la</strong> adquisición<br />
<strong>de</strong> ganado <strong>de</strong> cría, <strong>de</strong> maquinaria agríco<strong>la</strong>, <strong>de</strong> equipo <strong>de</strong> transporte y <strong>de</strong> bombeo;<br />
asi* como realizar y refaccionar obras <strong>de</strong> irrigación, <strong>de</strong> drenaje, <strong>de</strong> nive<strong>la</strong>ción ,<br />
<strong>de</strong> <strong>de</strong>fensa o <strong>de</strong> mejoramiento <strong>de</strong> tierra y también construir y reparar cercos, caminos<br />
y viviendas. El p<strong>la</strong>zo <strong>de</strong> reembolso pue<strong>de</strong> ser <strong>de</strong> hasta 20 años, salvo casos<br />
especiales calificados por el Directorio, en que podrá ampliarse hasta 25 años,,<br />
El monto <strong>de</strong> los préstamos que otorga el Banco Agrario se <strong>de</strong>termina en función <strong>de</strong> <strong>la</strong>s<br />
necesida<strong>de</strong>s financieras y <strong>de</strong>l valor <strong>de</strong> <strong>la</strong> producción a obtenerse en <strong>la</strong> explotación avia<br />
da; <strong>la</strong> inversión <strong>de</strong>be complementarse con el aporte económico <strong>de</strong>l solicitante, siempre<br />
que esté en condición <strong>de</strong> hacerlo, ya que estos avíos son integrales y <strong>de</strong>ben cubrir <strong>la</strong>s<br />
necesida<strong>de</strong>s <strong>de</strong> financiamiento <strong>de</strong> <strong>la</strong> empresa solicitante. Todo crédito <strong>de</strong>l Banco, con<br />
excepción <strong>de</strong> los préstamos <strong>de</strong> comercial izac'ón, será garantizado con <strong>la</strong> producción o<br />
con <strong>la</strong> renta que se obtenga como resultado directo o indirecto <strong>de</strong> <strong>la</strong> aplicación <strong>de</strong> los<br />
recursos prestados.
DIAGNOSTICO AGROPECUARIO **&•<br />
CUADRO N 0 27-DA<br />
PRINCIPALES FUENTES DE CREPITO DEL SECTOR AGROPECUARIO<br />
PRESTAMOS OTORGADOS DURANTE 1974-1975<br />
Fuentes <strong>de</strong><br />
Crédito<br />
Sector 1 (Norte)<br />
Soles<br />
%<br />
Sector II (Sur)<br />
Soles<br />
%<br />
Soles<br />
Total<br />
%<br />
Bco. Agrario<br />
4 '446,270,00<br />
70,4<br />
Ó'SOÓ,350,00<br />
56.1<br />
11*252,620.00<br />
6V.Q<br />
Fondo en<br />
Fi<strong>de</strong>icomiso<br />
1'867,990.00<br />
29.6<br />
5*320,650.00<br />
43 J?<br />
7"! 88,640,00<br />
39,0<br />
Total<br />
6'314,260.00<br />
100.0<br />
12'127,000 3 00<br />
100,0<br />
18 s 441,260,00<br />
100„0<br />
Fuente . Banco Agrario.<br />
Las tasas <strong>de</strong> interés cobradas por el Banco Agrario favorecen a <strong>la</strong> pequeña agricultura ,<br />
no obstante el riesgo y los mayores costos administrativos que representa aten<strong>de</strong>r a un<br />
gran número <strong>de</strong> prestatarios; también <strong>de</strong>be <strong>de</strong>stacarse que los créditos para productos a<br />
limenticios gozan <strong>de</strong> tasas <strong>de</strong> interés preferenciaL<br />
A los grupos asociativos se les otorga avfos sin limitación <strong>de</strong> monto, a <strong>la</strong> tasa ordina -<br />
rio <strong>de</strong>l 10%, excepto aquellos préstamos <strong>de</strong> sostenimiento para <strong>la</strong> producción <strong>de</strong> ali -<br />
mentos que <strong>de</strong>vengaran una tasa <strong>de</strong> interés especial <strong>de</strong>l 7%, <strong>de</strong>biendo ser subsidiado<br />
por el Supremo Gobierno el 3% restante, también se les da préstamos <strong>de</strong> comercialización<br />
para productos <strong>de</strong> exportación, con tasas <strong>de</strong> interés <strong>de</strong>l 12% (Ver Cuadro N 0 28 -<br />
DA).<br />
El Banco Agrario, durante el año 1974, otorgó créditos por un monto <strong>de</strong> S/<br />
11 «252,620.00, correspondiendo S/" 4'446,270.00 y S/,6 ! 806,35Q00 a los sectores I<br />
y II, respectivamente. Haciendo un análisis sobre el tipo <strong>de</strong> avíos otorgados, se tiene<br />
que <strong>la</strong> mayor proporción correspondió a los préstamos agríco<strong>la</strong>s (S/.7'151,620.00), <strong>de</strong>s<br />
tinados a cultivar 710.5 Ha„, tal como se muestra en el Cuadro*N 0 29-DA; <strong>de</strong> ese total,<br />
el Sector I (Norte) captó el 50.6% y <strong>la</strong> diferencia fue aviada en el Sector II (Sur). En<br />
el mismo Cuadro, se observa que los mayores recursos económicos se <strong>de</strong>stinaron al culti<br />
vo <strong>de</strong>l arroz, que absorbió el 33>.6% <strong>de</strong>l monto, <strong>de</strong> los préstamos agríco<strong>la</strong>s; <strong>la</strong> papa y<br />
el maíz <strong>de</strong>mandaron a su vez el 29.7 y 21.0% <strong>de</strong>l total aviado, siendo en consecuencia<br />
muy reducida <strong>la</strong> importancia <strong>de</strong> los otros cultivos.<br />
Respecto a los avfos pecuarios, en total en ambos sectores se otorgó sólo<br />
S/.4'101,000.00, correspondiendo <strong>la</strong> mayor proporción al Sector II (Sur) (79.7%) y <strong>la</strong><br />
diferencia fue captada por el Sector I (Norte), tal como se muestra en el Cuadro N 0<br />
30-DA.
T3<br />
(ft<br />
CUADRO N 0 28-DA O)<br />
MONTO E INTERESES COBRADOS POR EL BANCO AGRARIO<br />
Prestatarios<br />
*<br />
Ciase<br />
Uso<br />
Monto<br />
Intereses<br />
Sostenimiento<br />
- Alimenticios<br />
- Industriales<br />
7%<br />
10%<br />
Grupos<br />
Asociativos<br />
Comercialización<br />
- Producto <strong>de</strong> consumo ínter<br />
no y compra <strong>de</strong> insumo o<br />
- Producto <strong>de</strong> exportación<br />
(Los préstamos se otorgan sin<br />
limitación <strong>de</strong> monto).<br />
10%<br />
12%<br />
Capitalización<br />
- Insta<strong>la</strong>ciones permanentes,<br />
adquisición <strong>de</strong> ganado.<br />
10%<br />
Sostenimiento<br />
- Alimenticios<br />
Hasta S/.300,000.00<br />
Más <strong>de</strong> S/.300,000.00<br />
7%<br />
9%<br />
Agricultores<br />
Individuales<br />
Fuente : .Banco Agrario,.<br />
Comercialización<br />
Capitalización<br />
- Industriales,<br />
- Producto <strong>de</strong> consumo inter<br />
no y compra <strong>de</strong> insumo<br />
- Producto <strong>de</strong> exportación<br />
- Insta<strong>la</strong>ciones permanentes^<br />
adquisición <strong>de</strong> ganado<br />
Hasta S/. 150,000.00<br />
De S/. 150,001.00 a 300,000.00<br />
Más<strong>de</strong>S/.300,000.00<br />
Hasta S/. 150,000.00<br />
De S/. 150,001.00 a 300,000.00<br />
Más <strong>de</strong> S/.300,000.00<br />
Hasta S/. 150,000.00<br />
Más <strong>de</strong> S/. 150,000.00<br />
Hasta S/. 150,000.00<br />
De S/. 150,001.00 a 300,000.00<br />
Más <strong>de</strong> S/.300,000.00<br />
10%<br />
12%+ 2% <strong>de</strong> com<br />
10%<br />
12%<br />
12%+2 <strong>de</strong> com.<br />
12%<br />
12%+2<strong>de</strong> com.<br />
10%<br />
12%+1 <strong>de</strong> com.<br />
12%+ 2<strong>de</strong> com.<br />
N<br />
O<br />
Z<br />
><br />
z<br />
o<br />
TO<br />
H<br />
m<br />
a<br />
m<br />
n<br />
><br />
«—4<br />
><br />
><br />
SO<br />
n<br />
>
DIAGNOSTICO AGROPECUARIO Pig. 427<br />
CUADRO N 0 29-PA<br />
AVÍOS AGRÍCOLAS POR CULTIVOS OTORGADOS POR EL BANCO AGRARIO<br />
(1974)<br />
Frente : Banro Agrario.
Pág. 428 ZONA NORTE DE CAJAMARCA<br />
CUADRO N o 30-DA<br />
AVÍOS PECUARIOS ACORTO Y LARGO PLAZO OTORGADOS POR EL<br />
BANCO AGRARIO<br />
(1974)<br />
Tipo<br />
Préstamos<br />
N 0 %<br />
Vacunos<br />
N 0 %<br />
Monto<br />
Soles %<br />
S se tor<br />
- . . .<br />
1 (Norte)<br />
Corto PJazo<br />
Largo P<strong>la</strong>zo<br />
4<br />
7,5<br />
99<br />
16,9<br />
831,000<br />
20.3<br />
Subtotal<br />
4<br />
7.5<br />
99<br />
16.9<br />
831,000<br />
20.3<br />
: Sector II (Sur)<br />
Corto P<strong>la</strong>zo<br />
Largo P<strong>la</strong>zo<br />
48<br />
1<br />
90.6<br />
1.9<br />
484<br />
3<br />
82,6<br />
0,5<br />
3 "240,000<br />
30,000<br />
79,0<br />
0.7<br />
Subtotal<br />
49<br />
92.5<br />
487<br />
83.1<br />
3*270,000<br />
79 o 7<br />
Total.<br />
53<br />
100.0<br />
586<br />
100,0<br />
4101,000<br />
100.0<br />
Fuente<br />
Banco Agrario<br />
(2). Fondo en Fi<strong>de</strong>icomiso<br />
Son los recursos económicos administrados por el Banco Agrario que se <strong>de</strong>dican a <strong>la</strong> e<br />
jecucíon <strong>de</strong> programas <strong>de</strong> crédito agríco<strong>la</strong> supervisado, con el propósito <strong>de</strong> ofrecer a<br />
yuda a los pequeños y medianos agricultores con limitados recursos económicos y dando<br />
preferencia a los beneficiarios <strong>de</strong> <strong>la</strong> Reforma Agraria que, en muchos casos, no He<br />
nen acceso a <strong>la</strong>s fuentes convencionales <strong>de</strong> crédito. Estos avíos se otorgan a grupos or<br />
ganizados o en forma individual, <strong>de</strong> acuerdo al Decreto Ley N 0 17716, teniendo co -<br />
mo propósito ofrecer asistencia técnica y supervisión.<br />
Las fuentes <strong>de</strong>l Fondo en Fi<strong>de</strong>icomiso provienen <strong>de</strong> convenios celebrados entre el Gobierno<br />
<strong>de</strong>l Perü y los siguientes organismos internacionales :<br />
Agencia para el Desarrollo Internacional (AID).<br />
Banco Interamericano <strong>de</strong> Desarrollo (BID)<br />
Banco Internacional <strong>de</strong> Reconstrucción y Fomento (BIRF).<br />
Programa Mundial <strong>de</strong> Alimentos <strong>de</strong> <strong>la</strong>s Naciones Unidas.
DIAGNOSTICO AGROPECUARIO Pag. 429<br />
- Donación <strong>de</strong>l Gobierno Ho<strong>la</strong>ndés.<br />
Para <strong>la</strong> zona estudiada, los fondos provienen <strong>de</strong>l AID, <strong>de</strong> una donación <strong>de</strong>l Gobierno<br />
Ho<strong>la</strong>ndés y <strong>de</strong>l aporte <strong>de</strong>l Gobierno Peruano, los que son aplicados al Programa <strong>de</strong> Cré<br />
dito Agríco<strong>la</strong> Supervisado <strong>de</strong> Promoción Agraria <strong>de</strong>l Ministerio <strong>de</strong> Agricultura. Este<br />
programa tenia una estructura administrativa a nivel nacional, conformada por el Consejo<br />
<strong>de</strong>l Fondo en Fi<strong>de</strong>icomiso, los Comités Regionales y los Comités Locales; este programa<br />
funcionó hasta el 20 <strong>de</strong> Mayo <strong>de</strong> 1974, y tenfa autoridad para aprobar y ejecu -<br />
tar <strong>la</strong>s solicitu<strong>de</strong>s <strong>de</strong> créditos, <strong>la</strong>s que posteriormente se recepcionaban y tramitaban a<br />
través <strong>de</strong>l Banco Agrario.<br />
En el Cuadro N 0 31-DA / , se muestra los tipos <strong>de</strong> préstamos, p<strong>la</strong>zos, garantías y montos,<br />
e<strong>la</strong>borados <strong>de</strong> acuerdo al "Manual <strong>de</strong> Crédito <strong>de</strong>l Programa Agríco<strong>la</strong> Supervisado", con<br />
feccionado por el Ministerio <strong>de</strong> Agricultura y el Banco Agrario,, Según <strong>la</strong>s disposiciones<br />
<strong>de</strong>l Consejo <strong>de</strong>l Fondo a los prestatarios individuales, se les podía prestar como<br />
máximo S/„600,000, pudiendo dar para cada tipo <strong>de</strong> préstamo basta el 50% <strong>de</strong>l límite<br />
establecido. En el caso <strong>de</strong> <strong>la</strong>s cooperativas, <strong>la</strong>s socieda<strong>de</strong>s agríco<strong>la</strong>s <strong>de</strong> interés social<br />
(SAIS), <strong>la</strong>s comunida<strong>de</strong>s y otros grupos rurales, el límite era igual a <strong>la</strong> suma <strong>de</strong> los<br />
montos que podía recibir cada miembro individualmente; pero, en ningún caso, podía<br />
sobrepasar <strong>la</strong> capacidad <strong>de</strong> en<strong>de</strong>udamiento <strong>de</strong> <strong>la</strong>s empresas.<br />
Las tasas <strong>de</strong> interés eran <strong>la</strong>s siguientes :<br />
- Las cooperativas, comunida<strong>de</strong>s campesinas, socieda<strong>de</strong>s agríco<strong>la</strong>s <strong>de</strong> interés social<br />
(SAIS) y otros grupos rurales <strong>de</strong>bían pagar el 7% anual al rebatir para cualquiermon<br />
to y tipo <strong>de</strong> avío, con excepción <strong>de</strong>l avío forestal, que sólo <strong>de</strong>vengará el 2%anual<br />
al rebatir por concepto <strong>de</strong> comisión ,<br />
- Para los agricultores individuales con préstamos <strong>de</strong>stinados a <strong>la</strong> producción <strong>de</strong> ali -<br />
mentos, tanto agríco<strong>la</strong> como gana<strong>de</strong>ros, <strong>la</strong> tasa <strong>de</strong> interés era <strong>de</strong>l 7% anual al reba<br />
tir, si el monto total no sobrepasaba <strong>de</strong> S/,1 50,000.00, y <strong>de</strong>l 9%, cuando el mon -<br />
to era mayor <strong>de</strong> S/„ 150,000,00, sin ningún otro recargo.<br />
Los préstamos agríco<strong>la</strong>s no alimenticios, los refaccionarios mobiliarios y los refaccio<br />
narios inmobiliarios, se regían por <strong>la</strong> tasa vigente <strong>de</strong>l Banco Agrario, sin ningún o<br />
tro recargo.<br />
- Para préstamos comerciales o sobre productos, <strong>la</strong> tasa era <strong>de</strong> 10% anual al rebatir ,<br />
cualquiera que fuese el monto, sin ningún otro recargo.<br />
- Para préstamos re<strong>la</strong>cionados con el establecimiento y manejo <strong>de</strong> p<strong>la</strong>ntaciones fores -<br />
tales, <strong>la</strong> tasa <strong>de</strong> interés era <strong>de</strong> 2% anual al rebatir por concepto <strong>de</strong> comisión.<br />
En el Cuadro N 0 32-DA', se observa <strong>la</strong> distribución <strong>de</strong> los préstamos <strong>de</strong>l Fondo en Fi<br />
<strong>de</strong>icomiso para los cuales sumaron un monto <strong>de</strong> S/.?'! 88,640.00, correspondiendo <strong>la</strong><br />
mayor proporción al Sector II (Sur), que captó el 74% <strong>de</strong>l total.
PLAZOS, GARANTÍAS Y MONTOS DE LOS PRESTAMOS OTORGADOS CON LOS FONDOS EN FIDEICOMISO<br />
CO<br />
o<br />
Características<br />
Agríco<strong>la</strong><br />
Pecuario<br />
Forestal<br />
A v f<br />
0 s<br />
Refaccionario<br />
Mobiliario<br />
Refaccionario<br />
Inmobiliario<br />
Comerr<strong>la</strong>l<br />
C.P.<br />
Hasta 2 años.<br />
Ejem: cultivos <strong>de</strong><br />
panllevar t viveros<br />
frutales y forestales<br />
1 a 2 años-<br />
Ejem: ganado <strong>de</strong> en<br />
gor<strong>de</strong><br />
8 meses a 2 años<br />
Ejem: viveros fores.<br />
tales, extracción <strong>de</strong><br />
ma<strong>de</strong>ras y gomas ,<br />
etc.<br />
1 a 2 años.<br />
Ejem. pulverizado'<br />
res y herramientas<br />
manuales, etc<br />
1 a 12 meses.<br />
Ejem productos cosecha i<br />
dos e insumos, I<br />
P<strong>la</strong>zos<br />
•<br />
M,P,<br />
y<br />
L,P.<br />
3 a 12 años<br />
Ejem: cultivos <strong>de</strong><br />
alfalfa, ínsta<strong>la</strong> —<br />
ción <strong>de</strong> frutales ,<br />
etc.<br />
3 a 16 años(pue<strong>de</strong><br />
llegar a 20),<br />
Ejem: crianza <strong>de</strong> a-<br />
nimales menores.<br />
ganado lechero, ,
DIAGNOSTICO AGROPECUARIO Pág. 431<br />
Analizando los préstamos según los beneficiarios, se observa que <strong>la</strong> mayor propor —<br />
ción se otorgó a los agricultores <strong>de</strong> los grupos organizados (71 .1% <strong>de</strong>l total) y el<br />
28.9% se dio a los agricultores, individualmente. También es importante <strong>de</strong>stacar<br />
que <strong>de</strong> acuerdo al <strong>de</strong>stino <strong>de</strong> los préstamos, los avibs agríco<strong>la</strong>s en ambos sectores fue<br />
ron los que absorbieron <strong>la</strong> mayor proporción <strong>de</strong> capital (87.1% <strong>de</strong>l total); en segundo<br />
lugar, se dio préstamos pecuarios, alcanzando sólo el 12.6% <strong>de</strong>l total aviado y<br />
los <strong>de</strong> carácter refaccionario mobiliario sólo captaron el 0.3%.<br />
(3). Grado <strong>de</strong> Participación <strong>de</strong>l Crédito<br />
A pesar <strong>de</strong> <strong>la</strong> trascen<strong>de</strong>ncia que tiene el crédito en <strong>la</strong> actividad agtopecuaria, su aplicación<br />
no está muy difundida en <strong>la</strong> zona. Esto se explica en parte por que el Banco A<br />
grario dispone <strong>de</strong> limitada capacidad operativa (insta<strong>la</strong>ciones y oficinas, medios <strong>de</strong><br />
transporte y personal), siendo factores limitantes también <strong>la</strong> lentitud <strong>de</strong>l trámite admi -<br />
nistrativo, <strong>la</strong> oportunidad <strong>de</strong>l crédito y los montos otorgados por unidad <strong>de</strong> área cultiva<br />
da, que están muy por <strong>de</strong>bajo <strong>de</strong> los costos reales <strong>de</strong> producción. Por otra parte, <strong>la</strong><br />
difrcii accesibilidad <strong>de</strong> muchos fundos y su reducida extensión impi<strong>de</strong>n que se lleve a<br />
cabo una a<strong>de</strong>cuada supervisión y se obtenga un buen nivel <strong>de</strong> recuperación.<br />
CUADRO N 0 32-DA<br />
DISTRIBUCIÓN DE LOS PRESTAMOS DEL FONDO EN FIDEICOMISO<br />
(1974)<br />
Avfos<br />
Sector 1 (Norte):<br />
Avío Agríco<strong>la</strong><br />
Avío Pecuario<br />
Ref. Mobiliario<br />
Grupos Organizados<br />
Monto |<br />
(s/.)<br />
l , 590,000 s<br />
I<br />
%<br />
31.1<br />
Monto<br />
(S/.)<br />
Individuales<br />
277,990<br />
%<br />
13.4<br />
Monto<br />
(SA)<br />
, Total<br />
1 '867,990<br />
%<br />
26.0<br />
Si-Stotal<br />
Sector II (Sur):<br />
Avío Agríco<strong>la</strong><br />
Avío Pecuario<br />
Ref„ Mobiliario<br />
r590,000<br />
3-520,000<br />
31.1<br />
68.9<br />
. 277,990<br />
869,750<br />
910,000<br />
20,900<br />
13.4<br />
41.8<br />
43.8<br />
1.0<br />
1 '867,990<br />
4 , 389,750<br />
910,000<br />
20 t 900 ^<br />
26.0<br />
61.1<br />
12.6<br />
0.3<br />
Subtotal<br />
3'520,000<br />
68.9<br />
r800,ó50<br />
86.6<br />
SUCOSO<br />
74.0<br />
Total<br />
5 "110,000<br />
100.0<br />
2 , 078,ó40<br />
100.0<br />
7 , 188,640<br />
100.0<br />
Puente : Banc a A grafio.
pgo. 432 ZONA NORTE DE CAJAMARCA<br />
CUADRO N 0 33-DA<br />
GRADO DE PARTICIPACIÓN DEL CREPITO SOBRE EL AREA ANUAL DE PRODUCCIÓN<br />
(1974)<br />
Areas<br />
Sector 1 (Norte)<br />
Ha.<br />
%<br />
Sector II (Sur)<br />
Ha. | %<br />
Ha.<br />
Total<br />
%<br />
] Area no Aviada<br />
1 Area Aviada<br />
51,217.5<br />
381.5<br />
99.3<br />
0.7<br />
32,481.0! 98.7<br />
437.0] 1.3<br />
83,698.5<br />
818.5<br />
99.0<br />
1.0<br />
| Area Anual <strong>de</strong><br />
] Producción<br />
51,599,0<br />
100.0<br />
32,918.0 100.0<br />
84,517,0<br />
100.0<br />
, j nv . ONEKN<br />
Analizando <strong>la</strong> participación <strong>de</strong>l crédito agrario en re<strong>la</strong>ción a ¡as áreas cultivadas durante<br />
el año 1974, tal como se muestra en el Cuadro N 0 33-DA, se observa que <strong>de</strong>l á-<br />
rea anual <strong>de</strong> producción (84,517 Ha.) se aviaron 818.5 Ha., que representó sólo el<br />
1 .0% <strong>de</strong>l total consi<strong>de</strong>rado, quedando sin asistencia económica el 99.0% restante»<br />
Por otro <strong>la</strong>do, si se compara <strong>la</strong> re<strong>la</strong>ción entre los costos <strong>de</strong> producción agríco<strong>la</strong>s y el<br />
monto <strong>de</strong> avíos agríco<strong>la</strong>s, tal como se muestra en los Cuadros N° 25 y 26 <strong>de</strong>l AnexoVI.,<br />
se observa que sólo se otorgó el 4,0% (S/. 13''409,360.00) <strong>de</strong>l capital necesario para<br />
aten<strong>de</strong>r el gasto <strong>de</strong> una compaña. Estos indicadores reve<strong>la</strong>n que el sector agrario se en<br />
cuentra <strong>de</strong>ficientemente atendido, siendo <strong>la</strong> falta <strong>de</strong> capital uno <strong>de</strong> los principalesfac<br />
tores que <strong>de</strong>terminan que este sector <strong>de</strong>sarrolle muy lentamente y permanezca estacio -<br />
nario y <strong>de</strong>primido»<br />
6. Análisis Económico <strong>de</strong> los Factores <strong>de</strong> Producción<br />
Los lineamientos <strong>de</strong> polTtica <strong>de</strong>l sector agropecuario para el corto<br />
y mediano p<strong>la</strong>zo consi<strong>de</strong>ran, como objetivos prioritarios, el incremento <strong>de</strong> <strong>la</strong> productividad<br />
a partir <strong>de</strong> acciones concretas que contribuyan en forma efectiva a <strong>la</strong> optimización <strong>de</strong>l uso<br />
<strong>de</strong> los factores <strong>de</strong> producción.<br />
Esta parte <strong>de</strong>l diagnóstico permite disponer <strong>de</strong> elementos <strong>de</strong> juicio<br />
para <strong>la</strong> formu<strong>la</strong>ción <strong>de</strong> programas <strong>de</strong> producción, <strong>de</strong>stinados a lograr incrementos en <strong>la</strong> producción<br />
<strong>de</strong> <strong>la</strong> tierra, <strong>de</strong> <strong>la</strong> mano <strong>de</strong> obra y <strong>de</strong>l capital. La cuantificación <strong>de</strong> <strong>la</strong> productividad<br />
<strong>de</strong> estos factores permite apreciar en forma muy general el estado económico actual<br />
<strong>de</strong> algunos cultivos en el área <strong>de</strong> estudio.<br />
El concepto <strong>de</strong> productividad se refiere a <strong>la</strong> re<strong>la</strong>ción existente en-
DIAGNOSTICO AGROPECUARIO Pág. 433<br />
tre el valor <strong>de</strong> <strong>la</strong> producción y los factores empleados. Se utiliza el valor <strong>de</strong> <strong>la</strong> produc<br />
ción en vez <strong>de</strong>l producto, por <strong>la</strong> dificultad <strong>de</strong> comparar distintas unida<strong>de</strong>s físicas; <strong>de</strong> ahí*<br />
que, para facilitar el análisis, los factores se expresan en unida<strong>de</strong>s monetarias. El análisis<br />
se ha realizado en base <strong>de</strong> <strong>la</strong> información obtenida en el campo, al entrevistar a los agri -<br />
cultores ubicados en <strong>la</strong>s cercanfas <strong>de</strong> <strong>la</strong>s vias terrsslres <strong>de</strong> acceso al área <strong>de</strong> estudio, ha<br />
biéndose seleccionado para tal fin los princ pales culnvos: <strong>la</strong> papa, el maíz, <strong>la</strong> cebada y<br />
<strong>la</strong> arve¡a.<br />
á. La Producnvic'ad en el Cultivo <strong>de</strong> <strong>la</strong> Papa<br />
La papa es un cultivo c'o gran importancia socio económica y que se<br />
caracteriza por ser dinamizador <strong>de</strong> <strong>la</strong> economía regional (por <strong>la</strong> gran cantidad <strong>de</strong> insumas<br />
que <strong>de</strong>manda), es base <strong>de</strong> <strong>la</strong> dieta popu<strong>la</strong>r y tiene una gran área cultivada, así como un<br />
gran <strong>volumen</strong> <strong>de</strong> producción. A<strong>de</strong>más, es un cultivo somen do a una tecnificación <strong>de</strong> varíe<br />
dos niveles y que absorbe gran cantidad <strong>de</strong> mano ds obre y beneficia indi recta men re a oíros<br />
cultivos,<br />
(1)„ Productividad <strong>de</strong> <strong>la</strong> Tierra<br />
Según el Censo Agropecuario <strong>de</strong> 1972, el cuIHvo <strong>de</strong> <strong>la</strong> papa en <strong>la</strong> zona <strong>de</strong> estudio a -<br />
barco el 10,1% <strong>de</strong>! área cultivada, <strong>de</strong>stacando los subsectores <strong>de</strong> Hualgayoc (Bamba -<br />
marca) y Chota, con 2,965 Ha 1,802 Ha» respectivamente; <strong>de</strong> ese total, el 71 .4%<br />
se conduce en secano--- 2" ¿/ícor r's o este sistema se emplea en mayor proporción<br />
en los sectores <strong>de</strong> Hualgayoc y San Miguel, con 796 Ha, y 683 Ha,, respectivamente.<br />
Este cultivo está supeditado en gran medida a los impon<strong>de</strong>rables <strong>de</strong> <strong>la</strong> naturaleza, factor<br />
que, sumado a ¡a divetsidad <strong>de</strong> microclirras, <strong>de</strong>íarmina una gran variabilidad en su<br />
productividad da un año a otro<br />
En esta variación, influyen también <strong>la</strong>s áreas que están ligadas a <strong>la</strong> economía <strong>de</strong> merec<br />
do y que se encuentran ubicadas en <strong>la</strong>s cercanías <strong>de</strong> <strong>la</strong>s carreteras y alre<strong>de</strong>dor o cerec<br />
<strong>de</strong> los centros pob<strong>la</strong>dos, <strong>la</strong>s que utilizan insumas industriales, semil<strong>la</strong>s mejoradas y rec<br />
¡izan un mejor <strong>la</strong>boreo <strong>de</strong> <strong>la</strong> tierra y aplicación <strong>de</strong> conocimientos técnicos re<strong>la</strong>cione -<br />
dos con <strong>la</strong>s prácticas culturales (control <strong>de</strong> p<strong>la</strong>gas y enfermeda<strong>de</strong>s y abonamiento); este<br />
conjunto <strong>de</strong> variables favorece e influye para que <strong>la</strong> productividad, por lo general, rs<br />
suite mayor y los agricultores tengan más capacidad <strong>de</strong> negociación y obtengan precios<br />
que resultensa,-ei reflejo <strong>de</strong> los que rigen en los mercados <strong>de</strong> <strong>la</strong> Costa (precio <strong>de</strong> mayorista)<br />
En <strong>la</strong>s áreas que no están ligadas a <strong>la</strong> economía <strong>de</strong> mercado (distantes <strong>de</strong> <strong>la</strong>s carrereras),<br />
<strong>la</strong> producción se <strong>de</strong>stina básicamente al aufoabastecimiento ~ (subsistencia) y el cultivo<br />
se hace en forma tradicional, reduciendo los insumos al máximo y obteniendo como<br />
consecuencia una baja productividad; a<strong>de</strong>más, estos agricultores carecen <strong>de</strong> capaci<br />
dad <strong>de</strong> negociación, teniendo que ven<strong>de</strong>r, abastecerse <strong>de</strong> otros productos (<strong>de</strong> <strong>la</strong>s carre<br />
teras) y retornar a sus fundos. Esta situación es bien conocida y explotada por los in -<br />
termediarios (camioneros y comerciantes), que ofrecen precios muy por <strong>de</strong>bajo <strong>de</strong> los
Pág. 434<br />
ZONA NORTE DE CAJAMARCA<br />
que pue<strong>de</strong>n obtenerse en otros mercados.<br />
La variación <strong>de</strong> <strong>la</strong> productividad tiene trascen<strong>de</strong>ncia no sólo para <strong>la</strong> economia <strong>de</strong> <strong>la</strong><br />
zona <strong>de</strong> estudio sino que repercute fuera <strong>de</strong> el<strong>la</strong>, ya que ia producción <strong>de</strong> papa no sólo<br />
requiere <strong>de</strong> insumes (muchos <strong>de</strong> los cuales provienen <strong>de</strong> otras áreas) sino también u<br />
na apreciable cantidad <strong>de</strong> mano <strong>de</strong> obra y capital (que dinamiza <strong>la</strong> economía regional).<br />
Sin embargo, <strong>la</strong> productividad <strong>de</strong>l cultivo es una característica que no pue<strong>de</strong> ser analj^<br />
zada in<strong>de</strong>pendientemente por campaña agríco<strong>la</strong>, porque si los precios en chacra <strong>de</strong>l<br />
producto son atractivos para el agricultor, este en <strong>la</strong> próxima campaña realizará unama<br />
yor inversión en el cultivo y le prodigará mayor&s cuidados, con el fin <strong>de</strong> acrecentar<br />
los rendimientos y obtener al final una productividad mucho mayor que si no hubiera<br />
existido este estímulo. Es <strong>de</strong>cir que, <strong>la</strong> productividad <strong>de</strong>l cultivo resulta vulnerable a<br />
los precios y es un factor que influye en <strong>la</strong> <strong>de</strong>cisión <strong>de</strong>l agricultor, contribuyendo <strong>la</strong>s<br />
expectativas que ofrece el mercado a mejorar o reducir<strong>la</strong> en períodos <strong>de</strong> corto y media<br />
no p<strong>la</strong>zo»<br />
El Cuadro N 0 34-DA muestra los niveles <strong>de</strong> productividad <strong>de</strong>tectados por ONERN para<br />
<strong>la</strong> campaña <strong>de</strong> 1974, observándose variaciones que osci<strong>la</strong>n entre S/. 21,250.,00 a<br />
S/„ 96,000.00 por hectárea» En promedio, los mayores niveles correspon<strong>de</strong>n a los sub<br />
sectores <strong>de</strong> Cutervo y Contumazá, con S/„54, 780.00 y S/„53,380.00 por hectárea, res<br />
pectivamente; los menores niveles se observan en los subsectores <strong>de</strong> Hualgayoc y Chota,<br />
con S/.34,670.00 y S/o38, 840.00 por hectárea, respectivamente. Las diferencias<br />
<strong>de</strong> productividad que se observan se explican más por <strong>la</strong>s variaciones en los rendimientos<br />
unitarios que por los precios y el tamaño <strong>de</strong> <strong>la</strong>s unida<strong>de</strong>s <strong>de</strong> producción. En gene -<br />
ral, los niveles <strong>de</strong> productividad mínimos <strong>de</strong>tectados por ONERN resultan muy superiores<br />
a los que alcanzarían <strong>la</strong> mayoría <strong>de</strong> los fundos; ello se explica porque los fundos<br />
encuestados estaban ubicados a lo <strong>la</strong>rgo <strong>de</strong> <strong>la</strong>s vías terrestres o alre<strong>de</strong>dor <strong>de</strong> los centros<br />
pob<strong>la</strong>dos.<br />
(2). Productividad <strong>de</strong> <strong>la</strong> Mano <strong>de</strong> Obra<br />
Dal total <strong>de</strong> <strong>la</strong> mano <strong>de</strong> obra empleada en <strong>la</strong> actividad agríco<strong>la</strong>, el cultivo <strong>de</strong> <strong>la</strong> papa<br />
absorbió el 20,^%, cifra que representa a 2,541 equivalentes hombres/año (EHA), correspondiendo<br />
<strong>la</strong> mayor <strong>de</strong>manda al subsector <strong>de</strong> Hualgayoc, que requirió 879 equiva —<br />
valentes hombres/año. En los fundos ligados a <strong>la</strong> economía <strong>de</strong> mercado, con frecuencia<br />
se emplea <strong>la</strong> mano <strong>de</strong> obra contratada, en <strong>la</strong> que existe control y el pago <strong>de</strong> los ser<br />
vicios generalmente se efectúa en moneda; en esos fundos, a pesar <strong>de</strong> que existe dispo<br />
nibilidad <strong>de</strong> mano <strong>de</strong> obra para su contratación, hay poca disposición para emplearse<br />
en <strong>la</strong>bores que no sean <strong>la</strong>s <strong>de</strong> cosecha. Esta actitud hacia el trabajo y <strong>la</strong> heterogeneidad<br />
<strong>de</strong> <strong>la</strong> fuerza <strong>la</strong>boral disminuye su eficiencia en un cultivo que requiere cierta espe<br />
cialización. En los fundos alejados y no ligados a <strong>la</strong> economía <strong>de</strong> mercado, parece<br />
que existiera mayor <strong>de</strong>sgano para el trabajo (campos empastados y mal <strong>la</strong>borados), que,<br />
conjuntamente con <strong>la</strong> heterogeneidad <strong>de</strong> <strong>la</strong> composición <strong>de</strong> <strong>la</strong> mano <strong>de</strong> obra (hombres,<br />
mujeres y niños) y su escasa disponibilidad, contribuyen a que su rendimiento sea muy li<br />
miíado.
DIAGNOSTICO<br />
AGROPECUARIO<br />
CUADRO N° 34-DA<br />
PRODUCTIVIDAD DE LA TIERRA CON EL CULTIVO DE LA PAPA<br />
(1974-1975)<br />
C u , • Area Cultivada<br />
Subsectores ¡<br />
1<br />
Ha.<br />
0.10<br />
0,70<br />
C utervo<br />
1.00<br />
1.00<br />
1.00<br />
1.00<br />
Producto<br />
Kg/Ha.<br />
9,000<br />
11,600<br />
9 S 200<br />
14,000<br />
15,000<br />
16.000<br />
Precio en<br />
Chacra<br />
3.50<br />
2.00<br />
5 00<br />
3.00<br />
6.00<br />
6,00<br />
Productividad<br />
S/./Ha.<br />
31,500<br />
23,200<br />
46,000<br />
42,000<br />
90,000<br />
96.000<br />
j<br />
Promedio<br />
0.80<br />
12,470<br />
4.25<br />
54,780<br />
Chota<br />
Promedio<br />
0.10<br />
0.10<br />
0.15<br />
0.25<br />
0.30<br />
1.00<br />
0,32<br />
8,000<br />
9,000<br />
4,250<br />
11,000<br />
6,600<br />
8.800<br />
7,940<br />
6,00<br />
5.00<br />
5.00<br />
6.00<br />
4.00<br />
3.00<br />
4.83<br />
48,000<br />
<strong>45</strong>,000<br />
21,250<br />
66,000<br />
26,400<br />
26.400 !<br />
38,840<br />
Hualgayoc<br />
Promedio<br />
Caja marca<br />
Promedio<br />
San Miguel<br />
Promsdío<br />
Contumazá<br />
0.25<br />
0.25<br />
0,50<br />
0,50<br />
1.00<br />
1.00<br />
0.58<br />
0.13<br />
0.20<br />
0.33<br />
0.50<br />
1.00<br />
1.00<br />
0.53<br />
0.2a<br />
0,20<br />
0,50<br />
0.50<br />
1.00<br />
0.48<br />
0.25<br />
0.50<br />
0.50<br />
1.00<br />
1.00<br />
1.00<br />
Promedio<br />
0.70<br />
Fuente: Encuestas ONERN, 1975!<br />
4,800<br />
4,000<br />
5,200<br />
12,000<br />
9,200<br />
12,000<br />
7.870<br />
9,600<br />
5,500<br />
9,600<br />
11,000<br />
9,600<br />
11.000<br />
9.380<br />
3,800<br />
10,000<br />
9,200<br />
11,000<br />
5,500<br />
7.860<br />
13,000<br />
9,300<br />
9,500<br />
7,000<br />
10,000<br />
11.500<br />
10.050<br />
5.00<br />
6.00<br />
4,00<br />
2.00<br />
6.00<br />
5,00<br />
4,66<br />
5.00<br />
7.00<br />
5,00<br />
6.00<br />
5,00<br />
6.00<br />
5,66<br />
6. Off<br />
6.00<br />
6,00<br />
6,00<br />
5.00<br />
5.80<br />
5.00<br />
6,00<br />
6,00<br />
5.00<br />
5.00<br />
5.00<br />
~- 5.83<br />
24,000<br />
24,000<br />
20,800<br />
24,000<br />
55,200 :<br />
60.000<br />
34.670<br />
48,000<br />
38,500<br />
48,000<br />
66,000<br />
48,000<br />
66.000<br />
52.420<br />
22,800<br />
60,000<br />
55,200<br />
66,000<br />
27.500<br />
46.300<br />
65,000<br />
55,800<br />
57,000<br />
35,000<br />
50,000<br />
57.500<br />
.' 53.380
Pág. 436<br />
ZONA<br />
NORTE DE CAJAMARCA<br />
Los niveles <strong>de</strong> productividad <strong>de</strong>tectados por ONERN, tal como se muestra en el Cua -<br />
dro N 0 35-DA, presentan variaciones extremas que osci<strong>la</strong>n entre los S/.36,020.00 y<br />
S/o282,350.00 por EoH.A. En promedio , los mayores niveles correspon<strong>de</strong>n a los<br />
subsectores <strong>de</strong> Cutervo y Cajamarca, con SA165,340 «00 y SA 129,020.00 por EJH.A.<br />
por hectárea, respectivamente; y los menores niveles correspon<strong>de</strong>n a los subsectores <strong>de</strong><br />
Chota y Hualgayoc, con SA82,990,00 y SA99, 810.00 E.H.A. por hectárea. Estas<br />
variaciones se explican tanto por los diferentes valores brutos <strong>de</strong> <strong>la</strong> producción alean -<br />
zados como por <strong>la</strong>s cantida<strong>de</strong>s <strong>de</strong> uso <strong>de</strong> equivalentes hombre/año por hectárea.<br />
En general, es posible que los niveles mínimos <strong>de</strong> productividad <strong>de</strong>tectados por<br />
ONERN resulten superiores a <strong>la</strong> gran mayorra <strong>de</strong> los fundos no ligados a <strong>la</strong> jsooraomfa<br />
<strong>de</strong> mercado; sin embargo, <strong>la</strong> cantidad <strong>de</strong> mano <strong>de</strong> obra empleada para los fundos ligados<br />
o no a <strong>la</strong> economía <strong>de</strong> mercado es parecida. Esto es explicable porque el mayor<br />
numero <strong>de</strong> jornales empleados en el primer grupo <strong>de</strong> fundos es <strong>de</strong>stinado a <strong>la</strong>s <strong>la</strong>bores<br />
<strong>de</strong> abonamiento, <strong>de</strong> sanidad y <strong>de</strong> un mejor <strong>la</strong>boreo, mientras que, en el segundo grupo<br />
<strong>de</strong> fundos, se emplea gran cantidad <strong>de</strong> mano <strong>de</strong> obra, porque ésta tiene un menor rendí<br />
miento, <strong>de</strong>bido a que en su uso no hay control „<br />
(3), Productividad <strong>de</strong>l Capital<br />
Del total <strong>de</strong>l capital <strong>de</strong> trabajo empleado en <strong>la</strong> actividad agríco<strong>la</strong>, el cultivo <strong>de</strong> <strong>la</strong> pa<br />
pa absorbió el 34,5%, estando los mayores gastos representados por <strong>la</strong> mano <strong>de</strong> obra y<br />
<strong>la</strong>s semil<strong>la</strong>s., La mayor proporción <strong>de</strong> capital usado correspondió al subsector <strong>de</strong> Hual -<br />
gayoc, con el 31 u9%, mientras que en el subsector <strong>de</strong> Santa Cruz, sólo se invirtió el<br />
1.9%» Hacien<strong>de</strong>? un análisis a nivel <strong>de</strong> fundo, se ha <strong>de</strong>tectado que el mayor uso <strong>de</strong> ca<br />
pital en este cultivo correspon<strong>de</strong> a los fundos que están cerca <strong>de</strong> <strong>la</strong>s carreteras y/o <strong>de</strong><br />
los centros pob<strong>la</strong>dos y que viven una economía <strong>de</strong> mercado. Este hecho tiene trascen<br />
<strong>de</strong>ncia porque influye en <strong>la</strong> actividad <strong>de</strong>! agricultor para <strong>de</strong>cidir el monto <strong>de</strong> capital a<br />
emplearse que, por lo general, se refleja en el uso <strong>de</strong> fertilizantes y pesticidas, en los<br />
que se efectiviza los <strong>de</strong>sembolsos monetarios. Respecto al monto a emplearse, el a -<br />
gricultor es muy pru<strong>de</strong>nte y cauteloso, actitud que, en cierta forma, no permite el uso<br />
<strong>de</strong> fuentes <strong>de</strong> financiamiento (crédito) que no sean propias,,<br />
Los coeficientes <strong>de</strong> productividad <strong>de</strong>l capital hal<strong>la</strong>dos por ONERN en su mayoría co -<br />
rrespon<strong>de</strong>n a fundos ligados a <strong>la</strong> economía <strong>de</strong> mercado y se muestran en el Cuadro N 0<br />
36-DA, don<strong>de</strong> se observa que los coeficientes presentan variaciones que osci<strong>la</strong>n entre<br />
1 .<strong>03</strong> y 3„44, correspondiendo los mayores niveles a los subsectores <strong>de</strong> Cajamarca, San<br />
Miguel y Cutervo, con 2.<strong>45</strong>, 2 Jó y 2,04, respectivamente; y los menores a los sub -<br />
sectores <strong>de</strong> Chota, Hualgayoc y Contumazá, con 1.74, 1.96 y 1 ,95, respectivamente.<br />
Estas diferencias se <strong>de</strong>ben al monto <strong>de</strong> los gastos totales, en los cuales el rubro <strong>de</strong> los<br />
jornales es el que tiene <strong>la</strong> mayor significación^ En general, en los casos ^<strong>de</strong>tectados<br />
por ONERN, se recupera <strong>la</strong> inversión, pero es <strong>de</strong> prever que, en ¡a mayoría <strong>de</strong> los fun<br />
dos no ligados a <strong>la</strong> economía <strong>de</strong> mercado, este nivel no llega a alcanzarse y, si se insis<br />
te en el cultivo, es por el valor que les representa <strong>la</strong> cosecha obtenida como fuente <strong>de</strong><br />
alimentos.
DIAGNOSTICO AGROPECUARIO PSg, 437<br />
CUADRO N°35-DA<br />
PRODUCTIVIDAD DE LA MANO DE OBRA EN EL CULTIVO DE LA PAPA<br />
(1974-1975)<br />
Subsectores<br />
Cutervo<br />
Promedio<br />
Chota<br />
Promedio<br />
Hualgayoc<br />
Promedio<br />
Cajamarca<br />
Promedio<br />
San Miguel<br />
Promedio<br />
Contumará<br />
Promedio - '~<br />
Area Cultivada<br />
Ha.<br />
0.10<br />
0.70<br />
1.00<br />
1.00<br />
1.00<br />
1.00<br />
0.80<br />
0.10<br />
0.10<br />
0.15<br />
0.25<br />
0.30<br />
1.00<br />
0.32<br />
0.25<br />
0,25<br />
0.50<br />
0.50<br />
1.00<br />
1.00<br />
0.58<br />
0.13<br />
0,20<br />
0.33<br />
0.50<br />
1.00<br />
1.00<br />
0,53<br />
0.20<br />
0,20<br />
0.50<br />
0,50<br />
1.00<br />
0.48<br />
0.25<br />
0.50<br />
0.50<br />
1.00<br />
1.00<br />
1.00<br />
" -- 0. 71<br />
EHA (*)<br />
por Ha.<br />
0.37<br />
0.27<br />
0.53<br />
0.19<br />
0.39<br />
0.34<br />
0.35<br />
0.70<br />
0.55<br />
0.59<br />
0.31<br />
0.59<br />
0.49<br />
0.53<br />
0.38<br />
0.26<br />
0.57<br />
0.63<br />
0.40<br />
0.26<br />
0.42<br />
0.47<br />
0.29<br />
0.38<br />
0,37<br />
0.38<br />
0.61<br />
0.42<br />
0.44<br />
0.48<br />
0.40<br />
0.61<br />
0.27<br />
0.44<br />
0.51<br />
0.51<br />
0.54<br />
0.31<br />
0.54<br />
0.60<br />
- 0.50<br />
Valor Bruto<br />
S/./Ha.<br />
31,500<br />
23,200<br />
46,000<br />
42,000<br />
90,000<br />
96.000<br />
54.780<br />
48,000<br />
<strong>45</strong>,000<br />
21,250<br />
66,000<br />
26,400<br />
26.400<br />
38.840<br />
24,000<br />
24, 000<br />
20,800<br />
24,000<br />
55,200<br />
60.000<br />
34.670<br />
48,000<br />
38,500<br />
48,000<br />
66,000<br />
48,000<br />
66.000<br />
52.420<br />
22,800<br />
60,000<br />
55,200<br />
66,000<br />
27.500<br />
46,300<br />
65,000<br />
55,800<br />
57,000<br />
35,000<br />
50,000<br />
57.500<br />
53.380<br />
Productividad<br />
S/./EHA (•)<br />
85,140<br />
85,930<br />
86,790<br />
221,050<br />
230,770<br />
282.350<br />
165.340<br />
68,570<br />
81,820<br />
36,020<br />
212,900<br />
44,750<br />
53.880<br />
82.990<br />
63,160<br />
92,310<br />
36,490<br />
38,100<br />
138,000<br />
230.770<br />
99.810<br />
102,130<br />
132,760<br />
126,920:<br />
178,380<br />
126,320<br />
108.200<br />
129.020<br />
51,820<br />
125,000<br />
138,000<br />
108,200<br />
101.850<br />
104,970<br />
127,<strong>45</strong>0<br />
109,410<br />
105,560<br />
112,900<br />
92,590<br />
95.830<br />
107,290<br />
(*) EHA : 270 jornales por año.<br />
Fuente: Encuestas ONERN, 1975 .
P^- -i 35 ZONA NORTE DE CAJAMARCA<br />
CUADRO N" 36-DA<br />
COEFICIENTE DE PRODUCTIVIDAD DELCAPITAL EN ELCULTIVO DE LA PAPA<br />
(1974-1975)<br />
í<br />
(<br />
1<br />
s<br />
1<br />
Subsiictores<br />
Cutcrvo<br />
"rom dio<br />
, Chota<br />
Promedio<br />
u&lg>yoc<br />
t<br />
, Tromedio<br />
'<br />
i C? ja aic rea<br />
i<br />
i<br />
Promedio<br />
| San Miguel<br />
i<br />
1<br />
i Prom dio<br />
1<br />
,<br />
¡ Contumazá<br />
!<br />
]<br />
i<br />
1 Prom dio<br />
Area Cultivada<br />
Ha.<br />
0.10<br />
0.70<br />
1.00<br />
1.00<br />
1.00<br />
1.00<br />
0.80<br />
0.10<br />
0.10<br />
0.15<br />
0.25<br />
0.30<br />
1.00<br />
0.31<br />
0.25<br />
0.25<br />
0.50<br />
0,50<br />
1,00<br />
1.00<br />
0.58<br />
0,13<br />
0,20<br />
0.33<br />
0.50<br />
1.00<br />
1.00<br />
0.52<br />
0.20<br />
0,20<br />
0.50<br />
0.50<br />
1.00<br />
0.48<br />
0.25<br />
0,50<br />
0.50<br />
1.00<br />
1.00<br />
1.00<br />
0.70<br />
Valor Bruto<br />
S/. /Ha.<br />
31,500<br />
23,200<br />
46,000<br />
42,000<br />
90,000<br />
96.000<br />
54.780<br />
48,000<br />
<strong>45</strong>,000<br />
21,250<br />
66,000<br />
26,400<br />
26.400<br />
38. 840<br />
24,000<br />
24,000<br />
20.800<br />
24.000<br />
55,200<br />
60,000<br />
34.670<br />
48,000<br />
38,500<br />
48 s 000<br />
66.000<br />
48.000<br />
66.000<br />
52.420<br />
22,800<br />
60,000<br />
55,200<br />
66,000<br />
27.500<br />
46.300<br />
65,000<br />
55,800<br />
57,000<br />
35,000<br />
50,000<br />
57.500<br />
53,380<br />
Gastos<br />
S/./Ha.<br />
28, 980<br />
20,650<br />
29,610<br />
18, 740<br />
30,340<br />
29.040<br />
26.230<br />
16, 720<br />
30,050<br />
17,200<br />
29,480<br />
17,960<br />
22,920<br />
22.390<br />
15,340<br />
8,600<br />
18,600<br />
16,460<br />
24,570<br />
23.220<br />
17.800<br />
23,380<br />
17,400<br />
20, 740<br />
19,170<br />
20, 740<br />
27.820<br />
21.540<br />
22,100<br />
22, 740<br />
23,890<br />
27, 820<br />
11.140<br />
21.540<br />
27,440<br />
27,440<br />
28, 590<br />
20,560<br />
25,870 |<br />
33.550<br />
27.240 I<br />
Coeficiente dr<br />
Productividad<br />
1.08<br />
1.12<br />
1.55<br />
2.24<br />
2.96<br />
3.30<br />
2.04<br />
2.87<br />
1.49<br />
1.23<br />
2.23<br />
1.46<br />
1.15<br />
1.74<br />
1.56<br />
2,79<br />
1.11<br />
1.<strong>45</strong><br />
2.24<br />
2.58<br />
1.96 i<br />
2.05<br />
2,21<br />
2.31<br />
3.44<br />
2,31<br />
2,37<br />
2.<strong>45</strong><br />
1.<strong>03</strong><br />
2.63<br />
2.31<br />
2.37<br />
2.46<br />
2.16<br />
2.36<br />
\ 2,<strong>03</strong><br />
1.99<br />
1.70<br />
^ 1.93<br />
1.71<br />
1,95<br />
i'uente : Encuestas ONERN, 1975.
DIAGNOSTICO AGROPECUARIO Pag. 439<br />
b. Productividad en el Cultivo <strong>de</strong> Maíz<br />
El maíz es un cultivo tradicional que tiene gran importancia por ser<br />
básico en <strong>la</strong> alimentación popu<strong>la</strong>r y porque <strong>la</strong> cha<strong>la</strong> constituye un suplemento importante en<br />
<strong>la</strong> alimentación <strong>de</strong>l ganado vacuno„ Por esa razón, ocupa una gran extensión, siendo c<strong>de</strong><br />
más un cultivo simple en cuanto a prácticas culturales.<br />
Según el Censo Agropecuario <strong>de</strong> 1972, el cultivo <strong>de</strong> maiz abarcó el<br />
39.5% <strong>de</strong>l área, <strong>de</strong>stacando como zonas productoras los subsectores <strong>de</strong> Chota yCufervo, con<br />
9,637 Ha. y 8,413 Ha-, respectivamente; <strong>de</strong> este total, el 85.3% se cultiva en - secano<br />
(con lluvias) y el 14.7% con riego. El último sistema se emplea en mayor proporción en<br />
los subsectores <strong>de</strong> San Miguel (9<strong>45</strong> Ha.) y Cajamarca (671 Ha.). En lo que se refiere a!<br />
<strong>volumen</strong> <strong>de</strong> producción, el cultivo <strong>de</strong> maíz aporta el 85% <strong>de</strong>l total, <strong>de</strong>stinándose una gran<br />
proporción al autoconsumo.<br />
(1). Productividad <strong>de</strong> <strong>la</strong> Tierra<br />
La productividad <strong>de</strong> <strong>la</strong> tierra con este cultivo es baja, <strong>de</strong>bido principalmente a que su<br />
conducción se lleva a cabo en forma tradicional y empleando preferentemente mafces<br />
<strong>de</strong> grano suave y semiduro, <strong>de</strong>stinados al autoconsumo (choclo, grano y harinas); los<br />
resultados qu£ se alcanzan <strong>de</strong>ben atribuirse a que <strong>la</strong>s areas don<strong>de</strong> se cultiva este cereal<br />
reúnen caracterfsticas ecológicas óptimas para su <strong>de</strong>sarrollo, ya que en contados casos<br />
se realizan prácticas culturales o <strong>de</strong> carácter técnico que permitan obtener mayores co<br />
sechas y contribuir a <strong>la</strong> optimización <strong>de</strong> <strong>la</strong> productividad (es muy raro el uso <strong>de</strong> abonos<br />
y pesticidas, asi" como el empleo <strong>de</strong> semil<strong>la</strong>s híbridas <strong>de</strong> alto rendimiento unitario).<br />
También es importante <strong>de</strong>tal<strong>la</strong>r que el uso <strong>de</strong>l crédito agríco<strong>la</strong> <strong>de</strong>stinado a financiar es<br />
te cultivo se usa en forma muy limitada.<br />
Las diferentes productivida<strong>de</strong>s que se registran en los subsectores que compren<strong>de</strong> <strong>la</strong> zona<br />
<strong>de</strong> estudio (Cuadro N 0 37-DA) pue<strong>de</strong>n atribuirse entre otros factores, a <strong>la</strong> irregu<strong>la</strong>r<br />
topografía origen <strong>de</strong> los variados microclimas existentes, los cuales conjuntamente con<br />
<strong>la</strong> capacidad <strong>de</strong> uso <strong>de</strong> los suelos y <strong>la</strong> predominancia <strong>de</strong>l clima (cálido y temp<strong>la</strong>do), <strong>de</strong><br />
terminan que los niveles <strong>de</strong> productividad varíen <strong>de</strong> fundo a fundo; a esto <strong>de</strong>be agregarse<br />
que, en muchos casos, el cultivo está asociado con fri¡ol, arvejas y lentejas.<br />
Cuando <strong>la</strong> productividad (kilo por hectárea) está por <strong>de</strong>bajo <strong>de</strong> lo normal, afecta seria<br />
mente a <strong>la</strong> alimentación no sólo <strong>de</strong> <strong>la</strong>s personas sino también <strong>la</strong> <strong>de</strong> los animales (aves)<br />
ya que es una <strong>de</strong> <strong>la</strong>s bases <strong>de</strong> <strong>la</strong> alimentación campesina y muchas veces es <strong>la</strong> causa <strong>de</strong><br />
<strong>la</strong> movilización <strong>de</strong> familias y/o comunida<strong>de</strong>s enteras hacia los centros pob<strong>la</strong>dos en <strong>de</strong>manda<br />
<strong>de</strong> este producto. Esta <strong>de</strong>manda ocasional a su vez <strong>de</strong>termina <strong>la</strong> elevación <strong>de</strong><br />
los precios que, al parecer, en los últimos años se ha acentuado y ha dado como conse<br />
cuencia que tanto <strong>la</strong> productividad (S/./Ha) como los precios <strong>de</strong> chacra resulten eleva<br />
dos.<br />
En el Cuadro N 0 37-DA, se muestra los diferentes niveles <strong>de</strong> productividad obtenidos<br />
por ONERN, advirtiéndose que se presentan variaciones extremas <strong>de</strong> S/.3,220.00 a<br />
S/.ló,800.00 por hectárea. Los mayores niveles promedio correspon<strong>de</strong>n a los subsecto
Pág. 440 ZONA NORTE DE CAJAMARCA<br />
res <strong>de</strong> Contumazá y San Miguel, con S/, 11,330.00 y S/.l 1,010.00 por hectárea, y<br />
los menores correspon<strong>de</strong>n a los subsectores <strong>de</strong> Chota y Hualgayoc, con SA5,830.00 y<br />
S/.6,510.00 por hectárea, respectivamente» Estas diferencias se explican por <strong>la</strong>s variaciones<br />
en los rendimientos unitarios y en los precios. En general, los niveles <strong>de</strong> pro<br />
ductividad obtenidos por ONERN están <strong>de</strong>ntro <strong>de</strong>l promedio obtenido por <strong>la</strong> mayona <strong>de</strong><br />
los fundos <strong>de</strong> <strong>la</strong> zona estudiada..<br />
(2). Productividad <strong>de</strong> <strong>la</strong> Mano <strong>de</strong> Obra<br />
El cultivo <strong>de</strong> máfz <strong>de</strong>mandó el 38.9% <strong>de</strong>l total <strong>de</strong> <strong>la</strong> mano <strong>de</strong> obra empleada en <strong>la</strong> ac<br />
tividad agnco<strong>la</strong> y representó 4,802 E.H.A^, correspondiendo <strong>la</strong> mayor <strong>de</strong>manda a los<br />
subsectores <strong>de</strong> Cutervo y Chota, con 1,246 y 1,428 Ed-LA., respectivamente. Se u-<br />
sa preferentemente <strong>la</strong> mano <strong>de</strong> obra familiar, mientras <strong>la</strong> mano <strong>de</strong> obra contratada se<br />
emplea muy esporádicamente y en forma limitada, principalmente en <strong>la</strong>s <strong>la</strong>bores <strong>de</strong> co<br />
secha, en <strong>la</strong> que, por lo general, se remunera con productos.<br />
Los niveles <strong>de</strong> productividad hal<strong>la</strong>dos por ONERN se muestran en el Cuadro N 0 38-DA<br />
y presentan variaciones extremas que osci<strong>la</strong>n <strong>de</strong> S/.l0,390.00 a S/. 120,000.00 por<br />
E.H.A, En promedio, los mayores niveles correspon<strong>de</strong>n a los subsectores <strong>de</strong> Contuma<br />
zá, San Miguel y Cajamarca, con S/.ó2,1 50,00, S/.50,120.00 y S/.47,160.00 por<br />
E.hLA., Estas variaciones se explican, en parte, por <strong>la</strong> disparidad en <strong>la</strong> productividad<br />
<strong>de</strong> <strong>la</strong> tierra y por <strong>la</strong>s diferencias en el uso <strong>de</strong>l equivalente hombre/año por hectárea.<br />
(3). Productividad <strong>de</strong>l Capital<br />
Del total <strong>de</strong>l capital <strong>de</strong> trabajo empleado en <strong>la</strong> actividad agríco<strong>la</strong>, el cultivo <strong>de</strong> maiz<br />
<strong>de</strong>mandó el 28,5% <strong>de</strong> <strong>la</strong> inversión y, <strong>de</strong> ese total, el mayor rubro correspondió a <strong>la</strong><br />
mano <strong>de</strong> obra. La mayor proporción <strong>de</strong> ese capital es utilizado en los subsectores <strong>de</strong><br />
Chota y Cutervo, alcanzando niveles que representan el 28.9%, respectivamente. El<br />
empleo <strong>de</strong> capital es muy variable y, a! parecer, <strong>la</strong> actitud <strong>de</strong>l agricultor es <strong>de</strong> pru -<br />
<strong>de</strong>ncia frente a los requerimientos <strong>de</strong> inversión; sin embargo, existe <strong>la</strong> inclinación a<br />
emplear mayores recursos económicos en los fundos don<strong>de</strong> se ha introducido varieda<strong>de</strong>s<br />
híbridas y en los cultivos bajo riego. Esta ten<strong>de</strong>ncia es notoria en los subsectores <strong>de</strong><br />
Contumazá y San MigueL Respecto a su origen, el capital <strong>de</strong> producción, en su ma -<br />
yoría, es <strong>de</strong>l agricultor y excepcional mente recibe créditos agríco<strong>la</strong>s, sean <strong>de</strong>l Banco<br />
Agrario o <strong>de</strong> terceras personas»<br />
Los coeficientes <strong>de</strong> productividad hal<strong>la</strong>dos por ONERN se muestran eñ el Cuadro N 0 -<br />
39-DA, presentando variaciones <strong>de</strong> 0.70 a 4, 57, En promedio, los mayores niveles<br />
correspon<strong>de</strong>n a los subsectores <strong>de</strong> San Miguel y Cajamarca, con 2,79 y 2.46, y los me<br />
noreS/niveles, correspon<strong>de</strong>n a Hualgayoc y Contumazá, con 1.68 y 1 .90, respectiva -<br />
mente.. Estas diferencias son explicables por <strong>la</strong>s variaciones en los gastos y en <strong>la</strong> productividad<br />
<strong>de</strong> <strong>la</strong> tierra. En general, con este cultivo se recupera el capital <strong>de</strong> traba<br />
¡o.y, en aquellos casos en que no se llega a esta situación, los resultados pue<strong>de</strong>n atribuirse<br />
a los efectos <strong>de</strong> <strong>la</strong> variación <strong>de</strong> <strong>la</strong>s condiciones climáticas.
DIAGNOSTICO AGROPECUARIO Pág. 441<br />
Subsectores<br />
Cutervo<br />
Promedio<br />
Chota<br />
Promedio<br />
Hualgayoc<br />
Promedio<br />
0,89<br />
0..10<br />
0.25<br />
0.26<br />
Cajamafca<br />
0,33<br />
0.40<br />
0 50<br />
1.00<br />
Promedio<br />
0.41<br />
0,15<br />
0.25<br />
San Miguel<br />
0.50<br />
0.50<br />
t 50<br />
1.00<br />
Promedio<br />
0,48<br />
0.25<br />
0.25<br />
C ontuma zá<br />
0.38<br />
1.00<br />
1.00<br />
1.20<br />
Promedio<br />
0.68<br />
Fuente : Encuestas ONERN, 1975,<br />
CUADRO N" 57-DA<br />
PRODUCTIVIDAD DE LA TIERRA CON EL CULTIVO DE MAÍZ<br />
Area Cultivada<br />
Ha.<br />
0,20<br />
0.25<br />
0..35<br />
0.50<br />
0.50<br />
1.00<br />
1.00<br />
0.54<br />
0.10<br />
0.25<br />
0.33<br />
0,50<br />
0.50<br />
0.57<br />
1.00<br />
0.46<br />
0.13<br />
0.25<br />
0,32<br />
0.,50<br />
1.00<br />
1,00<br />
3.00<br />
(1974-1975)<br />
Producto<br />
Kg/Ha„<br />
550<br />
880<br />
640<br />
1,500<br />
760<br />
800<br />
900<br />
860<br />
800<br />
440<br />
550<br />
400<br />
560<br />
700<br />
660<br />
590<br />
2,2Q0<br />
1 E 000<br />
660<br />
540<br />
660<br />
460<br />
620<br />
880<br />
1,400<br />
1,600<br />
520<br />
620<br />
560<br />
950<br />
600<br />
890<br />
1,600<br />
1,360<br />
1,500<br />
1,500<br />
1,120<br />
630<br />
1,290<br />
1,200<br />
800<br />
720<br />
1,500<br />
1,200<br />
2,100<br />
1,250<br />
Precio en Chacra<br />
S/./Kg.<br />
10.00<br />
10.00<br />
10.00<br />
10.00<br />
8.00<br />
8.00<br />
8.00<br />
9.14<br />
10.00<br />
8.00<br />
10.00<br />
15,00<br />
10.00<br />
8.00<br />
10.00<br />
10.14<br />
5,00<br />
10.00<br />
10,00<br />
7.00<br />
10.00<br />
1,00<br />
7,. 00<br />
8.00<br />
8.00<br />
8.00<br />
10,00<br />
8.00<br />
10.00<br />
7.05<br />
10.0©<br />
8.71<br />
10.00<br />
5.00<br />
10.00<br />
8.00<br />
10.00<br />
8.00<br />
8.50<br />
'10:00<br />
10.00<br />
10. 00<br />
8 00<br />
10.00<br />
8.00<br />
: 9.33<br />
Productividad l<br />
. S/./Ha. |<br />
5,500 ¡<br />
8,800 !<br />
6,400 ¡<br />
15,000 i<br />
6,080 i<br />
6,400 !<br />
7.200<br />
!<br />
7.910<br />
8,000<br />
3,520 |<br />
5,500 '<br />
6,000 !<br />
5,600 ;<br />
5,600<br />
6.600<br />
5,830<br />
11,000 ,<br />
10,000<br />
6,600 ;<br />
3,780 j<br />
6,600 !<br />
3,220 ¡<br />
4,340 í<br />
6,510 '<br />
11,200 1<br />
12,800 ;<br />
5,200 |<br />
4 t 960 ¡<br />
5,600 i<br />
6,650<br />
6.000<br />
7.490<br />
16,000<br />
6,800<br />
15,000<br />
12,000<br />
11 200<br />
5.040<br />
11 010<br />
12,000<br />
8.000<br />
7,200<br />
12,000<br />
12,000<br />
16.800<br />
11.330
Pág, 442 ZONA NORTE DE CAJAMARCA<br />
Subsectores<br />
Cutervo<br />
Promedio<br />
Chota<br />
Promedio<br />
Hualgayoc<br />
Promedio<br />
Cajamarca<br />
Promedio<br />
San Miguel<br />
Promedio<br />
Contumazá<br />
1 Promedio<br />
CUADRO N" 38-DA<br />
PRODUCTIVIDAD DE LA MANO DE OBRA CON EL CULTIVO DE MAÍZ<br />
Area Cultivada !<br />
Ha.<br />
O.&O<br />
0,25<br />
0.35<br />
0.50<br />
0.50<br />
1.00<br />
1.00<br />
0.54<br />
0.10<br />
0.25<br />
0.33<br />
0.50<br />
0.50<br />
0.57<br />
1.00<br />
0.46<br />
0.13<br />
0.25<br />
0.32<br />
0.50<br />
1.00<br />
1.00<br />
3.00<br />
0.89 *<br />
0.10<br />
0 25<br />
0.26<br />
0 33<br />
0.40<br />
0.50<br />
1.00<br />
0.41<br />
0.15<br />
0.25<br />
0.50<br />
0.50<br />
0.50<br />
1.00<br />
0.48<br />
0.25<br />
0.25<br />
0.38<br />
1.00<br />
1.00<br />
1.20<br />
0.68<br />
(*) E.H.A. : 270 jornales/año.<br />
Fuente: Encuestas ONERN - 1975,<br />
(1974-1975)<br />
E.H.A.<br />
por Ha.<br />
0.18<br />
0,22<br />
0,26<br />
0,27<br />
0,09<br />
0.14<br />
0.17<br />
0,19<br />
0.11<br />
0.16<br />
0.19<br />
0.07<br />
0.08<br />
0.16<br />
0.14<br />
0.13<br />
0.23<br />
0.19<br />
0.24<br />
0.10<br />
0.25<br />
0.31<br />
0.08<br />
0.20<br />
0.25<br />
0 17<br />
0. 17<br />
0 28<br />
0.10<br />
0.13<br />
0.11<br />
0.17<br />
0.35<br />
0.17<br />
0.41<br />
0,17<br />
0.25<br />
0.08<br />
0.24<br />
0.23<br />
0.28<br />
0 26<br />
0.13<br />
0.23<br />
0.14<br />
0.21<br />
Valor Bruto<br />
S// S //Ha,<br />
5 S 500<br />
8 a 800<br />
6,400<br />
15,000<br />
6 f 080<br />
6,400<br />
7.200<br />
7.910<br />
8,000<br />
3,520<br />
5,500<br />
6,000<br />
5,600<br />
5,600<br />
6.600<br />
5,830<br />
11,000<br />
10,000<br />
6,600<br />
3,780<br />
6,600<br />
3,220<br />
4.340<br />
6.510<br />
11,200<br />
12, 800<br />
5,200<br />
4,960<br />
5 S 600<br />
6.650<br />
6.000<br />
7.490<br />
16,000<br />
6,800<br />
- 15,000<br />
12,000<br />
11,200<br />
5.040<br />
11.010<br />
12,000<br />
8,000<br />
7,200<br />
12,000<br />
12,000<br />
16.800<br />
11.330<br />
i<br />
Productividad<br />
S///E.H.A. (*)<br />
30,560<br />
40,000<br />
24,620<br />
55,560<br />
67 f 560<br />
<strong>45</strong>,710<br />
42,350<br />
43,770 !<br />
72,730 j<br />
22,000<br />
28,950 |<br />
85,710<br />
70,000<br />
35,000<br />
47,140<br />
47.150<br />
47,830 |<br />
52,630 !<br />
27,500<br />
37,800 !<br />
26,400<br />
10,390<br />
54.250<br />
36.690<br />
44,800<br />
75,290<br />
30,590<br />
17,730<br />
56,000<br />
51,150<br />
54.550<br />
47.160<br />
<strong>45</strong> 710<br />
40,000<br />
36,55,0<br />
70,590<br />
44,800<br />
63.000<br />
50.120<br />
52,170 1<br />
28,570<br />
27 700<br />
92,310<br />
52,170<br />
120 000<br />
62 150 !<br />
j
DIAGNOSTICO AGROPECUARIO Pág. 443<br />
CUADRO N°° 39-DA<br />
COEFICIENTE DE PRODUCTIVIDAD DEL CAPITAL EN EL CULTIVO DE MAÍZ<br />
:(19i74- ;; 197§)<br />
Subsectoies,<br />
Area Cultivada<br />
Ha.<br />
Valor Bruto<br />
S/. /Ha.<br />
Gastos<br />
S/. /Ha.<br />
Coeficiente<br />
Productividad<br />
Cutervo<br />
Promedio<br />
Chota<br />
Promedio<br />
Hualgayoc<br />
Promedio<br />
Cajamarca<br />
Promedio<br />
San Miguel<br />
Promedio<br />
Contumazá<br />
Promedio<br />
0.20<br />
0.25<br />
0.35<br />
0.50<br />
0.50<br />
1.00<br />
1.00<br />
0.54<br />
0.10<br />
0.25<br />
0.33<br />
0.50<br />
0.50<br />
0.57<br />
1,00<br />
0.46<br />
0.13<br />
0.25<br />
0,32<br />
0,50<br />
1,00<br />
1.00<br />
• SjOO<br />
0.89<br />
0,10<br />
0.25<br />
0,26<br />
0,33<br />
0,40<br />
0,50<br />
1.00<br />
0.41<br />
0.15<br />
0,25<br />
0,50<br />
0,50<br />
0,50<br />
1,00<br />
9.48<br />
0,25<br />
0.25<br />
0.38<br />
1.00<br />
1.00<br />
1.20<br />
0,68<br />
5,500<br />
8,800<br />
6,400<br />
15,000<br />
6,080<br />
6,400<br />
7,200<br />
7.910<br />
8,000<br />
3,520<br />
5.500<br />
6,000<br />
5,600<br />
5,600<br />
6,600<br />
5.830<br />
11,000<br />
10,000<br />
6,600<br />
3,780<br />
6,600<br />
3,220<br />
4.340<br />
6.510<br />
11,200<br />
12,800<br />
5,200<br />
4,960<br />
5,600<br />
6,650<br />
6,000<br />
7.490<br />
16,000<br />
6,800<br />
15,000<br />
12,000<br />
11,200<br />
5.040<br />
11.010<br />
12,000<br />
8,000<br />
7,200<br />
12,000<br />
12,000<br />
16.800<br />
11.330<br />
3,230<br />
4,400<br />
4,490<br />
6,780<br />
1,330<br />
2,460<br />
3.860<br />
3,790<br />
3,500<br />
2,230<br />
4,980<br />
2,020<br />
1,780<br />
2,840<br />
2.990<br />
2,910<br />
5,170<br />
6,920<br />
4,400<br />
1,640<br />
3,500<br />
4,570<br />
2.340<br />
4,080<br />
4,300<br />
3,890<br />
3,260<br />
3,810<br />
3,540<br />
2,170<br />
1.590<br />
3,220<br />
4,370<br />
2,760<br />
7,160<br />
4,540<br />
4,080<br />
1.590<br />
4.080<br />
6,500<br />
5,920<br />
4,750<br />
6,670<br />
6,500<br />
5.440<br />
. 5,960<br />
1.70<br />
2.00<br />
1.42 i<br />
2.21 \<br />
4.57 !<br />
2.60 ;<br />
1.86 !<br />
2.34 !<br />
2.28 1<br />
1.57<br />
1.10<br />
2.97<br />
3.14<br />
1.97<br />
2.20<br />
2.17<br />
2.12<br />
1.44<br />
1.50<br />
2.30<br />
1.88<br />
0,70<br />
1.85<br />
1.68<br />
2,60<br />
3.29<br />
1.59<br />
1.30<br />
1*58<br />
3.06<br />
3.77<br />
2.46<br />
3,66<br />
2,46<br />
2.09<br />
2.64<br />
2.74<br />
3,16<br />
2.79<br />
1.84<br />
1.35<br />
1.51<br />
1.79<br />
1.84<br />
3.08<br />
1.90<br />
Fuente; Encuestas ONERN, 1975
Pág. 444 ZONA NORTE DE CAJAMARCA<br />
c<br />
La Productividad en el Cultivo <strong>de</strong> Cebada<br />
La cebada es un cultivo que tiene gran importancia en <strong>la</strong> zona ,<br />
por ser muy usado en <strong>la</strong> alimentación humana asi" como en <strong>la</strong> <strong>de</strong> animales domésticos, en es<br />
pecial el rastrojo; <strong>la</strong> extensión que se <strong>de</strong>dica a su sembrío es consi<strong>de</strong>rable. Es un cultivo<br />
simple que soporta <strong>la</strong>s variaciones <strong>de</strong> temperatura, poco exigente en agua y que permite a-<br />
provechar los terrenos marginales, aunque su sembrío en estos suelos, <strong>de</strong>bido a su fuerte pen<br />
diente, acelera, en algunos casos, el proceso <strong>de</strong> erosión.. En terrenos <strong>de</strong> pendiente suave,<br />
este cultivo es final <strong>de</strong> rotación y, en los <strong>de</strong> pendiente fuerte, se cultiva <strong>de</strong>spués <strong>de</strong> uno o<br />
más años <strong>de</strong> <strong>de</strong>scanso.<br />
(1). Productividad <strong>de</strong> <strong>la</strong> Tierra<br />
Este cultivo, que cubre el IS.OX<strong>de</strong>l área <strong>de</strong> producción, está concentrado principalmente<br />
en Cajamarca (Asunción) y Hualgayoc (Bambamarca)_ Respecto a <strong>la</strong> modalidad<br />
<strong>de</strong> cultivo, el 90.8% <strong>de</strong>l área se conduce en secano (ba¡o lluvias) y el 9.2% restante<br />
con riego; este último sistema se emplea preferentemente en San Miguel (<strong>45</strong>6 Ha.) y<br />
Cajamarca (294 Ha.)» En lo que se refiere a <strong>volumen</strong> <strong>de</strong> producción, <strong>la</strong> cebada repre<br />
senta el 4.0% <strong>de</strong>l total obtenido en el área <strong>de</strong> estudio, siendo casi en su totalidad <strong>de</strong>dicado<br />
al autoconsumo; su valor bruto equivale al 10.0% <strong>de</strong>l total generado por <strong>la</strong><br />
actividad agríco<strong>la</strong>.<br />
Las diferentes productivida<strong>de</strong>s alcanzadas se <strong>de</strong>ben a <strong>la</strong>s variaciones topográficas que<br />
presenta <strong>la</strong> ubicación <strong>de</strong> <strong>la</strong>s unida<strong>de</strong>s <strong>de</strong> producción, a <strong>la</strong> diferente capacidad produc<br />
tiva <strong>de</strong> los suelos, al tiempo <strong>de</strong> <strong>de</strong>scanso y a <strong>la</strong> preparación <strong>de</strong>l terreno, ya que el cul<br />
tivo se conduce en forma tradicional, empleándose varieda<strong>de</strong>s comunes.<br />
Las productivida<strong>de</strong>s calcu<strong>la</strong>das por ONERN se muestran en el Cuadro N 0 40-DA, obser<br />
vándose que fluctúan <strong>de</strong> S/.2, ISO.00 a S/.8,000.00 por hectárea; estas diferencias<br />
se explican por <strong>la</strong>s variaciones en los rendimientos físicos y <strong>de</strong> los precióse La produc<br />
tividad promedio para el área <strong>de</strong> estudio resulta <strong>de</strong> S/.4,840 o 00 por hectárea; esta<br />
productividad es representativa para una gran proporción <strong>de</strong>l área cultivada y estaría<br />
muy cerca <strong>de</strong> los mínimos hal<strong>la</strong>dos,,<br />
(2)„ Productividad <strong>de</strong> <strong>la</strong> Mano <strong>de</strong> Obra<br />
Del total <strong>de</strong> mano <strong>de</strong> obra empleada en <strong>la</strong> actividad agríco<strong>la</strong>, el cultivo <strong>de</strong> cebada ab<br />
sorbió el 7 J%, cifra que representa 879 E.H^A., correspondiendo <strong>la</strong> mayor propor —<br />
ción <strong>de</strong> uso a Ca¡amarca y San Miguel, que <strong>de</strong>mandaron 411 y 218 E.H„A,, respectivamente.<br />
La productividad calcu<strong>la</strong>da por ONERN se muestra en el Cuadro N 0 41 -DA, observan<br />
dose que presenta variaciones extremas que osci<strong>la</strong>n entre los S/. 19,550.00 y ""<br />
SA72,730,,00 por E.HoA., Estas productivida<strong>de</strong>s tan altas se explican por el menor u<br />
so <strong>de</strong>l E.H.A. que emplea por unidad <strong>de</strong> área y que, a nivel general, resulta en promedio<br />
sólo <strong>de</strong> 0.10 E.H.A. por Ha. La mano <strong>de</strong> obra empleada en este cultivo es
DIAGNOSTICO AGROPECUARIO Pág. 4<strong>45</strong><br />
CUADRO N o 40-DA<br />
PRODUCTIVIDAD DE LA TIERRA CON EL CULTIVO DE CEBADA<br />
(1974-1975)<br />
Area Cultivada<br />
Ha„<br />
Producto<br />
Kg/Ha..<br />
Precio en Chacra<br />
S/./Kg.<br />
Productividad<br />
S/./Ha.<br />
1<br />
i<br />
0.17<br />
0.30<br />
0.50<br />
0.50<br />
0.66<br />
1.00<br />
1.00<br />
. 1.00<br />
1.00<br />
2.00<br />
410<br />
350<br />
700<br />
800<br />
690<br />
550<br />
920<br />
650<br />
430<br />
650<br />
10.0<br />
8.0<br />
7.0<br />
10.0<br />
6.0<br />
5.0<br />
10.0<br />
6.0<br />
5.0<br />
10.0<br />
4,100<br />
2,800 !<br />
4,900 |<br />
8,000 !<br />
4,140 , !<br />
2,750 .<br />
9,200 !<br />
3,900<br />
2,150<br />
6,500 _,<br />
Promedio 0.81<br />
620<br />
7.70<br />
4,840 }<br />
Fuente: Encuestas ONERN, 1975<br />
CUADRO N 0 41-DA<br />
PRODUCTIVIDAD DE LA MANO DE OBRA EN EL CULTIVO DE CEBADA<br />
(1974-1975)<br />
Area Cultivada<br />
Ha.<br />
E.H-A. (*)<br />
por Ha.<br />
Valor Bruto<br />
S/./Ha.<br />
Productividad<br />
S/./E.H.A.(*)<br />
0.17<br />
0.30<br />
0.50<br />
0.50<br />
0.66<br />
1.00<br />
1,00<br />
1.00<br />
1.00<br />
2„00<br />
0.11<br />
0.08<br />
0.09<br />
0.11<br />
0.10<br />
OJO<br />
0.15<br />
0.07<br />
OJO<br />
4,100<br />
2,800<br />
4,900<br />
8,000<br />
4,140<br />
2,750<br />
9,200<br />
3,900<br />
2,150<br />
6,500<br />
37,270<br />
35,000<br />
54,440<br />
72,730<br />
41,400<br />
27,500<br />
61,330<br />
55,710<br />
19,550<br />
65,000<br />
Promedio 0.81<br />
OJO<br />
4,840<br />
46,990<br />
(*) E.H.A. : 270 jómales por año.<br />
Fuente : Encuestas ONERN, 1975
Pág. 446<br />
ZONA NORTE DE CAJAMARCA<br />
preferentemente familiar, mientras que en <strong>la</strong>s <strong>la</strong>bores <strong>de</strong> siega y tril<strong>la</strong> se emplea mano<br />
<strong>de</strong> obra contratada en forma limitada y, en este caso, <strong>la</strong> remuneración <strong>de</strong>l trabajo se<br />
hace en producto (grano <strong>de</strong> cebada).<br />
(3). Productividad <strong>de</strong>l Capital<br />
Del total <strong>de</strong>l capital <strong>de</strong> trabajo empleado en <strong>la</strong> actividad agríco<strong>la</strong>, el cultivo <strong>de</strong> ceba<br />
da <strong>de</strong>mandó sólo el 9.9% <strong>de</strong> esa inversión y <strong>la</strong> mayor proporción correspondió al rubro<br />
<strong>de</strong> mano <strong>de</strong> obra. Respecto a su distribución, se ha <strong>de</strong>tectado que <strong>la</strong> mayor <strong>de</strong>manda<br />
tiene lugar en Cajamarca y Hualgayoc, que representan el 35.7% y el 25.7%; y en<br />
menor proporción, se usó en Santa Cruz y Cutervo, que representan sólo el 0.5% y el<br />
3.7% <strong>de</strong>l total, respectivamente. El análisis sobre el monto empleado por unidad <strong>de</strong><br />
área, ha permitido concluir que existe cierta similitud en toda <strong>la</strong> zona, explicable por<br />
<strong>la</strong> forma homogénea en que se conduce el cultivo.<br />
Los coeficientes hal<strong>la</strong>dos por ONERN se muestran en el Cuadro N 0 42-DA, observando<br />
se que osci<strong>la</strong>n entre 0.77 y 5.41. Estas cifras permiten prever que, en todos los casos,<br />
se recuperan los gastos hechos en el cultivo pero, a nivel local, se ha <strong>de</strong>tectado fun -<br />
dos don<strong>de</strong> no se recuperan <strong>la</strong>s inversiones, <strong>de</strong>bido principalmente a los ataques <strong>de</strong> ro -<br />
ya y/o a <strong>la</strong>s sequfas.<br />
CUADRO N 0<br />
42-DA<br />
COEFICIENTE DE PRODUCTIVIDAD DEL CAPITAL EN EL CULTIVO<br />
DE CEBADA<br />
(1974-1975)<br />
Area Cultivado<br />
Hao<br />
1 - 0.17<br />
0.30<br />
0.50<br />
0.50<br />
0.66<br />
1.00<br />
1.00<br />
1.00<br />
1.00<br />
| 2,00<br />
Valor Bruto<br />
S/./Ha.<br />
4,100<br />
2,800<br />
4,900<br />
4,800<br />
4,140<br />
2,750<br />
9,200<br />
3,900<br />
2,150<br />
6,500<br />
Gastos<br />
S/./Ha.<br />
2,530<br />
2,570<br />
3,780<br />
4,610<br />
2,590<br />
2,100<br />
1,790<br />
3,110<br />
2,790<br />
1,200<br />
Coeficiente <strong>de</strong><br />
Productividad |<br />
1.62<br />
1.08<br />
1.29<br />
1.73<br />
1.59<br />
1.30<br />
5.13<br />
1.25<br />
0.77 |<br />
5.41<br />
Promedio 0.81<br />
4,524<br />
2,710<br />
2.11<br />
Fuente: Encuestas ONERN, 1975
DIAGNOSTICO AGROPECUARIO Pág. 447<br />
d» Lo Productividod en el Cultivo <strong>de</strong> Arvejo<br />
(1). Productividad <strong>de</strong> <strong>la</strong> Tierra<br />
Según el Censo Agropecuario <strong>de</strong> 1972, el cultivo <strong>de</strong> arveja abarcó el 8.9% <strong>de</strong>l total<br />
<strong>de</strong>l área cultivada, siendo <strong>la</strong> mayor cantidad localizada en Cajamarca (San Pablo), Cu<br />
tervo (Cutervo), Chota (Chota, Cochabamba y Lajas) y San Miguel (San Miguel), con<br />
1,965 Ha., 1,708 Ha. y 1,155 Ha. De <strong>la</strong> extensión total, el 88.6% se conduce en<br />
secano y el 11.4% con riego; este último sistema se emplea preferentemente en Caja -<br />
marca (623 Ha.).<br />
El <strong>volumen</strong> <strong>de</strong> producción alcanzó 4,728 TM; <strong>de</strong> ese total, el 63.3% es <strong>de</strong> arveja en<br />
ver<strong>de</strong> y el 36.7% es <strong>de</strong> arveja en seco (grano). La producción está intimamente ligada<br />
a <strong>la</strong> economia <strong>de</strong> mercado, principalmente <strong>la</strong> arveja en ver<strong>de</strong>. En lo que se refiere<br />
al valor bruto <strong>de</strong> <strong>la</strong> producción, <strong>la</strong> arveja representó el 9.6% <strong>de</strong>l total; en este valor<br />
influyen los altos precios pagados por el producto, asf como los buenos rendimientos u-<br />
nitarios que se obtienen en general.<br />
La productividad <strong>de</strong> <strong>la</strong> tierra en este cultivo <strong>de</strong>pen<strong>de</strong> en gran medida <strong>de</strong> <strong>la</strong> calidad <strong>de</strong><br />
<strong>la</strong> semil<strong>la</strong>, por lo que los agricultores procuran obtener<strong>la</strong> <strong>de</strong> otros lugares y hacen una<br />
selección manual <strong>de</strong>l grano, prefiriéndose por su alto rendimiento <strong>la</strong> variedad "arveja<br />
b<strong>la</strong>nca"c Este cultivo no es abonado, pero es frecuente que rote con los cultivos <strong>de</strong><br />
papa y <strong>de</strong> trigo; los principales problemas sanitarios son <strong>de</strong> tipo fungoso que, en algu<br />
ñas áreas húmedas, tienen gran importancTa económica.<br />
Las diferencias en <strong>la</strong> productividad se <strong>de</strong>ben en parte al uso intensivo <strong>de</strong> <strong>la</strong> tierra, a <strong>la</strong><br />
proce<strong>de</strong>ncia <strong>de</strong> <strong>la</strong>s semil<strong>la</strong>s y a otros factores. La baja o pérdida <strong>de</strong> producción en este<br />
cultivo no tiene <strong>la</strong> trascen<strong>de</strong>ncia que tiene <strong>la</strong> papa ni el mafz; sin embargo, por los in<br />
gresos monetarios que genera, se le consi<strong>de</strong>ra <strong>de</strong> apoyo para <strong>la</strong> producción <strong>de</strong> otras es -<br />
pecies, vigorizando el ingreso familiar y enriqueciendo <strong>la</strong> dieta humana. Por otro <strong>la</strong> -<br />
do, el rastrojo se usa como forraje y, adicionalmente, el cultivo beneficia al suelo por<br />
su cualidad nitrificante.<br />
Las productivida<strong>de</strong>s que se muestran en el Cuadro N 0 43-DA correspon<strong>de</strong>n al cultivo <strong>de</strong><br />
arveja en seco, presentando variaciones <strong>de</strong> S/,,2,,5200 00 a S/.l 1,400
PSg. 448<br />
ZONA NORTE DE CAJAMARCA<br />
(27.2% <strong>de</strong>l total). La mano <strong>de</strong> obra usada para <strong>la</strong> mayorfa <strong>de</strong> <strong>la</strong>s <strong>la</strong>bores es preferente<br />
mente familiar, excepto durante <strong>la</strong>s cosechas, en <strong>la</strong> que es frecuente contratar mujeres<br />
y menores para realizar <strong>la</strong> "paña en ver<strong>de</strong>".<br />
CUADRO N 0 43-DA<br />
PRODUCTIVIDAD DE LA TIERRA CON EL CULTIVO DE ARVEJA GRANO<br />
SECO<br />
(1974-1975)<br />
I Area Cultivado<br />
| Ha. .<br />
Producto<br />
Kg/Ha.<br />
Precio en Chacra<br />
S/.Ag.<br />
Productividad<br />
SA/Ha.<br />
j<br />
OJO<br />
1 0.20<br />
j 0.25<br />
0.38<br />
0.<strong>45</strong><br />
\ 0.48<br />
0.50<br />
• 0.50<br />
i 0.50<br />
j 0.50<br />
I 0.60<br />
j 1.00<br />
1.00<br />
; LOO<br />
| 1.00<br />
1.00<br />
300<br />
500<br />
250<br />
400<br />
410<br />
<strong>45</strong>0<br />
360<br />
300<br />
380<br />
350<br />
400<br />
380<br />
310<br />
300<br />
340<br />
500<br />
20,00<br />
20.00<br />
15.00<br />
9.00<br />
10.00<br />
10.00<br />
7.00<br />
10.00<br />
30.00<br />
10.00<br />
20.00<br />
10„00<br />
15.00<br />
20.00<br />
15.00<br />
10.00<br />
6,000<br />
10,000<br />
3,750<br />
3,600<br />
4,100<br />
4,500<br />
2,520<br />
3,000<br />
11,400<br />
3,500<br />
8,000<br />
3,800<br />
4,650<br />
6,000<br />
5,100<br />
5,000<br />
Promedio 0.59<br />
S<br />
Fuente: Encuestas ONERN, 1975<br />
370<br />
14.40<br />
5,310<br />
Los niveles <strong>de</strong> productividad <strong>de</strong>tectados por ONERN se muestran en el Cuadro N" 44-<br />
DA, observándose variaciones <strong>de</strong> S/.11,<strong>45</strong>0.00 a S/.95,000.00 por E.hLA. A nivel<br />
<strong>de</strong> área, resulta un promedio <strong>de</strong> SA<strong>45</strong>,440.00 por E^H.A. Las altas productivida<strong>de</strong>s<br />
se explican por el linvtado uso <strong>de</strong>l equivalente hombre/año por hectárea que, en promedio,<br />
resultan sólo 0.12 EcH.A. por hectárea; <strong>de</strong> esto se <strong>de</strong>duce que es factible ha<br />
cer el cultivo con poca mano <strong>de</strong> obra, lo que es una ventaja^ sobre todo en áreas en<br />
<strong>la</strong> que su disponibilidad es limitada o su contratación resulta diffcíL<br />
(3). Productividad <strong>de</strong>l Capital<br />
El cultivo <strong>de</strong> arveja <strong>de</strong>mandó el 8.4% <strong>de</strong>l total <strong>de</strong>l capital <strong>de</strong> trabajo empleado en <strong>la</strong><br />
actividad agríco<strong>la</strong>, correspondiendo <strong>la</strong> mayor proporción <strong>de</strong>l gasto al rubro <strong>de</strong> <strong>la</strong> mano<br />
<strong>de</strong> obra; respecto a su distribución en el área, se ha <strong>de</strong>tectado, que ese capital se usa
DIAGNOSTICO AGROPECUARIO Pág. 449<br />
preferentemente en los subsectores <strong>de</strong> Cajamarca y Cutervo, que representan el 26.8%<br />
y el 25^8% <strong>de</strong>l total, respectivamente. El análisis sobre el monto erapleado por uni -<br />
dad <strong>de</strong> área ha permitido concluir que existe cierta similitud en toda <strong>la</strong> zona <strong>de</strong> estu -<br />
dio.<br />
CUADRO NT 44-DA<br />
PRODUCTIVIDAD DE LA MANO DE OBRA EN EL CULTIVO DE ARVEJA GRANO<br />
SECO<br />
(1974-1975)<br />
Area Cultivada<br />
Ha,<br />
E.H.A. (*)<br />
por Ha.<br />
Valor Bruto<br />
S/./Ha.<br />
Productividad j<br />
S/./E.H.A.(*) ;<br />
OJO<br />
0.20<br />
0.25<br />
0.38<br />
0.<strong>45</strong><br />
0.48<br />
0.50<br />
0.50<br />
0.50<br />
0.50<br />
0.60<br />
1.00<br />
1.00<br />
1.00<br />
1,00<br />
1.00<br />
Promedio 0.59<br />
0.20<br />
0.16<br />
0.07<br />
0.17<br />
0.11<br />
0.10<br />
0.22<br />
0.14<br />
0.12<br />
0J1<br />
0.16<br />
0,09<br />
0.09<br />
0.11<br />
0.08<br />
0.09<br />
1 0.12<br />
1<br />
(*) E.II.A. : 270 jornales año.<br />
Fuente : Encuestas ONERN, 1975<br />
6,000<br />
10,000<br />
3,750<br />
3,600<br />
4,100<br />
4,500<br />
2,520<br />
3,000<br />
11,400<br />
3,500<br />
8,000<br />
3,800<br />
4,650<br />
6,000<br />
5J00<br />
5,000<br />
5,310<br />
39,000 i<br />
62,500 1<br />
53,570 ¡<br />
21,180 i<br />
37,270<br />
<strong>45</strong>,000 |<br />
11,<strong>45</strong>0 I<br />
21,430<br />
95,000<br />
31,320 ¡<br />
50,000<br />
42,220<br />
51,670<br />
54,550 :<br />
63,750<br />
55,560<br />
<strong>45</strong>,440<br />
Los coeficientes hal<strong>la</strong>dos por ONERN se muestran en el Cuadro N 0 <strong>45</strong>-DA, observárido<br />
se que osci<strong>la</strong>n <strong>de</strong> 0.73 a 2.98. Estas cifras permiten prever que, en todos los casos,se<br />
recupera <strong>la</strong> inversión; sin embargo, a nivel <strong>de</strong> subsectores, hay variación, lo mismo<br />
que <strong>de</strong> una campaña agríco<strong>la</strong> a otra. La posibilidad <strong>de</strong> pérdida, sin embargo, tiene<br />
una significación limitada, ya que los gastos que <strong>de</strong>manda el cultivo son reducidos y,<br />
en <strong>la</strong> generalidad <strong>de</strong> los casos, es un riesgo que el agricultor está dispuesto a aceptar.
Pág. <strong>45</strong>0<br />
ZONA NORTE DE CAJAMARCA<br />
CUADRO N 0 <strong>45</strong>-DA<br />
COEFICIENTE DE PRODUCTIVIDAD DEL CAPITAL EN EL CULTIVO DE ARVEJA GRANO<br />
SECO<br />
(1974-1975)<br />
_—.<br />
Area<br />
Cultivada<br />
Ha o<br />
OJO<br />
0,20<br />
0.25<br />
0,38<br />
0.<strong>45</strong><br />
0o48<br />
0„50<br />
0.50<br />
0 o 50<br />
0,50<br />
0.60<br />
loOO<br />
KOO<br />
l o 00<br />
loOO<br />
K00<br />
Valor Bruto<br />
S/ 0 /Ha 0<br />
6,000<br />
10,000<br />
3,750<br />
3,600<br />
4,100<br />
4,500<br />
2,520<br />
3,000<br />
11,400<br />
3,500<br />
8,000<br />
3,800<br />
4,650<br />
6,000<br />
5,100<br />
5,000<br />
Gasto<br />
S/o/Ha o<br />
6,950<br />
5,000<br />
2,240<br />
3,540<br />
3,120<br />
4,540<br />
2,170<br />
3,560<br />
3,820<br />
4,230<br />
7,620<br />
3,930<br />
3,800<br />
5,990<br />
2,870<br />
6,850<br />
Coeficiente i<br />
Productividad ¡<br />
0o86<br />
2,00<br />
1.67<br />
1,02<br />
1.31<br />
0.99<br />
1.16<br />
0.84<br />
2.98<br />
0.83<br />
1.05<br />
0.97<br />
1.22<br />
1.00<br />
1,78<br />
0,73<br />
1- ^r.edio 0o59<br />
Er
DIAGNOSTICO AGROPECUARIO Pág. <strong>45</strong>1<br />
tema, seña<strong>la</strong>ndo <strong>la</strong>s posibles soluciones y medidas que es necesario adoptar a corto y media<br />
no p<strong>la</strong>zo para incentivar <strong>la</strong> producción, satisfacer <strong>la</strong>s necesida<strong>de</strong>s <strong>de</strong> consumo y motivar <strong>la</strong><br />
participación justa <strong>de</strong> los agentes que intervienen en esta actividad.<br />
La comercialización <strong>de</strong> los productos agropecuarios regionales se en<br />
cuentran influenciadas, principalmente, por <strong>la</strong>s <strong>de</strong>cisiones <strong>de</strong> merca<strong>de</strong>o <strong>de</strong> los centros urba<br />
nos <strong>de</strong> Chic<strong>la</strong>yo, Trujillo, <strong>la</strong>s cooperativas agrarias <strong>de</strong> producción azucarera <strong>de</strong>l Norte <strong>de</strong>l<br />
pais y el gran mercado metropolitano <strong>de</strong> Lima-Cal<strong>la</strong>o. En menor proporción, inci<strong>de</strong>n los<br />
mercados <strong>de</strong> Contumazá, Cajamarca, Hualgayoc, Bambamarca, Chota y Cutervo. Actualmente,<br />
los mercados <strong>de</strong> Trujillo y Chic<strong>la</strong>yo actúan como centros <strong>de</strong> redistribución <strong>de</strong> los pro<br />
ductos en <strong>la</strong> Costa Norte <strong>de</strong>l país y <strong>de</strong> nexo para el abastecimiento regional <strong>de</strong> los que pro<br />
vienen <strong>de</strong> <strong>la</strong> Costa.<br />
Los principales productos agropecuarios con capacidad comercial son<br />
el ganado vacuno, ovino y porcino, <strong>la</strong> papa, el mafz, <strong>la</strong> arveja ver<strong>de</strong> (hortaliza), el arroz<br />
y los productos <strong>de</strong>rivados <strong>de</strong> <strong>la</strong> leche (mantequil<strong>la</strong> y queso). La mayorfa <strong>de</strong> estos artículos<br />
son vendidos, a nivel <strong>de</strong> productor, sin procesamiento ni preparación comercial. Los com<br />
pradores intermediarios son los agentes que realizan esta <strong>la</strong>bor y constituyen <strong>la</strong> base <strong>de</strong> u<br />
na estructura socioeconómica que hace usufructo <strong>de</strong>l valor agregado que logra el producto<br />
al prepararse, procesarse y tras<strong>la</strong>darse a los centros <strong>de</strong> consumo, siendo los productores y •<br />
consumidores seriamente afectados por estos agentes, que actúan con evi<strong>de</strong>nte criterio mercantil<br />
„<br />
La participación <strong>de</strong>l Estado para adaptar el proceso a <strong>la</strong>s caractensticas<br />
económicas y sociales <strong>de</strong> <strong>la</strong> región es sumamente lenta y <strong>de</strong>scoordinada, influyendo en<br />
esta situación <strong>la</strong>s difíciles caracterfsticas topográficas <strong>de</strong> <strong>la</strong> región, que <strong>de</strong>sinregran el ámbito<br />
socioeconómico y limita <strong>la</strong> participación <strong>de</strong> los agricultores en el proceso comercial <strong>de</strong><br />
los productos regionales„ Asimismo, el bajo grado cultural <strong>de</strong> los productores y el tradicionalismo<br />
imperante, facilita el continuismo <strong>de</strong> patrones y costumbres <strong>de</strong> merca<strong>de</strong>o, así como<br />
un arcaico sistema <strong>de</strong> pesas y medidas superadas por <strong>la</strong>s normas actuales <strong>de</strong> comercialización.<br />
a o Estructura Socioeconómica <strong>de</strong> Comercialización<br />
La producción, comercialización y consumo representan activida<strong>de</strong>s<br />
básicas <strong>de</strong> <strong>la</strong> economía y constituyen parte <strong>de</strong> una estructura adaptada a los usos y costum -<br />
bres tradicionales <strong>de</strong> <strong>la</strong>s comunida<strong>de</strong>s, a su grado cultural y a <strong>la</strong> orientación i<strong>de</strong>opolftica<br />
que le imprimen los gobiernos.<br />
La estructura <strong>de</strong> producción agraria en el pafs fue modificada por el<br />
D.L. N 0 17716, el que sustituyó los regímenes <strong>de</strong>l <strong>la</strong>tifundio y minifundio por un sistema <strong>de</strong><br />
trabajo <strong>de</strong> <strong>la</strong> tierra a través <strong>de</strong> organizaciones asociativas <strong>de</strong> campesinos y por <strong>la</strong> conduc -<br />
ción directa <strong>de</strong> una pequeña y mediana agricultura consolidada. Estas reformas han permití<br />
do un mayor ingreso económico en <strong>la</strong> pob<strong>la</strong>ción <strong>de</strong>l sector agrario y han provocado, a <strong>la</strong> vez,<br />
variaciones en los hábitos <strong>de</strong> consumo <strong>de</strong> <strong>la</strong>s socieda<strong>de</strong>s integrantes. Sin embargo, en <strong>la</strong> es
PdCT. <strong>45</strong>2<br />
ZONA<br />
NORTE DE CAJAMARCA<br />
tructura <strong>de</strong> comercialización no se ha producido modificaciones sustanciales, operando <strong>la</strong><br />
tradicional, basada en comerciantes intermediarios que no logran adaptarse al nuevo sistema<br />
<strong>de</strong> producción ni a los requerimientos, cada vez más exigentes, <strong>de</strong> los mercados <strong>de</strong> con<br />
sumo»<br />
La comercialización, en el ámbito estudiado, muestra una fuerte <strong>de</strong><br />
pen<strong>de</strong>ncia <strong>de</strong> los campesinos productores hacia los comerciantes intermediarios, como consecuencia<br />
<strong>de</strong> <strong>la</strong> baja capacidad económica <strong>de</strong> <strong>la</strong> mayorfa <strong>de</strong> los productores y <strong>la</strong> carencia<br />
<strong>de</strong> instituciones y organizaciones que los orienten en forma a<strong>de</strong>cuada En esta forma, los<br />
volúmenes ofertados a través <strong>de</strong>l proceso <strong>de</strong> comercialización quedan en manos <strong>de</strong> comer -<br />
ciantes intermediarios que actuando con evi<strong>de</strong>nte criterio mercantil, someten a los agricultores<br />
a sus requerimientos especu<strong>la</strong>tivos.<br />
De acuerdo a su capacidad económica, los agentes <strong>de</strong> comercializa<br />
ción operan en <strong>la</strong> zona bajo tres modalida<strong>de</strong>s a<br />
(1). Comerciantes mayoristas, l<strong>la</strong>mados también "<strong>de</strong> Costa", que cuentan con gran<strong>de</strong>s recur<br />
sos económicos y que, normalmente, disponen <strong>de</strong> sus propios medios <strong>de</strong> transporte, lo<br />
que les confiere una gran ventaja y una posición <strong>de</strong> predominio en <strong>la</strong> comercialización<br />
en <strong>la</strong> zona* Se estima que este tipo <strong>de</strong> comerciantes capta el 60% <strong>de</strong> <strong>la</strong> producciónco<br />
mercial agropecuaria, entre ellos existe un pequeño grupo que no dispone <strong>de</strong> transporte<br />
propio y operan con un 10% <strong>de</strong> <strong>la</strong> disponibilidad comercial <strong>de</strong> <strong>la</strong> zona.<br />
(2)„ Comerciantes intermediarios, que cuentan con menor disponibilidad económica / que<br />
operan directamente en <strong>la</strong>s chacras o en los <strong>de</strong>pósitos domiciliarios insta<strong>la</strong>dos al bor<strong>de</strong><br />
<strong>de</strong> <strong>la</strong>s carreteras o en ios centros urbanos <strong>de</strong> <strong>la</strong> región„ En este caso, realizan opera -<br />
clones <strong>de</strong> compra-venta <strong>de</strong> productos regionales y abastecen a <strong>la</strong> comunidad con produc<br />
tos alimenticios y <strong>de</strong> primera necesidad El comerciante intermediario participa por su<br />
cuenta y capta, según estirraciones, un 25% <strong>de</strong>l valor comercial <strong>de</strong> <strong>la</strong> producción <strong>de</strong><br />
<strong>la</strong> zona»<br />
(3) E! productor que participa en <strong>la</strong> comercialización directa con los mercados <strong>de</strong> consumo,<br />
aunque en forma muy restringida, estimándose que estas operaciones alcanzan escasa -<br />
mente al 5% <strong>de</strong> <strong>la</strong> disponibilidad comercial. El mayor <strong>volumen</strong> <strong>de</strong> este canal está o<br />
rientado a los mercados <strong>de</strong> <strong>la</strong> región»<br />
El agricultor normalmente interviene en el proceso en forma personal, siendo su partici<br />
pación caracterizada por <strong>la</strong> <strong>de</strong>sorganización en <strong>la</strong>s acciones comerciales, el <strong>de</strong>sconocí<br />
miento <strong>de</strong> <strong>la</strong> situación <strong>de</strong> los mercados y el limitado apoyo estatal para proporcionarles<br />
servicios que los oriente eficienferr.eníe, notándose, por otro <strong>la</strong>do¡, <strong>la</strong> falta <strong>de</strong> empresas<br />
asociativas, a través <strong>de</strong> <strong>la</strong>s cuales pue<strong>de</strong>n encausar sus operaciones, as' como <strong>de</strong> ins<br />
tituciones que realicen acciones efectivas y coordinadas para solucionar los problemas<br />
<strong>de</strong> comercialización en <strong>la</strong> zona, a pesar <strong>de</strong> que existe una infraestructura legal que fa<br />
cilita, apoya y estimu<strong>la</strong> <strong>la</strong> creación <strong>de</strong> estas organizaciones„ Esto motiva <strong>la</strong> necesidad<br />
<strong>de</strong> implementar a<strong>de</strong>cuadamente al Ministerio <strong>de</strong> Agricultura, para que pueda cumplir<br />
con los objetivos <strong>de</strong>l Art. 6 o <strong>de</strong>l D.L. N o 21022, <strong>de</strong>l 17 <strong>de</strong> Diciembre <strong>de</strong> 1974„ Sinem<br />
bargo, actualmente se realizan intentos ais<strong>la</strong>dos con el objeto <strong>de</strong> solucionar este proble
DIAGNOSTICO AGROPECUARIO Pág. <strong>45</strong>3<br />
jma, a través <strong>de</strong> <strong>la</strong> Subdirección <strong>de</strong> Producción y Comercialización Agraria, <strong>la</strong> que<br />
encuentra en trámite administrativo para integrarse al Ministerio <strong>de</strong> Alimentación,<br />
concordancia con el DA» N" 21<strong>03</strong>3, <strong>de</strong>l 23 <strong>de</strong> Diciembre <strong>de</strong> 1974.<br />
se<br />
en<br />
bo<br />
Oferta Aparente<br />
El mayor <strong>volumen</strong> comercial <strong>de</strong> <strong>la</strong> producción zonal se oferta a los<br />
mercados inci<strong>de</strong>ntes a través <strong>de</strong> comerciantes mayoristas e intermediarios. Un alto porcenta<br />
je se <strong>de</strong>stina al autoconsumo <strong>de</strong> <strong>la</strong> pob<strong>la</strong>ción rural, utilizándose pequeñas reservas como se<br />
mil<strong>la</strong>s para <strong>la</strong>s próximas campañas» En el Cuadro N 0 4ó-DA, se muestra <strong>la</strong>s ofertas aparen"<br />
tes <strong>de</strong> los principales productos, re<strong>la</strong>cionándolos con <strong>la</strong> oferta nacional para <strong>de</strong>terminar su<br />
participación en el proceso <strong>de</strong> corns rcializacióno<br />
c o Mercado<br />
(1). Principales Centros <strong>de</strong> Consumo<br />
Los sectores <strong>de</strong>l área en estudio se encuentran unidos entre sí y con sus principales mer<br />
cados mediante <strong>la</strong>s carreteras <strong>de</strong> penetración que parten <strong>de</strong> <strong>la</strong> Carretera Panamericana<br />
Norte., En esta forma, se facilita <strong>la</strong> distribución <strong>de</strong> los productos regionales y el ingre<br />
so <strong>de</strong> productos para el abastecimiento local, con <strong>la</strong>s limitaciones que impone <strong>la</strong> diffcil<br />
configuración topográfica <strong>de</strong> <strong>la</strong> sierra„<br />
Los principales mercados, <strong>de</strong> acuerdo a <strong>la</strong> inci<strong>de</strong>ncia <strong>de</strong> <strong>la</strong> producción agropecuaria,<br />
son:<br />
(a), Mercado Metropolitano <strong>de</strong> Lima-Cal<strong>la</strong>o, principalmente para <strong>la</strong> producción gana<strong>de</strong>ra<br />
<strong>de</strong> carne, <strong>de</strong>rivados <strong>de</strong> <strong>la</strong> producción lechera y <strong>la</strong> provisión <strong>de</strong> arveja ver<strong>de</strong><br />
(hortaliza) o<br />
(b). Mercado <strong>de</strong> Chic<strong>la</strong>yo, para <strong>la</strong> producción <strong>de</strong> carnes, papas, mafz, arveja ver<strong>de</strong><br />
(hortaliza), choclos y algunas menestras y cereales.<br />
(c). Mercado <strong>de</strong> Trujillo, principalmente para <strong>la</strong> producción <strong>de</strong> carnes, papas, mafz ,<br />
arveja ver<strong>de</strong> (hortaliza) y algunas menestras y cereales„<br />
(d). Mercado <strong>de</strong> <strong>la</strong>s cooperativas agrarias <strong>de</strong> producción azucareras <strong>de</strong> los <strong>de</strong>partamentos<br />
<strong>de</strong> Lambayéque y La Libertad, para <strong>la</strong> captación <strong>de</strong> carnes, papas, cereales y<br />
<strong>de</strong>rivados <strong>de</strong> <strong>la</strong> producción lechera.<br />
(e)^ Mercado Regional, constituido principalmente por Cajama rea, Contumazá, Hualga<br />
yoc, Bambamarca, Chota, Cutervo y otros centros pob<strong>la</strong>dos <strong>de</strong> menor importancia,<br />
para <strong>la</strong> provisión <strong>de</strong> diversos productos regionales.
"O<br />
CUADRO N"46-DA<br />
qq<br />
en<br />
OFERTA A PÁRENTE DE LOS PRINCIPALES PRODUCTOS AGROPECUARIOS POR SECTORES<br />
(1974-1975><br />
Prbduetcfe<br />
Cuteiiyo<br />
Chpta<br />
Sector I<br />
Santa Cruz<br />
O f«rt a A patente en 1 •, M,<br />
Sector II<br />
Hualgayoc Gajamarca San Miguel<br />
Cpntumazá<br />
Participación en <strong>la</strong> O ferta Nací onal<br />
Total Regional<br />
T.M.<br />
1<br />
Nacional (1)<br />
T.M.<br />
lo<br />
Papa<br />
Cebada<br />
Mafz<br />
Trigo<br />
Arveja ver<strong>de</strong><br />
Arroz<br />
Olluco<br />
Frijol<br />
Leche<br />
3,790<br />
232<br />
3,365<br />
5<br />
412<br />
6<br />
118<br />
70<br />
2,885<br />
10,810<br />
776<br />
3,855<br />
34<br />
367<br />
-<br />
1,092<br />
19<br />
2,299<br />
800<br />
29<br />
540<br />
2<br />
-<br />
-<br />
22<br />
2<br />
<strong>45</strong>9<br />
' 1,4, 825<br />
1,630<br />
2,680<br />
53<br />
112<br />
-<br />
1,624<br />
10<br />
1,509<br />
7,155<br />
2,221<br />
1,578<br />
»20<br />
1,218<br />
471<br />
1,356<br />
40<br />
3,896<br />
6,210<br />
1,176<br />
1,006<br />
430<br />
131<br />
825<br />
608<br />
21<br />
2,598<br />
1,080<br />
269<br />
335<br />
536<br />
29<br />
927<br />
48<br />
13<br />
630<br />
44,670<br />
6,333<br />
13,359<br />
1,880<br />
2,269<br />
2,229<br />
4,868<br />
175<br />
14,276<br />
l'ffl3,QQQ ( )<br />
168,818(2)<br />
509,000(3)<br />
142,000<br />
31,822(2)<br />
504,000<br />
65,529(2)<br />
40,000<br />
600,822<br />
2.6<br />
4.0<br />
2.6<br />
1.3<br />
7,1<br />
0.1<br />
7.4<br />
0.1<br />
2.4<br />
Carnes :<br />
•f<br />
Vacuno<br />
Ovino<br />
Porcino<br />
907<br />
47<br />
169<br />
830<br />
57<br />
165<br />
' 172<br />
fuente: (1) Ministerio <strong>de</strong> Alimentación - Programa Nacional <strong>de</strong> Producción 1975-1976.<br />
(2) Ministerio <strong>de</strong> Agricultura - Estadística Agraria - Perú 1969-1970-1971.<br />
(3) Incluye maíz amarillo y amiláceo.<br />
ONERN.<br />
5<br />
20<br />
733<br />
62<br />
154<br />
875<br />
102<br />
110<br />
1,060<br />
69<br />
99<br />
381<br />
70<br />
44<br />
4,958<br />
412<br />
761<br />
77, 930<br />
22,000<br />
60,611<br />
6.4<br />
1.9<br />
1.3<br />
N<br />
O<br />
z<br />
><br />
o<br />
H<br />
m<br />
O<br />
m<br />
n<br />
><br />
«—i<br />
>
DIAGNOSTICO AGROPECUARIO Pág. <strong>45</strong>5<br />
(2).. Demando Anual <strong>de</strong> los Principales Productos Alimenticios<br />
De acuerdo con <strong>la</strong>s informaciones <strong>de</strong> <strong>la</strong> Encuesta Nacional <strong>de</strong> Consumo <strong>de</strong> Alimentos<br />
(ENCA) y <strong>de</strong> <strong>la</strong> Oficina Nacional <strong>de</strong> Estadística y Censos (ONEC), se han estimado<br />
<strong>la</strong>s necesida<strong>de</strong>s <strong>de</strong> abastecimiento <strong>de</strong> <strong>la</strong> zona estudiada referida al año 1972 y a losprin<br />
cipales productos alimenticios básicos. Con apoyo <strong>de</strong> <strong>la</strong>s tasas geométricas anuales <strong>de</strong><br />
crecimiento <strong>de</strong> <strong>la</strong> <strong>de</strong>manda interna, obtenidas <strong>de</strong>l estudio <strong>de</strong> "Proyecciones a <strong>la</strong>rgo pía<br />
zo <strong>de</strong> <strong>la</strong> Oferta y <strong>la</strong> Demanda <strong>de</strong> Productos Agropecuarios Seleccionados'*, han ri-srdc<br />
proyectadas <strong>la</strong>s <strong>de</strong>mandas .<strong>de</strong>l año 1972al año "1980, tal como se muestra en el Cuadro<br />
N 0 47-DAo Las <strong>de</strong>mandas estimadas, a<strong>de</strong>más <strong>de</strong> <strong>la</strong>s adquisiciones comerciales, in<br />
cluyen el autoconsumo y los productos obtenidos ya sea por trueque o por regalos,<br />
CUADRO N 0 47-DA<br />
DEMANDA ANUAL DE LOS PRINCIPALES PRODUCTOS ALIMENTICIOS<br />
Y SU PROYECCIÓN A 1980<br />
Productos<br />
Demanda Anual (TM)<br />
1972<br />
1980<br />
Papa<br />
Maíz<br />
Azúcar<br />
Arroz<br />
Choclo<br />
Trigo<br />
Frijol<br />
Aceite y grasas<br />
Carne <strong>de</strong> ovino<br />
Carne <strong>de</strong> vacuno<br />
Carne <strong>de</strong> porcino<br />
Carne <strong>de</strong> aves<br />
Huevos<br />
Leche fluida<br />
38,100<br />
10,7<strong>45</strong><br />
6,895<br />
6,100<br />
4,225<br />
4,025<br />
2,100<br />
2,067<br />
1,340<br />
875<br />
605<br />
520<br />
840<br />
5,395<br />
49,880<br />
16,885<br />
10,1//<br />
9,586<br />
6,460<br />
6,325<br />
2,933<br />
3,<strong>45</strong>0<br />
2,095<br />
1,297<br />
946<br />
813<br />
1,543<br />
8,787<br />
Fuente : - Encuesta Nacional <strong>de</strong> Consumo <strong>de</strong> Alimentos-<br />
Zona Norte - Ministerio <strong>de</strong> Agricultura, 1974.<br />
VII Censo Nacional <strong>de</strong> Pob<strong>la</strong>ción; II Censo <strong>de</strong><br />
Vivienda, Dpto. Cajamarca - Oficina Nació -<br />
nal <strong>de</strong> Estadística y Censos, 1974.<br />
Proyecciones a <strong>la</strong>rgo p<strong>la</strong>zo <strong>de</strong> <strong>la</strong> Oferta y <strong>la</strong>Dg<br />
manda <strong>de</strong> Productos Agropecuarios Selecciona'<br />
dos, CONESCAR, 1969.
PSg. <strong>45</strong>6 ZONA NORTE DE CAJAMARCA<br />
(3).. Abastecimiento <strong>de</strong> Productos Alimenticios e Insumes<br />
Los requerimientos necesarios para satisfacer <strong>la</strong>s necesida<strong>de</strong>s <strong>de</strong> <strong>la</strong> pob<strong>la</strong>ción <strong>de</strong> <strong>la</strong> zona,<br />
están referidos al abastecimiento <strong>de</strong> los productos alimenticios básicos y a <strong>la</strong> provi<br />
sión <strong>de</strong> los insumos indispensables para <strong>la</strong> producción agropecuaria„<br />
(a)„ Abastecimiento <strong>de</strong> Productos Alimenticios Básicos<br />
Los productos alimenticios <strong>de</strong>stinados al consumo <strong>de</strong> <strong>la</strong> pob<strong>la</strong>ción son contro<strong>la</strong>dos<br />
en precio y calidad por <strong>la</strong>s inspecciones <strong>de</strong> subsistencias, mercados, camales y pe<br />
sas y medidas <strong>de</strong> los concejos municipales» Algunos <strong>de</strong> ellos también ejercen una<br />
acción regu<strong>la</strong>dora en los volúmenes <strong>de</strong> <strong>la</strong> <strong>de</strong>manda, a través <strong>de</strong> puestos municipa<br />
les que abastecen a <strong>la</strong>s áreas bajo su jurisdicción.<br />
Los mercados locales <strong>de</strong> consumo se proveen <strong>de</strong> tubérculos, cereales, menestras ,<br />
carnes, leche y algo <strong>de</strong> arroz <strong>de</strong> <strong>la</strong> producción regional. Los déficits ocasiona -<br />
les son cubiertos con <strong>la</strong> producción <strong>de</strong> los valles <strong>de</strong> los <strong>de</strong>partamentos <strong>de</strong> La Liber<br />
tad y Lambayeque o <strong>de</strong> <strong>la</strong> redistribución <strong>de</strong> productos que tiene su origen en los<br />
mercados <strong>de</strong> Trujillo y Chic<strong>la</strong>yo, tal es el caso <strong>de</strong>l arroz, el azúcar, <strong>la</strong>s verduras<br />
y los productos pesqueros.<br />
La función <strong>de</strong> abastecimiento regional se lleva a cabo mediante los mercados municipales<br />
<strong>de</strong> Contumazá, <strong>de</strong> Hualgayoc, <strong>de</strong> Bambamarca, <strong>de</strong> Chota, <strong>de</strong> Cutervo ,<br />
<strong>de</strong> San Miguel, <strong>de</strong> San Pablo y <strong>de</strong> los <strong>de</strong>más distritos vecinos. En <strong>la</strong> periferia <strong>de</strong><br />
estos mercados, se genera un comercio ambu<strong>la</strong>torio, particu<strong>la</strong>rmente los días <strong>de</strong> ce<br />
lebración <strong>de</strong> p<strong>la</strong>zas o ferias agropecuarias, <strong>la</strong>s que dificultan <strong>la</strong>s <strong>la</strong>bores municipa<br />
les y el tránsito vehicu<strong>la</strong>r, mostrando <strong>la</strong>s <strong>de</strong>ficiencias en <strong>la</strong> dimensión <strong>de</strong> sus insta<br />
lociones para prestar un buen servicio a <strong>la</strong> comunidad,,<br />
El tipo <strong>de</strong> administración délos mercados varia <strong>de</strong> una localidad a otra. Contuma<br />
maza y Chota, por ejemplo, operan bajo el sistema <strong>de</strong> administración por rematistas<br />
y Bambamarca, bajo <strong>la</strong> tradicional administración municipal. No existen normas<br />
especiTicas que dispongan regímenes uniformes <strong>de</strong> administración <strong>de</strong> mercados.<br />
En conclusión, el sistema <strong>de</strong> merca<strong>de</strong>o imperante en el medio es <strong>de</strong>ficiente por <strong>la</strong><br />
localización, insta<strong>la</strong>ción, funcionamiento y servicio <strong>de</strong> los mercados. Las condiciones<br />
sanitarias no reúnen los requerimientos higiénicos necesarios y los regime -<br />
nes administrativos han permitido <strong>la</strong> proliferación <strong>de</strong> una pob<strong>la</strong>ción flotante <strong>de</strong> co<br />
merciantes ambu<strong>la</strong>ntes en los principales centros urbanos <strong>de</strong> <strong>la</strong> región.<br />
(b). Abastecimiento <strong>de</strong> Insumos<br />
La provisión <strong>de</strong> fertilizantes, pestici<strong>de</strong>s y semil<strong>la</strong>s, según los estimados <strong>de</strong> ONERN<br />
para <strong>la</strong> campaña 1974-75, alcanzó aproximadamente a 15,300 TM., con un valor<br />
<strong>de</strong> S/.108 , 392,000« i 00. Estos productos se adquirieron en <strong>la</strong>s sucursales y distribuí<br />
doras <strong>de</strong> Trujillo, Chic<strong>la</strong>yo, Pacasmayo y, en algunos casos, <strong>de</strong> <strong>la</strong>s redistribuidoras<br />
locales. En Bambamarca, adícionalmente, opera una cooperativa <strong>de</strong> servicios.
DIAGNOSTICO AGROPECUARIO Pág. <strong>45</strong>7<br />
cuyo reconocimiento se encuentra en trámite. Espeaficomente, en <strong>la</strong> provisión <strong>de</strong><br />
semil<strong>la</strong> <strong>de</strong> arroz interviene \a Empresa Pública <strong>de</strong> Servicios Agropecuarios (EPSA)<br />
<strong>de</strong> Pacasmayo y, en el abastecimiento <strong>de</strong> semil<strong>la</strong> <strong>de</strong> papa, participa el Ministerio<br />
<strong>de</strong> Agricultura, a través <strong>de</strong> los semilleros oficializados <strong>de</strong> <strong>la</strong> región, sin llegar a<br />
cubrir <strong>la</strong>s <strong>de</strong>mandas que tienen estos insumes en <strong>la</strong> zona.<br />
La comercialización <strong>de</strong> los insumes agropecuarios <strong>de</strong>ntro <strong>de</strong>l ámbito regional seen<br />
cuentra en manos <strong>de</strong> <strong>la</strong> empresa privada y, generalmente, el abastecimiento <strong>de</strong>peñ<br />
<strong>de</strong> <strong>de</strong> <strong>la</strong>s <strong>de</strong>cisiones que se toman fuera <strong>de</strong> <strong>la</strong> región. La participación estatal en<br />
este sector es sumamente lenta y no tiene <strong>la</strong> trascen<strong>de</strong>ncia que merece»<br />
d. Acciones y Servicios <strong>de</strong> Comercialización.<br />
Las acciones programadas por el Ministerio <strong>de</strong> Agricultura para prestar<br />
servicios al proceso <strong>de</strong> comercialización son llevadas a cabo por <strong>la</strong>s Unida<strong>de</strong>s <strong>de</strong> Producción<br />
y Comercialización <strong>de</strong> <strong>la</strong>s Oficinas Agrarias <strong>de</strong> Chepén,, Chota y Cajamarca, pertenecien -<br />
tes a <strong>la</strong> Zona Agraria ll 0 De conformidad con <strong>la</strong>s disposiciones <strong>de</strong>l D.L» N 0 21<strong>03</strong>3,. <strong>de</strong>l 23<br />
<strong>de</strong> Diciembre <strong>de</strong> 1974, estas unida<strong>de</strong>s <strong>de</strong>ben integrarse al Ministerio <strong>de</strong> Alimentación^ <strong>de</strong>ntro<br />
<strong>de</strong>l marco <strong>de</strong> una Dirección Zonal.<br />
En <strong>la</strong> zona^ existe un servicio <strong>de</strong> ferias o p<strong>la</strong>zas agropecuarias impues -<br />
tas por costumbres tradicionales <strong>de</strong> <strong>la</strong> región, <strong>la</strong>s que requieren <strong>de</strong> adaptaciones técnicas pa<br />
ra cumplir un servicio eficienteo En el Sector I, <strong>de</strong>stacan <strong>la</strong>s p<strong>la</strong>zas <strong>de</strong> Chota, Cutervo y<br />
Bambamarca^, cuyas operaciones comerciales se estiman en seis^, cinco y cuatro millones <strong>de</strong><br />
soles semanales, respectivamente; <strong>de</strong> esos totales, el mayor aporte proviene <strong>de</strong> <strong>la</strong>s operado<br />
nes <strong>de</strong> gana<strong>de</strong>ría <strong>de</strong> carne, <strong>de</strong> trabajo y <strong>de</strong> cria yTrjercrfa, que representa, estimativamente ¡<br />
<strong>de</strong>l 60 a 70% <strong>de</strong>l valor total comercia I izado „ Las operaciones <strong>de</strong> productos agríco<strong>la</strong>s cu -<br />
bren <strong>la</strong> diferencia, <strong>de</strong>stacando el contercio <strong>de</strong> papas. En el Sector II <strong>de</strong>stacan <strong>la</strong>s p<strong>la</strong>zas a<br />
gropecuarias <strong>de</strong> Choropampa, Chilete, Magdalena y Asunción, siendo <strong>la</strong> primera <strong>de</strong> el<strong>la</strong>s <strong>la</strong><br />
<strong>de</strong> mayor importancia. Las transacciones económicas <strong>de</strong> ésta se estiman entre un millón y<br />
un millón y medio <strong>de</strong> soles semanales.<br />
Estos centros feriales actúan <strong>de</strong>sor<strong>de</strong>nadamente y con escasa orientación<br />
técnico-comercial o Los mayoristas, intermediarios y productores realizan operaciones que<br />
facilitan el acaparamiento, <strong>la</strong> especu<strong>la</strong>ción en el peso y precio <strong>de</strong> los productos y el continuismo<br />
en el uso tradicional <strong>de</strong> pesas y medidas obsoletas como <strong>la</strong> arroba, el almud, <strong>la</strong> <strong>la</strong>ta,,<br />
el cajón, <strong>la</strong> alforja, etc El Ministerio <strong>de</strong> Agricultura, <strong>la</strong>s subprefecturas provinciales y<br />
los concejos municipales intervienen in<strong>de</strong>pendientemente, sin guardar <strong>la</strong> coordinación nece<br />
saria en <strong>la</strong>s medidas <strong>de</strong> control, por no existir un reg<strong>la</strong>mento que norme <strong>la</strong>s activida<strong>de</strong>s <strong>de</strong><br />
los centros feriales <strong>de</strong> <strong>la</strong> región» Esta situación provoca rozamientos entre instituciones y<br />
funcionarios, siendo aprovechados por los comerciantes inescrupulosos.<br />
Los concejo^ municipales participan en el abastecimiento regional <strong>de</strong> a-<br />
rroz viéndose limitada sus funciones por falta <strong>de</strong> una implementación física y administrativa<br />
a<strong>de</strong>cuada para realizar sus operaciones. El abastecimiento <strong>de</strong> productos <strong>de</strong> <strong>la</strong> pesca es re-
Pág. <strong>45</strong>8<br />
ZONA NORTE DE CAJAMARCA<br />
guiado á través <strong>de</strong> <strong>la</strong> Empresa Pública <strong>de</strong> Servicios Pesqueros (EPSEP) que cuenta con el Fri<br />
gonfico Pesquero Zonal <strong>de</strong> Chota, que tiene una implementación física insuficiente para a<br />
bastecer <strong>la</strong> <strong>de</strong>manda regional <strong>de</strong> productos marinos.<br />
2. Comercialización <strong>de</strong> los Principales Productos Agropecuarios<br />
a. Comercialización <strong>de</strong> Ganado en pie y Abastecimiento Regional<br />
<strong>de</strong> Carnes<br />
La producción pecuaria <strong>de</strong> <strong>la</strong> región alcanzó a S/.574 , l96,000.00<br />
en <strong>la</strong> campaña <strong>de</strong> 1974-1975, constituyendo <strong>la</strong> actividad económica <strong>de</strong> mayor importancia<br />
<strong>de</strong> <strong>la</strong> zona. La crianza <strong>de</strong> ganado vacuno, ovino y porcino aportó el 74.2% <strong>de</strong> ese valor ,<br />
con una saca anual aproximada <strong>de</strong> 38,300 cabezas <strong>de</strong> vacunos, 39,190 <strong>de</strong> ovinos y 50,710<br />
<strong>de</strong> porcinos. La comercialización <strong>de</strong> ganado adquiere gran importancia, por <strong>la</strong> activa par<br />
ticipación <strong>de</strong> este sector en <strong>la</strong>s tradicionales p<strong>la</strong>zas agropecuarias <strong>de</strong> <strong>la</strong> región.<br />
(1). Oferta<br />
De acuerdo a los estimados <strong>de</strong> ONERN, <strong>la</strong> oferta aparente <strong>de</strong> carnes <strong>de</strong> vacuno, ovino<br />
y porcino fue <strong>de</strong> 6,131 TM durante <strong>la</strong> campaña <strong>de</strong> 1974-1975. La carne <strong>de</strong> vacuno par<br />
ticipó con el 80.9% <strong>de</strong>l total, mientras que <strong>la</strong>s <strong>de</strong> ovino y porcino incidieron con el<br />
12.4% y el 607%, respectivamente. De acuerdo con el Programa Nacional <strong>de</strong> Produc<br />
ción 1975-1976 <strong>de</strong>l Ministerio <strong>de</strong> Alimentación, <strong>la</strong> producción regional <strong>de</strong> carne <strong>de</strong><br />
<strong>la</strong>s especies consi<strong>de</strong>radas cubrió el 3.8% <strong>de</strong> <strong>la</strong> producción nacional, programada en<br />
160,541 TMpara 1975.<br />
La inci<strong>de</strong>ncia <strong>de</strong> los sectores en <strong>la</strong> oferta regional se muestra en el Cuadro N 0 48-DA ,<br />
<strong>de</strong>stacando el subsector <strong>de</strong> San Miguel, en el Ssctor II, con una participación <strong>de</strong>l<br />
20„0% <strong>de</strong>l <strong>volumen</strong> ofertado, teniendo <strong>la</strong> carne <strong>de</strong> vacuno mayor importancia en todos<br />
los sectores. De acuerdo con los estimados <strong>de</strong> ONERN.para el año 1975, <strong>la</strong> produc —<br />
ción regional participó con el 2.6% <strong>de</strong> <strong>la</strong> <strong>de</strong>manda nacional <strong>de</strong> este tipo <strong>de</strong> carnes.<br />
(2). Mercado y Precios<br />
El ganado vacuno fue distribuido según estimaciones en los porcentajes siguientes: 30%<br />
para el mercado <strong>de</strong> Chic<strong>la</strong>yo y <strong>la</strong>s CAP's azucareras <strong>de</strong>l Departamento <strong>de</strong> Lambayeque,<br />
25% para Lima y Cal<strong>la</strong>o, 20% para Piura y 10% para Tru¡illo y <strong>la</strong>s CAP's azucareras<br />
<strong>de</strong>l Departamento <strong>de</strong> La Libertad. La diferencia (15%) es cubierta por el consumo ur -<br />
baño regional, don<strong>de</strong> <strong>de</strong>staca el subsector <strong>de</strong> Chota, principalmente.<br />
La producción <strong>de</strong> porcinos abasteció los mercados <strong>de</strong> Trujillo con el 30% <strong>de</strong> <strong>la</strong> producción,<br />
al metropolitano <strong>de</strong> Lima-Cal<strong>la</strong>o con el 20% y al <strong>de</strong> Chic<strong>la</strong>yo con el 5%. La di<br />
ferencia (<strong>45</strong>%) es cubierta por el consumo regional, siendo por el porcentaje que re -<br />
presenta <strong>de</strong> mucha importancia.
CUADRO N 0 48-DA<br />
PARTICIPACIÓN DE LOS SECTORES EN LA OFERTA REGIONAL DE CARNES Y G<strong>ANA</strong>DO<br />
(1974-1975)<br />
Vacuno<br />
Ovino (*)<br />
Porcino<br />
><br />
o<br />
z<br />
o<br />
en<br />
H<br />
I—I<br />
n<br />
o<br />
><br />
o<br />
o<br />
"O<br />
m<br />
O<br />
C<br />
><br />
Sectores<br />
Subsectores<br />
N 0<br />
Cabezas<br />
%<br />
T.Mc<br />
Carne<br />
%<br />
Cabezas<br />
N 0<br />
%<br />
T.M.<br />
Carne<br />
%<br />
N 0<br />
Cabezas<br />
%<br />
T.M.<br />
Carne<br />
% 1<br />
1<br />
Cutervo<br />
Chota<br />
Santa Cruz<br />
Hualgayoc<br />
6,760<br />
5,690<br />
1,470<br />
6,100<br />
17.6<br />
14.9<br />
3o8<br />
15.9<br />
907<br />
830<br />
172<br />
733<br />
18.3<br />
16.7<br />
3.5<br />
14.8<br />
4,720<br />
5,730<br />
500<br />
6,169<br />
11.5<br />
13.9<br />
1.2<br />
14.9<br />
47<br />
57<br />
5<br />
62<br />
11.4<br />
13.8<br />
1.2<br />
15.0<br />
11,260<br />
10,990<br />
1,320<br />
10,250<br />
22.2<br />
21.7<br />
2.6<br />
20.2<br />
169<br />
165<br />
20<br />
154<br />
22.2 1<br />
21.7<br />
2.6<br />
20.2<br />
II<br />
Cajamarca<br />
San Miguel<br />
Contumazá<br />
6,960<br />
8,340<br />
2,980<br />
18,2<br />
21.8<br />
7.8<br />
875<br />
1,060<br />
381<br />
17.6<br />
21.4<br />
7.7<br />
10,236<br />
6,890<br />
6,946<br />
24.9<br />
T6.7<br />
16.9<br />
102<br />
69<br />
70<br />
24.8<br />
16.8<br />
17.0<br />
7,350<br />
6,620<br />
2,920<br />
14.5<br />
13.0<br />
5.8<br />
110<br />
99<br />
44<br />
14.5<br />
13.0<br />
5.8<br />
Total<br />
38,300<br />
100.0<br />
4,958<br />
100.0<br />
41,191<br />
100.0<br />
412<br />
100.0<br />
50,710<br />
100.0<br />
761<br />
100.0<br />
(*) Incluido ganado caprino.<br />
Fuente : ONERN.<br />
y<br />
fe
Pag. 460 ZONA NORTE DE CAJAMARCA<br />
La carne <strong>de</strong> ovino, <strong>de</strong> escasa disponibilidad comercial, se distribuyó entre los merca -<br />
dos <strong>de</strong> Lima, Trujillo y Chic<strong>la</strong>yo, los que consumieron aproximadamente el 40% <strong>de</strong> <strong>la</strong><br />
producción, absorbiendo el consumo regional <strong>la</strong> diferencia.<br />
Los precios <strong>de</strong> venta <strong>de</strong>l ganado varian <strong>de</strong> acuerdo con <strong>la</strong> raza, edad y estado <strong>de</strong> gordura<br />
<strong>de</strong> los animaleso El ganado vacuno fue cotizado, en <strong>la</strong> campaña <strong>de</strong> 1974, entre<br />
S/.8,000.00 y S/J5,000o00 <strong>la</strong> "cabeza", el ganado ovino entre S/.500.00 y<br />
S/o800.00 cada uno y los porcinos fueron vendidos entre S/.400.00 y S/.ZOO.OO por<br />
animal. La unidad <strong>de</strong> venta es <strong>la</strong> "cabeza", excepcionalmente, se usa el peso <strong>de</strong>l a-<br />
nimal. La tasación o valorización <strong>de</strong> los animales se efectúa "al ojo", tratando <strong>de</strong><br />
<strong>de</strong>terminar en Kg. o en arrobas el peso vivo o el posible rendimiento en carcasa <strong>de</strong> ca<br />
da uno <strong>de</strong> ellos; esta <strong>de</strong>terminación se re<strong>la</strong>ciona con los precios <strong>de</strong> acuerdo a <strong>la</strong>s especies.<br />
Los precios <strong>de</strong>l ganado vacuno variaron entre S/.25.00 y S/.30.00 el Kg. vivo y en -<br />
tre S/.50.00 y S/,60.00 el Kg» <strong>de</strong> carcasa; para los ovinos se usó el precio promedio<br />
<strong>de</strong> S/.30.00 el Kg» vivo y S/.60.00 el Kg- <strong>de</strong> carcasa, siendo <strong>la</strong> cotización <strong>de</strong> <strong>la</strong> car<br />
casa <strong>de</strong>l ganado porcino alre<strong>de</strong>dor <strong>de</strong> S/o35.00 el Kg. Estos precios superaron a los<br />
seña<strong>la</strong>dos en <strong>la</strong>s listas oficiales para el consumo <strong>de</strong> <strong>la</strong> región, propiciando en esta forma<br />
el beneficio c<strong>la</strong>n<strong>de</strong>stino y el <strong>de</strong>sabastecimiento regional <strong>de</strong> carnes.<br />
(3). Sistemas <strong>de</strong> Comercialización<br />
El sistema <strong>de</strong> comercialización <strong>de</strong> ganado esta adaptado a <strong>la</strong>s características ecológi -<br />
cas <strong>de</strong> <strong>la</strong> zona, a <strong>la</strong>s costumbres tradicionales <strong>de</strong> <strong>la</strong> comunidad y a <strong>la</strong> capacidad econó<br />
mica <strong>de</strong> los productores, teniendo el factor tecnológico escasa inci<strong>de</strong>ncia en <strong>la</strong>s <strong>de</strong>cisiones<br />
<strong>de</strong> merca<strong>de</strong>o. El gana<strong>de</strong>ro inicia su campaña <strong>de</strong> venta cuando comienza <strong>la</strong> escasez<br />
<strong>de</strong> pastos o cuando requiere <strong>de</strong> recursos financieros para superar emergencias <strong>de</strong><br />
trabajo o <strong>de</strong> tipo familiar. La estructura comercial imperante aprovecha esta situación<br />
para someter a los productores a sus requerimientos especu<strong>la</strong>tivos <strong>de</strong> precios y acapara<br />
miento <strong>de</strong> ganado.<br />
Las ferias agropecuarias regionales juegan un papel prepon<strong>de</strong>rante en <strong>la</strong>s transacciones<br />
comerciales al propiciar el acercamiento entre comerciantes y productores <strong>de</strong> ganado.<br />
Generalmente, los intermediarios compran el ganado en <strong>la</strong>s partes altas <strong>de</strong> <strong>la</strong>s cuencas<br />
y lo tras<strong>la</strong>dan con ayuda <strong>de</strong> los "arrieros" a los centros o p<strong>la</strong>zas <strong>de</strong> ganado <strong>de</strong> <strong>la</strong> re —<br />
gión, don<strong>de</strong> negocian con los comerciantes costeños, que lo tras<strong>la</strong>dan a los mercados<br />
<strong>de</strong> consumo. Con alguna frecuencia, se observa <strong>la</strong> participación <strong>de</strong> los productores en<br />
<strong>la</strong>s "p<strong>la</strong>zas", negociando con comerciantes intermediarios insta<strong>la</strong>dos en estos centros<br />
<strong>de</strong> acopio tradicionales; excepcionalmente, los productores comercian con los mayo -<br />
ristas <strong>de</strong> costa.<br />
Los comerciantes <strong>de</strong> costa benefician el ganado por medio <strong>de</strong> los "camaleros" en los<br />
mercados <strong>de</strong> Chic<strong>la</strong>yo, Piura y Trujillo. En <strong>la</strong>s CAP's azucareras <strong>de</strong>l Norte, actúan di<br />
rectamente como "proveedores" <strong>de</strong> ganado y, en el gran mercado <strong>de</strong> Lima Metropolita"<br />
na, benefician por medio <strong>de</strong> los comisionistas <strong>de</strong> camal.
DIAGNOSTICO AGROPECUARIO Pág. 461<br />
El ganado, frecuentemente, llega a los mercados <strong>de</strong> consumo en condiciones <strong>de</strong>ficientes;<br />
por esta razón, en <strong>la</strong>s CAP's azucareras y en el mercado <strong>de</strong> Lima-Cal<strong>la</strong>o, principalmente,<br />
son llevados a centros <strong>de</strong> engor<strong>de</strong> especiales para lograr <strong>la</strong> recuperación en<br />
el peso y en <strong>la</strong> presentación <strong>de</strong> los animales. En el mercado <strong>de</strong> Lima, el comerciante<br />
abona alre<strong>de</strong>dor <strong>de</strong> S/.60,00 por dia <strong>de</strong> estancia <strong>de</strong>l animal y, en <strong>la</strong>s CAP's azucareras,<br />
el costo es asumido por <strong>la</strong>s empresas asociativas. Los comisionistas <strong>de</strong>l mercado<br />
<strong>de</strong> Lima se encargan <strong>de</strong> conseguir centros <strong>de</strong> engor<strong>de</strong> cuando es requerido, asF como<br />
turno <strong>de</strong> matanza y liquidación <strong>de</strong> <strong>la</strong> cobranza con los camales, lo cual representa un<br />
costo <strong>de</strong> S/. 140,00 por animal sacrificado.<br />
La modalidad <strong>de</strong> compra-venta vana <strong>de</strong> acuerdo al <strong>volumen</strong> negociado. En <strong>la</strong>s operaciones<br />
pequeñas, <strong>la</strong>s tasaciones son "al ojo" y por unida<strong>de</strong>s o "cabezas" <strong>de</strong> ganado ;<br />
en <strong>la</strong>s transacciones mayores, se efectúa por "partidas" y al "barrer", seña<strong>la</strong>ndo un<br />
precio promedio por "cabeza" La "partida" <strong>de</strong> ganado vacuno vana <strong>de</strong> 10 a 20 cabe<br />
zas y, en ganado menor, <strong>de</strong> 50 a 200 animales. La forma <strong>de</strong> pago es al contado y co7¡<br />
tra entrega»<br />
—<br />
(4)o Funciones y Servicios <strong>de</strong> Comercialización<br />
(a)„ Acopio y Transporte<br />
Los comerciantes intermediarios y gana<strong>de</strong>ros concentran el ganado en <strong>la</strong>s p<strong>la</strong>zas a<br />
gropecuarias <strong>de</strong> <strong>la</strong> región, <strong>de</strong> don<strong>de</strong> son transportados, por los comerciantes <strong>de</strong> eos<br />
ta a los mercados, utilizando camiones que tienen una capacidad <strong>de</strong> 12 a 15 animales,<br />
sueltos o amarrados a <strong>la</strong>s barandas» El transporte <strong>de</strong> ovinos y porcinos se<br />
realiza, igualmente, en camiones <strong>de</strong> baranda, pero adaptados con doble andamia<br />
je y con una capacidad variable <strong>de</strong> 100 a 150 animales. Normalmente, esta da<br />
se <strong>de</strong> transporte se hace con ganado menor mezc<strong>la</strong>do. En otras oportunida<strong>de</strong>s, se<br />
combina ganado mayor en el piso inferior y ganado menor en el andamiaje supe -<br />
rior,,<br />
El valor <strong>de</strong> los fletes por camionada varfa <strong>de</strong> acuerdo a <strong>la</strong> estación climática y a<br />
<strong>la</strong> distancia existente entre los centros <strong>de</strong> producción y los mercados <strong>de</strong> consumo.<br />
En <strong>la</strong>s épocas <strong>de</strong> lluvia, los fletes alcanzan su más alto nivel, haciéndose notar<br />
<strong>la</strong> fuerte inci<strong>de</strong>ncia <strong>de</strong> este servicio en el proceso <strong>de</strong> comercialización. Los fletes<br />
para los mercados <strong>de</strong>l Norte variaron entre S/„4,000,00 y S/.6,000.00 y para<br />
el mercado metropolitano <strong>de</strong> Lima-Cal<strong>la</strong>o, entre S/.9,000.00 y S/. 12,000.00.<br />
Algunos comerciantes pactan con los transportistas fletes <strong>de</strong> ida y vuelta. El valor<br />
<strong>de</strong> éstos a los mercados <strong>de</strong>l Norte <strong>de</strong>l paFs varió entre S/.7,000.00 y<br />
S/„9,000.00 y, para el gran mercado <strong>de</strong> Lima-Cal<strong>la</strong>o, fue <strong>de</strong> S/.20,000.00; en<br />
estos casos, el comerciante transporta el ganado a <strong>la</strong> costa y retorna con vfveres<br />
a los centros <strong>de</strong> producción regional.<br />
El tránsito <strong>de</strong> ganado es contro<strong>la</strong>do en <strong>la</strong>s Garitas <strong>de</strong> Control por el Ministerio <strong>de</strong><br />
Agricultura, reteniendo los Concejos Municipales <strong>de</strong> <strong>la</strong> región el 10% <strong>de</strong>l volu -<br />
men seña<strong>la</strong>do en <strong>la</strong>s guias <strong>de</strong> transporte, para el abastecimiento <strong>de</strong>l mercado locaL
462 ZONA NORTE DE CAJAMARCA<br />
(b). Selección<br />
La precaria organización <strong>de</strong> <strong>la</strong> mayona <strong>de</strong> los productores y su baja capacidad e-<br />
conómica les impi<strong>de</strong> practicar una a<strong>de</strong>cuada selección técnico-comercial <strong>de</strong> los a<br />
nimales, limitándose a diferenciar el ganado en novillos y adultos, <strong>de</strong> acuerdo a<br />
<strong>la</strong> edad, y en chuscos, criollos y cruzados, en re<strong>la</strong>ción con <strong>la</strong> raza. Los comer -<br />
ciantes aprovechan <strong>de</strong> esta situación para absorber <strong>la</strong> mayor utilidad en <strong>la</strong>s tran —<br />
sacciones comerciales.<br />
Abastecimiento Regional <strong>de</strong> Carnes<br />
Los concejos municipales aparentemente centralizan <strong>la</strong> provisión <strong>de</strong> carne a través <strong>de</strong><br />
los camales regionales. Estos proveen a sus comunica<strong>de</strong>s <strong>de</strong> acuerdo con <strong>la</strong>s disposicio<br />
nes vigentes y en coordinación con <strong>la</strong>s oficinas <strong>de</strong> <strong>la</strong> Zona Agraria II <strong>de</strong>l Ministerio <strong>de</strong><br />
Agricultura.<br />
(a). Oferta<br />
De acuerdo con <strong>la</strong>s informaciones <strong>de</strong>l K 'nisterio <strong>de</strong> Agricultura,<strong>de</strong> <strong>la</strong> Zona Agra -<br />
ria II - Cajamarca, los estimados <strong>de</strong> Oi\ ! ERN y <strong>la</strong>s informaciones <strong>de</strong> los Concejos<br />
Municipales <strong>de</strong> <strong>la</strong> región, <strong>la</strong> oferta contro<strong>la</strong>da <strong>de</strong> carnes para el año 1974 fue <strong>de</strong><br />
418.23 T.M., tal como se muestra en el Cuadro N 0 49-DA. Zl beneficio <strong>de</strong> gana<br />
do vacuno representó el 70.0% <strong>de</strong>l <strong>volumen</strong> total, eKporcino cubrió el 27.0% y<br />
<strong>la</strong> diferencia fue ofertada con ganado ovino y caprino.<br />
El consumo fue mayor en el Sector I, <strong>de</strong>stacando Chota por su mayor porcentaje ,<br />
con el 51.4%, Cutervo, con el 18.8%, y Bambamarca, con el 17.4%. La dife -<br />
rencia fue consumida principalmente por Hualgayoc, en el Sector 1, y Chijete, en<br />
el Sector II, con aproximadamente, 3.0% cada uno. El ganado ofertado y benefi<br />
ciado en estos camales proviene integramente <strong>de</strong> <strong>la</strong> región. El consumo <strong>de</strong> <strong>la</strong> pob<strong>la</strong>ción<br />
rural no es contro<strong>la</strong>do por razones obvias, siendo muy importante su participación<br />
en <strong>la</strong> <strong>de</strong>manda total, especialmente <strong>de</strong> ganado menor.<br />
(b). Mercado y Precios<br />
Los camales municipales abastecen <strong>de</strong> carne a sus comunida<strong>de</strong>s pero presentan <strong>de</strong>fi<br />
ciencias que facilitan el beneficio c<strong>la</strong>n<strong>de</strong>stino <strong>de</strong> los animales, especialmente <strong>de</strong><br />
ganado porcino y ovino. De acuerdo a <strong>la</strong>s disposiciones vigentes, los concejos<br />
contro<strong>la</strong>n y fijan los precios en sus jurisdicciones. La c<strong>la</strong>sificación <strong>de</strong> <strong>la</strong> carne es<br />
<strong>de</strong>terminada empTricamente por falta <strong>de</strong> normas en <strong>la</strong> c<strong>la</strong>sificación, permitiendo u<br />
na gran variación en los precios. En el Cuadro N 0 50-DA, se muestran los precios<br />
que rigieron en diversos distritos a mediados <strong>de</strong>l año 1975; sin embargo, estas cotizaciones<br />
se alteran cuando se produce <strong>la</strong> venta al consumidor, existiendo un comercio<br />
especu<strong>la</strong>tivo que juega con los precios y <strong>la</strong> calidad <strong>de</strong> los productos.
Sectores<br />
Centro Urbano<br />
CUADRO N"49"DA<br />
BENEFICIO ANUAE.DE G<strong>ANA</strong>DO EN LOS ffRINCIBALES CENTROS URBANOS DE LA REGION<br />
(J.-974))<br />
Va cunos<br />
Porcino<br />
Ovino<br />
í'.fcAe zas-<br />
- L 0 Carne " •<br />
7 Cabezas Carne Cabezas Carne<br />
N° lo T..M., o/o<br />
N e<br />
lo T,M.<br />
",0<br />
N" lo T.M. %<br />
•Cab ¿zas<br />
Caprino<br />
Carne<br />
N" % T.M.<br />
"k<br />
O<br />
"Z<br />
o<br />
C/í<br />
H<br />
I—I<br />
O<br />
O<br />
><br />
o<br />
O<br />
"O<br />
m<br />
n<br />
G<br />
D><br />
JO<br />
I<br />
Cutervo<br />
Cochabamba<br />
Chota<br />
Bambamarca<br />
Hualgayoc (*)<br />
,<strong>45</strong>8<br />
38<br />
1,283<br />
336<br />
52<br />
19,5<br />
1,6<br />
54.7<br />
14.4<br />
2.2<br />
65.46<br />
4.82<br />
160.39<br />
37,41<br />
6,50<br />
22.4<br />
1.6<br />
54,8<br />
12,8<br />
2.2<br />
527<br />
56<br />
1,313<br />
793<br />
156<br />
16,9<br />
1,8<br />
42.1<br />
25,4<br />
5.0<br />
12,15<br />
1.87<br />
54,46<br />
28,88<br />
5.55<br />
10,7<br />
1.6<br />
48.2<br />
25,6<br />
4,9<br />
,40<br />
2<br />
13<br />
429<br />
104<br />
5,0<br />
0.2<br />
1,6<br />
53,6<br />
13.0<br />
0,43<br />
0,<strong>03</strong><br />
0,13<br />
6,26<br />
1,52<br />
3,7<br />
0,3<br />
1.1<br />
53.6<br />
13.0<br />
39 '<br />
--<br />
—<br />
—<br />
«._<br />
.90,7<br />
--<br />
--<br />
--<br />
_"•<br />
, 0,62<br />
--<br />
--<br />
--<br />
-„<br />
V88.6<br />
--<br />
--<br />
--<br />
""<br />
II<br />
San Miguel<br />
San Pablo (*)<br />
Chilete<br />
Contumaz!<br />
33<br />
40<br />
r 85<br />
20<br />
1,4<br />
1.7<br />
3.6<br />
0.9<br />
3.88<br />
4.<strong>45</strong><br />
7,74<br />
2.20<br />
1.3<br />
1.5<br />
2.6<br />
0.8<br />
90<br />
80<br />
65<br />
37<br />
2,9<br />
2.6<br />
2.1<br />
1.2<br />
3.70<br />
2.96<br />
2,16<br />
1.31<br />
3.3<br />
2.6<br />
1.9<br />
1.2<br />
46<br />
50<br />
16<br />
100<br />
5,8<br />
6.3<br />
2.6<br />
12.5<br />
1.27<br />
0,62<br />
0.75<br />
1.26<br />
10.9<br />
5.3<br />
1.3<br />
10.8<br />
--<br />
--<br />
--<br />
4<br />
--<br />
--<br />
--<br />
9.3<br />
--<br />
--<br />
--<br />
0.08<br />
--<br />
-~<br />
--<br />
11.4<br />
T otal<br />
2,3<strong>45</strong><br />
100 0<br />
292.82<br />
100.0<br />
3, J17<br />
100.0<br />
113.04<br />
100.0<br />
800<br />
100.0<br />
11.67<br />
100.0<br />
43<br />
...<br />
100.0<br />
0.70<br />
100.0<br />
(*) Estimados ONFRN.<br />
Fuente: Ministerio <strong>de</strong> Agricultura "Zona Agraria Il-Cajamarca<br />
Concejos Municipales <strong>de</strong> <strong>la</strong> Región
Pag, 464 ZONA NORTE DE CAJAMARCA<br />
(c). Sistemas <strong>de</strong> Comercialización<br />
Los concejos municipales autorizan ¡a intervención <strong>de</strong> los concesionarios que utili<br />
zan los camales y acfúan como comerciantes <strong>de</strong> carne en <strong>la</strong> región; éstos com -<br />
pran el ganado directamente <strong>de</strong> los productores en chacra o en <strong>la</strong>s p<strong>la</strong>zas regionales.<br />
El ganado es beneficiado en los camales municipales y se le hace llegar a<br />
los consumidores a través <strong>de</strong> los mismos concesionarios o El beneficio y <strong>la</strong> comer -<br />
cialización <strong>de</strong>l ganado vacuno no tienen un régimen <strong>de</strong> limitación en el sacrifi -<br />
ció <strong>de</strong> animales^ encontrándose supeditado a <strong>la</strong>s disponibilida<strong>de</strong>s <strong>de</strong>l proveedor,,<br />
(d). Principales Funciones y Servicios <strong>de</strong> Comercialización<br />
- Acopio y Preparación Comercial<br />
Los concesionarios municipales concentran el ganado recolectado en los camales<br />
o corrales particu<strong>la</strong>res para luego ser sacrificados^ c<strong>la</strong>sificados y certificados<br />
sanitariamente para su venta en los mercados. Todas <strong>la</strong>s operaciones se rea<br />
lizan en forma manual y el sacrificio se ejecuta bajo el sistema <strong>de</strong> "puntil<strong>la</strong>" .<br />
En algunos distritos, no se realiza <strong>la</strong> certificación sanitaria,, particu<strong>la</strong>rmente<br />
en aquellos lugares don<strong>de</strong> no existen camales municipales. Los cueros prove -<br />
nientes <strong>de</strong> <strong>la</strong>s reses son preparados por comerciantes intermediarios que lo ad -<br />
quieren entre S/,30.00 y SA35,00 el kilo^ para negociarlos a <strong>la</strong>s curtiembres<br />
<strong>de</strong> los mercados <strong>de</strong> Trujillo y <strong>de</strong> Lima, principalmente»<br />
- C<strong>la</strong>sificación y Transporte<br />
La carne es c<strong>la</strong>sificada <strong>de</strong> acuerdo a <strong>la</strong>s disposiciones municipales, sin existir<br />
<strong>la</strong> orientación técnica necesaria para establecer normas regionales en el comer<br />
ció <strong>de</strong> <strong>la</strong> carne. El transporte <strong>de</strong> <strong>la</strong> carne beneficiada se realiza por medio <strong>de</strong><br />
carretil<strong>la</strong>s, triciclos o acémi<strong>la</strong>s y, en algunos casos, por medio <strong>de</strong> personas que<br />
actúan como cargadores.<br />
- Gastos <strong>de</strong> Comercialización y Derechos Municipales <strong>de</strong> Beneficio<br />
El beneficio <strong>de</strong> ganado y <strong>la</strong> comercialización que conlleva implica gastos que<br />
varían <strong>de</strong> acuerdo a <strong>la</strong>s modalida<strong>de</strong>s impuestas por <strong>la</strong> administración municipal.<br />
En algunos casos, se cobra por "beneficio <strong>de</strong> cabeza", mientras que, en otros,<br />
se entrega el sacrificio y el uso <strong>de</strong> mesa <strong>de</strong> mercado para <strong>la</strong> venta por conce -<br />
sión. El ganado vacuno paga entre S/. 15.00 y S/.20.00 por cabeza y el ganado<br />
menor (porcino y ovino) entre S/.5.00 y S/JOoOO cada uno. La adminis<br />
tración, normalmente, es <strong>de</strong> tipo municipal, existiendo otra modalidad, consis<br />
tente en <strong>la</strong> intervención <strong>de</strong> "rematistas" que se encargan <strong>de</strong> estas funciones, co<br />
—<br />
mo en el caso <strong>de</strong>l camal y el mercado <strong>de</strong> Chota„<br />
Los servicios <strong>de</strong> inspección sanitaria, c<strong>la</strong>sificación <strong>de</strong>l producto y control esta<br />
dístico son realizados por <strong>la</strong>s oficinas <strong>de</strong>l Ministerio <strong>de</strong> Agricultura, Zona A -<br />
graria II, sin representar costo alguno para los concejos municipales ni para los<br />
concesionarios.
DIAGNOSTICO AGROPECUARIO Pág. 465<br />
b. Comercialización <strong>de</strong> <strong>la</strong> Papa<br />
El cultivo <strong>de</strong> <strong>la</strong> papa, como ocurre en toda <strong>la</strong> sierra <strong>de</strong>l país, tiene gran<br />
importancia regional, tanto por su inci<strong>de</strong>ncia en <strong>la</strong> economía <strong>de</strong> los productores como por<br />
su participación en <strong>la</strong> alimentación <strong>de</strong> sus pob<strong>la</strong>dores» De acuerdo d los estudios <strong>de</strong><br />
ONERN, en <strong>la</strong> campaña 1974-1975, <strong>la</strong> papa cubrió una superficie <strong>de</strong> 8,620 Ha. en toda<br />
<strong>la</strong> región, ocupando el SerJugar en cuanto a superficie anual <strong>de</strong> cultivo 3<br />
(l)o Oferta<br />
La producción <strong>de</strong> papa en <strong>la</strong> región, en <strong>la</strong> campaña 1974-1975, según estimados <strong>de</strong><br />
ONERN, fue <strong>de</strong> 44,670 T»Mo, con un valor <strong>de</strong> S/J56'346,000.00, representando en<br />
conjunto el 28.5% y 30o8% <strong>de</strong>l <strong>volumen</strong> y valor <strong>de</strong> <strong>la</strong> producción agríco<strong>la</strong>, respectiva<br />
mente»<br />
La zona productora <strong>de</strong> papa mas importante <strong>de</strong> <strong>la</strong> región fue <strong>la</strong> provincia <strong>de</strong> Hualgayoc,<br />
siendo el <strong>volumen</strong> <strong>de</strong> producción <strong>de</strong> 33,2%, tal como se muestra en el Cuadro N 0 SI<br />
DA.<br />
La oferta <strong>de</strong> papa regional en los últimos años se mantiene estacionaria, como conse -<br />
cuencia <strong>de</strong> <strong>la</strong>s limitaciones <strong>de</strong> mercado y <strong>de</strong> cultivo impuestas por el control fitosani -<br />
torio <strong>de</strong> <strong>la</strong> enfermedad <strong>de</strong>nominada "Marchitez bacteriana", que fue <strong>de</strong>tectada en <strong>de</strong>terminados<br />
lugares <strong>de</strong> <strong>la</strong> región, motivando <strong>la</strong> reg<strong>la</strong>mentación <strong>de</strong> su cultivo para evitar<br />
<strong>la</strong> expansión <strong>de</strong>l área <strong>de</strong> inci<strong>de</strong>ncia. La prevención y control obligatorio <strong>de</strong> esta en -<br />
fermedad obligó a reducir y/o reprogramar <strong>la</strong>s áreas <strong>de</strong> cultivo, con el fin <strong>de</strong> evitar<br />
exce<strong>de</strong>ntes y disminuir <strong>la</strong> movilización <strong>de</strong> papas a otras regiones <strong>de</strong>l pafs.<br />
La oferta <strong>de</strong> este producto se presenta <strong>de</strong> Diciembre a Abril para los cultivos bajo riego<br />
y entre Julio y Octubre para los cultivos <strong>de</strong> secano. Las varieda<strong>de</strong>s comerciales<br />
más difundidas son !a Renacimiento, <strong>la</strong> Merpata, <strong>la</strong> Mariva y <strong>la</strong> Huarena, existiendo ,<br />
a<strong>de</strong>más, <strong>la</strong>s varieda<strong>de</strong>s regionales, <strong>la</strong>s que son muy usadas en el autoconsumo <strong>de</strong> los<br />
productores c<br />
De acuerdo a los estimados <strong>de</strong> ONERN, <strong>la</strong> <strong>de</strong>manda <strong>de</strong> semil<strong>la</strong> <strong>de</strong> papa fue <strong>de</strong> 7,758<br />
T.Mo, <strong>de</strong> <strong>la</strong>s cuales aproximadamente el 70% provee <strong>la</strong> producción local „ Entre los<br />
meses <strong>de</strong> Mayo y Setiembre, se observa un flu¡o <strong>de</strong> semil<strong>la</strong> <strong>de</strong> papa proveniente <strong>de</strong> <strong>la</strong><br />
producción periférica <strong>de</strong> <strong>la</strong> región y <strong>de</strong> <strong>la</strong> redistribución comercial <strong>de</strong> <strong>la</strong>s ciuda<strong>de</strong>s <strong>de</strong><br />
Chic<strong>la</strong>yo y Trujillo,<br />
(2) s Mercado y Precios<br />
El mercado local, constituido por Cutervo, Cochabamba, Bambamarca, Chota, Hualga<br />
yoc, Contumazá, los distritos regionales y el autoconsumo <strong>de</strong> los productores llega a<br />
absorber el 65% <strong>de</strong> <strong>la</strong> producción; los mercados <strong>de</strong> Chic<strong>la</strong>yo y Trujillo son abastecí -<br />
dos con el 20% y el 5% <strong>de</strong> <strong>la</strong> producción, respectivamente, y <strong>la</strong> diferencia es usada<br />
como semil<strong>la</strong> vegetativa. En los mercados <strong>de</strong> Chic<strong>la</strong>yo y Trujillo, el producto es redis
Pág. 466<br />
ZONA NORTE DE CAJAMARCA<br />
CUADRO N 0 50-DA<br />
PRECIOS DE VENTA AL PUBLICO Y CLASIFICACIÓN DE CARNES EN LOS<br />
MERCADOS REGIONALES<br />
(1975)<br />
Precio Soles Oro<br />
Especie<br />
Calidad<br />
Sector 1<br />
Sector II<br />
Cut^rvo<br />
Bambamarca<br />
Chota<br />
San Pablo<br />
Chilete<br />
Vacuno<br />
Pulpa<br />
Con hueso<br />
55.00<br />
<strong>45</strong>.00<br />
<strong>45</strong>,00<br />
40.00<br />
50.00<br />
40.00<br />
40.00<br />
40*00<br />
Porcino<br />
Pulpa<br />
Con hueso<br />
50.00<br />
40.00<br />
35.00<br />
<strong>45</strong>.00<br />
40.00<br />
38.00<br />
30,00<br />
; Ovino<br />
¡<br />
f<br />
Pulpa<br />
Con hueso<br />
50.00<br />
40.00<br />
35.00<br />
<strong>45</strong>.00<br />
40.00<br />
38.00<br />
35.00<br />
fuente *<br />
ConcejeK Municipales <strong>de</strong> <strong>la</strong> Región<br />
CUADRO N 0 51-DA<br />
PARTICIPACIÓN DE LOS SECTORES EN LA OFERTA REGIONAL DE PAPAS<br />
(1974-1975)<br />
!<br />
¡ Sectores<br />
i<br />
Subsec tores<br />
Area Anual <strong>de</strong><br />
Producción<br />
Ha.<br />
% ,<br />
T.M.<br />
Volumen<br />
%'<br />
Valor<br />
Soles .<br />
%<br />
! 1<br />
!<br />
i<br />
t<br />
Cutervo<br />
Chota<br />
Santa Cruz<br />
Hualgayoc<br />
758<br />
1,802<br />
160<br />
2,965<br />
8.8<br />
20.9<br />
1.9<br />
34.4<br />
3,790<br />
10,810<br />
800<br />
14,825<br />
"815<br />
24.2<br />
1.8<br />
33.2<br />
, IS^ÓS,000.00<br />
37 ! 835,000.00<br />
2*800,000.00<br />
51'888,000.00<br />
8.5<br />
24.2<br />
1.8,<br />
33.2<br />
í<br />
i<br />
Cajamarca<br />
San Miguel<br />
Contumazá<br />
1,431<br />
1,243<br />
261<br />
16.6<br />
14.4<br />
3.0<br />
7J55<br />
6,210<br />
1,080<br />
16.0<br />
13.9<br />
2,4<br />
25'043,000.00<br />
21735,000,00<br />
3780,000.00<br />
16.0<br />
13.9<br />
2.4<br />
| Total<br />
8,620<br />
100.0<br />
44,670<br />
100.0<br />
156 l 346 / 000.00<br />
100.0<br />
i<br />
Fuente: ONERN,
DIAGNOSTICO AGROPECUARIO Pág. 467<br />
tribuido hacia <strong>la</strong> Costa Norte, mostrando fuerte inci<strong>de</strong>ncia el consumo <strong>de</strong> <strong>la</strong>s CAP's a-<br />
zucareras <strong>de</strong> <strong>la</strong> región. En algunas oportunida<strong>de</strong>s, comerciantes inescrupulosos, especialmente<br />
<strong>de</strong> Trujillo, vio<strong>la</strong>n <strong>la</strong>s disposiciones vigentes y hacen llegar al mercado <strong>de</strong><br />
Lima un producto potencial mente difusor <strong>de</strong> problemas f¡ tosan i torios.<br />
La arroba (11.5 Kg.) y el almud (28 a 30 Kg.), como unidad <strong>de</strong> venta en <strong>la</strong>s re<strong>la</strong>cio -<br />
nes comerciales <strong>de</strong> los productores, mayoristas y minoristas es tradicional y está suma -<br />
mente arraigado en <strong>la</strong> pob<strong>la</strong>ción; en cambio, en <strong>la</strong>s transacciones <strong>de</strong> los' 'minoristas<br />
con los consumidores, el uso <strong>de</strong>l kilogramo se va introduciendo favorablemente, tendiendo<br />
a <strong>de</strong>saparecer el uso <strong>de</strong> <strong>la</strong> libra y <strong>la</strong> arroba.<br />
Los precios <strong>de</strong> <strong>la</strong> papa en chacra o al bor<strong>de</strong> <strong>de</strong> <strong>la</strong> carretera variaron, <strong>de</strong> acuerdo a <strong>la</strong><br />
época, variedad y calidad <strong>de</strong>l producto, entre S/.50.00 f' S/.S0.00 4a arrqbq<br />
(S/.4.35 y S/.7.00 el Kg.). En Chota principalmente, el almud se cotrzó entre<br />
S/. 120.00 y S/.210.00 (S/.4.00 y S/.7.00 el Kg); estas cotizaciones tuvieron en<br />
<strong>la</strong>s p<strong>la</strong>zas agropecuarias regionales poca variación, comparados con los precios en cha<br />
era, mientras que en los mercados <strong>de</strong> consumo regional osci<strong>la</strong>ron entre S/.5.1)0 y<br />
S/.10.00 el Kg., siendo <strong>la</strong> cotización en los mercados <strong>de</strong> <strong>la</strong> Costa <strong>de</strong> S/.5.G0 a<br />
S/. 12.00 el Kg. La variación <strong>de</strong> los precios en el proceso comercial se <strong>de</strong>be, princi<br />
pálmente, a <strong>la</strong> época y a los regimenes <strong>de</strong> abastecimiento <strong>de</strong> los mercados.<br />
En el comercio <strong>de</strong> <strong>la</strong> semil<strong>la</strong> <strong>de</strong> papa, los precios están referidos en arrobas y en kilogramos.<br />
Los productores libres negociaron entre S/.50.00 y S/. 100.00 - <strong>la</strong> - arroba<br />
(S/.4.35 a S/.8.70 el Kg.), mientras que los productores <strong>de</strong> semilleros oficializados<br />
por el Ministerio <strong>de</strong> Agricultura, Zona Agraria II, vendieron a S/.7.00 el Kg. <strong>de</strong> este<br />
producto.<br />
(3). SJstemas <strong>de</strong> Comercialización<br />
La modalidad <strong>de</strong> compra-venta más difundida, se lleva a cabo con <strong>la</strong> intervención <strong>de</strong><br />
los comerciantes intermediarios que pactan <strong>la</strong> operación en chacra con los productores,<br />
haciendo una contribución parcial <strong>de</strong> dinero a cuenta <strong>de</strong> <strong>la</strong> entrega posterior <strong>de</strong>l producto<br />
c<strong>la</strong>sificado, envasado y puesto "en bor<strong>de</strong> <strong>de</strong> carretera" o "salida". Cuando el<br />
producto se <strong>de</strong>stina a los mercados <strong>de</strong> <strong>la</strong> Costa, los comerciantes intermediarios negó -<br />
cian con los mayoristas, quienes cuentan con almacenes propios en esos mercados <strong>de</strong><br />
consumo; éstos, a su vez, distribuyen el producto a través <strong>de</strong> minoristas que lo " hacen<br />
llegar a los consumidores. En el mercado regional, los comerciantes intermediarios lo<br />
cales negocian con los minoristas y éstos con los consumidores.<br />
Otra modalidad usada por los pequeños productores es <strong>la</strong> <strong>de</strong> llevar el producto a Fas pía<br />
zas agropecuarias <strong>de</strong> <strong>la</strong> región, don<strong>de</strong> lo negocian con los comerciantes intermediarios<br />
y, en algunos casos, con los consumidores. Este sistema permite concentrar volúmenes<br />
<strong>de</strong> producción en manos <strong>de</strong> los intermediarios <strong>de</strong> p<strong>la</strong>za que lo; negocian con los comer<br />
ciantes <strong>de</strong> Costa, quienes lo hacen llegar a los centros <strong>de</strong> consumo.<br />
De acuerdo con <strong>la</strong> R.S. N 0 1225-72-AG <strong>de</strong>l 22-11-1972, <strong>la</strong> comercialización <strong>de</strong> <strong>la</strong><br />
papa <strong>de</strong> los <strong>de</strong>partamentos <strong>de</strong> La Libertad, Cajamarca y Ancash hacia el mercado <strong>de</strong>
468 ZONA NORTE DE CAJAMARCA<br />
Lima <strong>de</strong>be ser asumida exclusivamente por <strong>la</strong> Empresa Pública <strong>de</strong> Servicios Agropecuarios<br />
(EPSA). Sin embargo, en <strong>la</strong> zona estudiada, <strong>la</strong> participación <strong>de</strong> esta institución<br />
es prácticamente nu<strong>la</strong> y el comercio <strong>de</strong> papa queda enteramente en manos <strong>de</strong> comer —<br />
ciantes intermediarios, cuyo interés mercantilista y <strong>de</strong>sconocimiento <strong>de</strong> <strong>la</strong>s consecuencias<br />
sanitarias pue<strong>de</strong>n causar <strong>la</strong> dispersión <strong>de</strong> los focos <strong>de</strong> marchitez bacteriana <strong>de</strong>tectados<br />
en <strong>la</strong> región P<br />
El comercio <strong>de</strong> <strong>la</strong> semil<strong>la</strong> <strong>de</strong> papa opera ba¡o dos modalida<strong>de</strong>s, <strong>de</strong> acuerdo a <strong>la</strong> proce<strong>de</strong>ncia<br />
<strong>de</strong>l producto. Cuando <strong>la</strong> semil<strong>la</strong> proce<strong>de</strong> <strong>de</strong> proveedores tradicionales^, el comercio<br />
se realiza en <strong>la</strong>s "p<strong>la</strong>zas" regionales a través <strong>de</strong> comerciantes intermediarios y,<br />
cuando proce<strong>de</strong> <strong>de</strong> los semilleros oficializados por el Programa Nacional <strong>de</strong> Papa, el<br />
producto es adquirido por los agricultores directamente <strong>de</strong>l Ministerio <strong>de</strong> Agricultura,,<br />
La participación <strong>de</strong> los agentes en este sistema se muestra en el Gráfico N 0 4-DA # don<br />
<strong>de</strong> se observa <strong>la</strong> fuerte inci<strong>de</strong>ncia <strong>de</strong> los comerciantes intermediarios.<br />
Funciones y Servicios <strong>de</strong> Comercialización<br />
(a) 0 Acopio y Transporte<br />
La concentración <strong>de</strong> <strong>la</strong> papa <strong>de</strong> consumo se efectúa al bor<strong>de</strong> <strong>de</strong> <strong>la</strong>s carreteras o<br />
"salidas y en <strong>la</strong>s p<strong>la</strong>zas agropecuarias <strong>de</strong> <strong>la</strong> región. El transporte a los centros <strong>de</strong><br />
consumo se realiza por medio <strong>de</strong> camiones tradicionales no especializados y <strong>de</strong> los<br />
centros <strong>de</strong> producción a los centros <strong>de</strong> acopio en animales <strong>de</strong> carga.<br />
El valor <strong>de</strong> los fletes varía <strong>de</strong> acuerdo a <strong>la</strong> distancia <strong>de</strong> los mercados <strong>de</strong> consumo y<br />
al estado <strong>de</strong> <strong>la</strong>s vías <strong>de</strong> comunicación. En los perfodos <strong>de</strong> lluvia^ los fletes se cotizan<br />
en su más alto nivel y,, en verano, su valor <strong>de</strong>crece, usándose indiferente —<br />
mente como unidad <strong>de</strong> flete <strong>la</strong> camionada, <strong>la</strong> arroba o el kilogramo. Los precios<br />
a los mercados <strong>de</strong> Chic<strong>la</strong>yo y Trujiflo variaron entre S/o5 8 00 y S/.12„00 por arro<br />
ba (S/„0.40 a S/J .00 por Kg.),- en camionadas <strong>de</strong> 80 a 100 sacos <strong>de</strong> papas,<br />
(b)<br />
C<strong>la</strong>sificación y Envases<br />
La papa para consumo es c<strong>la</strong>sificada en primera^ segunda y tercera, <strong>de</strong> acuerdo al<br />
tamaño y estado sanitario <strong>de</strong>l tubérculo. La operación se efectúa en forma manual<br />
y se usa como patrón <strong>la</strong>s normas tradicionales <strong>de</strong> <strong>la</strong> región. La papa <strong>de</strong> mejor cali<br />
dad, normalmente abastece los mercados <strong>de</strong> <strong>la</strong> Costa; en cambio, <strong>la</strong> papa <strong>de</strong> menor<br />
calidad es utilizada para abastecer el mercado regional y el autoconsumo <strong>de</strong><br />
!os productores. La papa <strong>de</strong> tercera, en los proveedores tradicionales, es comer<br />
cializada como semil<strong>la</strong>,.<br />
Los envases son proporcionados por los comerciantes intermediarios, siendo gene -<br />
raímente sacos <strong>de</strong> yute usados en buen estado y teniendo una capacidad variable<br />
<strong>de</strong> 6 a 8 arrobas (70 a 95 Kg.) con tapabocas, no existiendo una normalización <strong>de</strong><br />
envases en el comercio regional <strong>de</strong> este tubérculo.
DIAGNOSTICO AGROPECUARIO Pág. 469<br />
c» Comercialización <strong>de</strong>l Maiz<br />
El maiz constituye el alimento tradicional <strong>de</strong> los pob<strong>la</strong>dores <strong>de</strong> los<br />
centros urbanos y rurales <strong>de</strong> <strong>la</strong> región, utilizándose bien como maiz grano o como maíz cho<br />
do. El cultivo <strong>de</strong>l mafz cubre una superficie anual <strong>de</strong> 33,399 Ha., <strong>de</strong>stacando en el Sector<br />
I, el subsector <strong>de</strong> Chota, que <strong>de</strong>dica el 28.8% <strong>de</strong>l área anual <strong>de</strong> producción a este cultivo<br />
o<br />
(1). Oferta<br />
De acuerdo a los estimados <strong>de</strong> ONERN, <strong>la</strong> producción <strong>de</strong> mafz en <strong>la</strong> campaña 1974-<br />
75 fue <strong>de</strong> 13,359 TM, con un valor <strong>de</strong> S/» 133'596,000.00, que representaron 8.5%<br />
y 26.3% <strong>de</strong>l <strong>volumen</strong> y valor <strong>de</strong> <strong>la</strong> producción agríco<strong>la</strong>, respectivamente. La participación<br />
<strong>de</strong> los subsectores en <strong>la</strong> producción se muestra en el Cuadro N 0 52-DA, don<br />
<strong>de</strong> se observa que <strong>la</strong> provincia <strong>de</strong> Chota es <strong>la</strong> más importante, ya que provee el 2B.S~<br />
porciento <strong>de</strong>l <strong>volumen</strong> total <strong>de</strong> <strong>la</strong> producción» Respecto al tipo <strong>de</strong> grano, se ha <strong>de</strong>ter<br />
minado que el mayor <strong>volumen</strong> <strong>de</strong> <strong>la</strong> producción correspon<strong>de</strong> al mafz amarillo o morocho,<br />
siendo menor <strong>la</strong> producción <strong>de</strong> maíz b<strong>la</strong>nco amiláceo que, parcialmente, es utilizado<br />
para <strong>la</strong> extracción <strong>de</strong> choclos.,<br />
La oferta <strong>de</strong> mafz grano se presenta entre los meses <strong>de</strong> Mayo y Agosto y <strong>la</strong> <strong>de</strong> mafz<br />
choclo entre los meses <strong>de</strong> Febrero y Mayo. La producción regional, en <strong>de</strong>terminados<br />
momentos, no satisface <strong>la</strong> <strong>de</strong>manda local, motivo por el cual se oferta mafz grano a -<br />
manilo, <strong>de</strong>nominado en <strong>la</strong> zona "mafz ¡aeno" y proveniente <strong>de</strong> Chic<strong>la</strong>yo y Trujillo<br />
especialmente»<br />
(2)o<br />
Mercado y Precios<br />
El consumo regional <strong>de</strong> mafz, incluido el autoabastecimientb <strong>de</strong> semil<strong>la</strong>, es estimado<br />
en 75% <strong>de</strong>l <strong>volumen</strong> <strong>de</strong> <strong>la</strong> producción total „ La diferencia se <strong>de</strong>stina a los mercados<br />
<strong>de</strong> <strong>la</strong> Costa, principalmente al <strong>de</strong> Chic<strong>la</strong>yo, <strong>de</strong> don<strong>de</strong> es redistribuido a los mercados<br />
<strong>de</strong> Chimbóte, Trujillo y Piura. Al igual que en el maíz grano, el consumo regional<br />
<strong>de</strong> choclo inci<strong>de</strong> en el 80% <strong>de</strong> <strong>la</strong> producción local, <strong>de</strong>stinándose cerca <strong>de</strong>l 20% a los<br />
mercados <strong>de</strong> Chic<strong>la</strong>yo y Trujllloo<br />
El precio <strong>de</strong>l mafz grano en chacra varió entre S/ O 60 9 00 y SA 100 o 00 <strong>la</strong> arroba<br />
(S/.5.20 y S/.8.70 el Kg.) para el amarillo y entre SA80.00 y S/. 150.00 (S/.7.00<br />
y S/. 13.00), para el b<strong>la</strong>nco; mientras que el precio <strong>de</strong>l maíz choclo osciló entre<br />
S/.40,00 y SA 100.00 el ciento.<br />
(3). Sistemas <strong>de</strong> Comercialización<br />
La operación <strong>de</strong> compra-venta <strong>de</strong>l maiz grano se realiza en chacra a través <strong>de</strong> los ne<br />
gociantes intermediarios, quienes <strong>la</strong> acopian en <strong>de</strong>pósitos domiciliarios en los centros<br />
urbanos, siendo negociados los días <strong>de</strong> p<strong>la</strong>za agropecuaria con los comerciantes <strong>de</strong>
Pág. 470<br />
ZONA NORTE DE CAJAMARCA<br />
CIRCUITO DE COMERCIALIZACIÓN DE LA PAPA<br />
GRÁFICO N 0 4-DA<br />
PRODUCTORES<br />
En Chacra<br />
P<strong>la</strong>za Agropecuaria i<br />
Zana <strong>de</strong><br />
> ><br />
Producción<br />
Intermediario<br />
<strong>de</strong> Costa<br />
1<br />
Comerciante<br />
Mayorista<br />
Intermediario<br />
<strong>de</strong> P<strong>la</strong>za<br />
1<br />
Comerciante<br />
Minorista<br />
I<br />
Consumidores<br />
<strong>de</strong> Costa<br />
Minorista<br />
Regional<br />
1<br />
Consumidores<br />
Regionales<br />
><br />
Cercados <strong>de</strong><br />
Consumo<br />
CUADRO N° 52-DA<br />
PARTICIPACIÓN DE LOS SECTORES EN LA OFERTA REGIONAL DE MAÍZ<br />
(1974-1975)<br />
Sectores<br />
Subsectores -<br />
Area Anual<br />
Ha, "¡o<br />
Voh<br />
T.M.<br />
unen<br />
lo<br />
Valor<br />
Soles<br />
%<br />
I<br />
11<br />
Cutervo<br />
Chota<br />
Santa Cruz<br />
Hualgavoc<br />
Cajamarca<br />
San Miguel<br />
Contumazá<br />
Total<br />
8,413<br />
9,637<br />
1,351<br />
_ 6,700<br />
3.946<br />
2,515<br />
837<br />
33,399<br />
25.2<br />
28.8<br />
4.1<br />
20.1<br />
11.8<br />
7.5<br />
2.5<br />
100.0<br />
3,365<br />
3,855<br />
540<br />
2,680<br />
1,578<br />
1,006<br />
335<br />
13,359<br />
25.2<br />
28.8<br />
4.1<br />
20.1<br />
11.8<br />
7.5<br />
2.5<br />
100.0<br />
33'652,000.00<br />
38 , 548,000, 00<br />
5 , 404,000,00<br />
26*800,000,00<br />
15'784,000. 00<br />
icoeo.ooo.oo<br />
3°348. 000. 00<br />
iss'sge^oo.oo<br />
25.2<br />
28.8<br />
4.1<br />
20.1<br />
11.8<br />
7.5<br />
2.5<br />
100.0<br />
Fuente : ONERN
DIAGNOSTICO AGROPECUARIO Pág. 471<br />
. Costa; en algunas oportunida<strong>de</strong>s, los agricultores negocian el producto con los comer -<br />
ciantes <strong>de</strong> Costa en <strong>la</strong>s p<strong>la</strong>zas agropecuarias. Estos comercien tes transportan el produc<br />
to para ven<strong>de</strong>rlo a los almacenes <strong>de</strong> Chic<strong>la</strong>yo o Trujillo, don<strong>de</strong> a través <strong>de</strong> minoristas<br />
lo hacen llegar a los consumidores. El abastecimiento local se realiza a través <strong>de</strong> los<br />
agricultores, quienes llevan el producto a los mercados locales o a <strong>la</strong>s p<strong>la</strong>zas agrope —<br />
cuarias para negociarlo con los comerciantes minoristas, los que, a su vez, lo hacen<br />
llegar a los consumidores.<br />
El maiz es normalmente negociado en grano y por arrobas y, excepcional men te, en ma<br />
zorcas y por sacos. El <strong>de</strong>sgme lo asume el agricultura y los envases son proporcionados<br />
por los comerciantes.<br />
La producción <strong>de</strong> maíz choclo es comercializada directamente entre el agricultor y el<br />
comerciante <strong>de</strong> Costa, quien concentra en <strong>la</strong>s chacras volúmenes suficientes para complegar<br />
fletes a<strong>de</strong>cuados <strong>de</strong> carga. El producto es negociado por cientos, selecciona -<br />
do, puesto en chacra y transportado por el comprador hacia los mercados <strong>de</strong> consumo ,<br />
ddn<strong>de</strong> a través <strong>de</strong> minoristas llega a los consumidores. Para el mercado local, intervie<br />
ne el productor, quien transporta el producto a los centros <strong>de</strong> merca<strong>de</strong>o, don<strong>de</strong> negó -<br />
cía con los minoristas que lo hacen llegar a los consumidores. Excepcional men te, los<br />
productores ven<strong>de</strong>n directamente a los consumidores.<br />
Los agricultores negocian el rastrojo <strong>de</strong>l maíz con los comerciantes <strong>de</strong> ganado. En algu<br />
ñas oportunida<strong>de</strong>s, lo arriendan a un precio que osci<strong>la</strong> entre S/.500.00 y S/. 1,000.00"<br />
por Ha.; en otras, el arriendo se realiza a cambio <strong>de</strong> <strong>la</strong> preparación <strong>de</strong>l terreno. El<br />
patrón <strong>de</strong> cambio más utilizado es <strong>la</strong> yunta <strong>de</strong> trabajo; así se observa que una hectárea<br />
requiere <strong>de</strong> 5 yuntas en término medio, teniendo el comerciante <strong>la</strong> opción <strong>de</strong> <strong>de</strong>volver<br />
el terreno arado o entregar <strong>la</strong>s yuntas alqui<strong>la</strong>das para que el agricultor realice <strong>la</strong> ope -<br />
ración. El alquiler <strong>de</strong> <strong>la</strong> yunta tiene un valor que varía <strong>de</strong> S/. 100.00 a S/. 150.00por<br />
día.<br />
(4). Funciones y Servicios <strong>de</strong> Comercialización<br />
(a).<br />
Acopio y Preparación Comercial<br />
El agricultor recoge <strong>la</strong>s mazorcas en panca y <strong>la</strong>s hace secar en eras especiales .<br />
Posteriormente, <strong>la</strong>s <strong>de</strong>spancan y <strong>la</strong>s <strong>de</strong>sgranan, <strong>la</strong>bor que pue<strong>de</strong> ser realizada en<br />
forma manual o con <strong>la</strong> ayuda <strong>de</strong> pequeñas <strong>de</strong>sgranadoras mecánicas. El producto<br />
es ensacado, cosido y vendido a los negociantes intermediarios, quienes lo pesan<br />
y concentran <strong>la</strong> producción en sus <strong>de</strong>pósitos particu<strong>la</strong>res.<br />
(b).<br />
Envase y Transporte<br />
El agricultor envasa el maíz grano en sacos <strong>de</strong> yute usado que tienen una capacidad<br />
media <strong>de</strong> 8 arrobas (92 Kg.). El transporte a los centros <strong>de</strong> consumo se realj^<br />
za por medio <strong>de</strong> camiones que tienen una capacidad <strong>de</strong> 80 a 90 sacos <strong>de</strong> maíz gra<br />
no . El valor <strong>de</strong>l flete varía entre S/.0.60 y S/. 1.00 por Kg. y está en re<strong>la</strong>ción<br />
con <strong>la</strong> distancia a los centros <strong>de</strong> consumo.
Pág. 472 ZONA NORTE DE CAJAMARCA<br />
e. Comercialización <strong>de</strong> Arveja Ver<strong>de</strong><br />
La producción <strong>de</strong> arveja ver<strong>de</strong> tiene una inci<strong>de</strong>ncia significativa en<br />
<strong>la</strong> economfa regional por <strong>la</strong> participación <strong>de</strong> este producto en los flujos comerciales. De<br />
acuerdo a los estimados <strong>de</strong> ONERN, <strong>la</strong> superficie ocupada por este cultivo fue <strong>de</strong> 1,7<strong>45</strong> Ha.<br />
en <strong>la</strong> campaña <strong>de</strong> 1975.<br />
(1). Oferta<br />
La producción estimada por ONERN para el año 1975 fue <strong>de</strong> 2,269 T.Mo^ con un va<br />
lor <strong>de</strong> S/o 13"613,000.00, que representó el 1 A% y el 2.7%, respectivamente, <strong>de</strong><br />
<strong>la</strong> producción agríco<strong>la</strong>,, La oferta se presenta normalmente entre los meses <strong>de</strong> Mayo<br />
y Setiembre <strong>de</strong> todos los años,, Las varieda<strong>de</strong>s <strong>de</strong>nominadas "b<strong>la</strong>nca" o "arvejón" ,<br />
"celeste" y "cuarentón" son <strong>la</strong>s mas difundidas en <strong>la</strong> región.. La participación <strong>de</strong> ca<br />
da uno <strong>de</strong> los sectores se muestra en el Cuadro N 0 53-DA, <strong>de</strong>stacando <strong>la</strong> provincia<br />
<strong>de</strong> Cajamarca,, en el Sector llj, con el 53.7% <strong>de</strong> <strong>la</strong> producción,<br />
(2) „ Mercados<br />
La producción regional se distribuye entre los mercados <strong>de</strong> Lima^ Chic<strong>la</strong>yo y Trujillo,<br />
que consumen 30% el primero y 15% cada uno <strong>de</strong> los últimos» El 40% restante se<br />
<strong>de</strong>stina ai consumo interno^ <strong>de</strong>stacando, principalmente, el mercado <strong>de</strong> Cajamarca .<br />
Los mercados <strong>de</strong> Chic<strong>la</strong>yo y Trujillo ssrven,. a <strong>la</strong> vez, para redistribuir el producto<br />
hacía los mercados <strong>de</strong> <strong>la</strong> Costa Norte <strong>de</strong>l país* don<strong>de</strong> Piura y Chimbóte participan<br />
activamente o<br />
(3) 0 Sistemas <strong>de</strong> Comercialización<br />
La modalidad más difundida <strong>de</strong>l comercio <strong>de</strong> <strong>la</strong> arveja ver<strong>de</strong> es <strong>la</strong> que se realiza mediante<br />
los comerciantes intermediarlos que se insta<strong>la</strong>n en <strong>la</strong>s "salidas" <strong>de</strong> <strong>la</strong>s carrete<br />
ras o en <strong>de</strong>pósitos domiciliarios <strong>de</strong> los centros urbanos para adquirir <strong>de</strong> los agricultores<br />
el producto cosechado. La unidad <strong>de</strong> venta es el saco que, aproximadamente t<br />
tiene una capacidad <strong>de</strong> 50 a 60 Kg o El intermediario transporta el producto a los<br />
mercados <strong>de</strong> consumo a través <strong>de</strong> <strong>la</strong>s carreteras <strong>de</strong> Pacasmayo y Chic<strong>la</strong>yo, <strong>de</strong> acuerdo<br />
a <strong>la</strong> proce<strong>de</strong>ncia <strong>de</strong>l producto. En los centros <strong>de</strong> consumo, los intermediarios negocian<br />
con los mayoristas, quienes lo hacen llegar a los consumidores a través <strong>de</strong> Sos<br />
comerciantes minoristas.<br />
En menor proporción, los agricultores acostumbran a negociar el producto en <strong>la</strong>s p<strong>la</strong>zas<br />
agropecuarias <strong>de</strong> <strong>la</strong> región a través <strong>de</strong> comerciantes intermedíarioSo En <strong>la</strong> cam -<br />
paña <strong>de</strong> 1975, el precio <strong>de</strong> <strong>la</strong> arveja ver<strong>de</strong> osciló entre S/.300c00 y S/.600.00 el<br />
saco <strong>de</strong> 50 a 60 Kg o
DIAGNOSTICO AGROPECUARIO Pág. 473<br />
CUADRO N 0 53-DA<br />
PARTICIPACIÓN DE LOS SECTORES EN LA OFERTA REGIONAL DE ARVEJA VERDE<br />
(1974-1975)<br />
Sectores<br />
Subsectores<br />
(Provincias)<br />
t<br />
Area Anual<br />
Ha.<br />
%<br />
Volumen<br />
TM<br />
%<br />
Soles<br />
Valor<br />
%<br />
1<br />
Cutervo<br />
Chota<br />
Santa Cruz<br />
Hualgayoc<br />
317<br />
282<br />
86<br />
18.2<br />
16.1<br />
4,9<br />
412<br />
367<br />
112<br />
18.2<br />
16.1<br />
4.9<br />
2,473<br />
2,200<br />
671<br />
18.2<br />
16.1<br />
4,9<br />
II<br />
Cajamarca<br />
San Miguel<br />
Contumazá<br />
937<br />
101<br />
22<br />
53,7<br />
5,8<br />
1.3<br />
1,218<br />
131<br />
29<br />
53.7<br />
5.8<br />
1.3<br />
7,309<br />
788<br />
172<br />
53,7<br />
5.8<br />
1,3<br />
Total<br />
1,7<strong>45</strong><br />
100.0<br />
2,269<br />
100.0<br />
13,613<br />
100,0<br />
Fuente : ONERN-<br />
(4)o<br />
Funciones y Servicios <strong>de</strong> Comercialización<br />
(a)o<br />
Acopio y Preparación Comercial<br />
La arveja es cosechada por el agricultor con <strong>la</strong> ayuda <strong>de</strong> <strong>la</strong>tas o alforjas, siendo<br />
posteriormente ensacada para su transporte hacia <strong>la</strong> "salida" <strong>de</strong> carretera. El<br />
comerciante intermediario también concentra el producto en <strong>la</strong>s "salidas"© en<br />
los <strong>de</strong>pósitos domiciliarios, don<strong>de</strong> trasvasa <strong>la</strong> arveja a envases <strong>de</strong> yute <strong>de</strong> ma -<br />
yor capacidad (90 a 120 Kg). Este envase es cubierto con una mal<strong>la</strong> <strong>de</strong> pesca<br />
o con paja, existiendo <strong>la</strong> ten<strong>de</strong>ncia al uso <strong>de</strong> <strong>la</strong>s mal<strong>la</strong>s para facilitar <strong>la</strong> circu<br />
loción <strong>de</strong>l aire en el transporte. No hay normas establecidas para c<strong>la</strong>sificar el<br />
producto a base <strong>de</strong> calidad, diferenciándose únicamente por <strong>la</strong>s características<br />
varietales.<br />
(b).<br />
Transporte<br />
El producto es transportado en camiones a los mercados <strong>de</strong> consumo, pagándose<br />
un flete que varió entre S/.80.00 y S/.90.00 por saco, cuando se <strong>de</strong>stinó al<br />
mercado <strong>de</strong> Lima y entre S/.40.00 y S/.50.00 por sacó, cuando fue a los mer -<br />
cados <strong>de</strong> Chic<strong>la</strong>yo o Trujillo. El valor <strong>de</strong>l flete al principal mercado regional<br />
(Cajamarca) varió entre S/.30.00 y S/.40.00 por saco.
Pá CTí 474 ZONA NORTE DE CAJAMARCA<br />
o<br />
f. Comercialización <strong>de</strong> Productos Hidrobiológicos<br />
El abastecimiento regional <strong>de</strong> productos hidrobiológicos se encuentra<br />
implementando con los servicios que presta el Frigonfico Pesquero Zonal (F.P.Z.) <strong>de</strong> Chota<br />
y con <strong>la</strong> participación (<strong>de</strong>sor<strong>de</strong>nada) <strong>de</strong> los comerciantes particu<strong>la</strong>res. La pesca en [os<br />
ríos y <strong>la</strong>gunas <strong>de</strong> <strong>la</strong> región es muy limitada, practicándose so<strong>la</strong>mente con fines recreativos .<br />
Existen especies nativas y truchas sembradas en años anteriores por <strong>la</strong> Estación <strong>de</strong> Pesquería<br />
<strong>de</strong> Cajamarca - Baños <strong>de</strong>l Inca, no habiéndose efectuado los resiembros necesarios para fomentar<br />
su conservación y reproducción.<br />
']). Oferta y Mercados<br />
De acuerdo a^s informaciones <strong>de</strong>l F.P.Z. <strong>de</strong> Chota, <strong>la</strong> región fue abastecida por esta<br />
institución, en el período <strong>de</strong> Junio <strong>de</strong> 1974 a Mayo <strong>de</strong> 1975, con 108,670 Kg. <strong>de</strong> pescado;<br />
<strong>la</strong> participación <strong>de</strong>l pescado conge<strong>la</strong>do fue <strong>de</strong> aproximadamente el 90% <strong>de</strong> ese<br />
<strong>volumen</strong> y <strong>la</strong> diferencia estuvo representada por el pescado fresco. El pescado seco-sa<br />
<strong>la</strong>do (salpresa) intervino en <strong>la</strong> oferta con 24,974 Kg. y, en forma complementaria, se<br />
consumió 39,266 <strong>la</strong>tas <strong>de</strong> conservas <strong>de</strong> pescado.<br />
El valor <strong>de</strong> estos productos fue <strong>de</strong> S/.2'75B,660.00, <strong>de</strong> los cuales el 55% correspondió<br />
a pescado conge<strong>la</strong>do, el 20% a conservas en<strong>la</strong>tadas <strong>de</strong> pescado, el 10% a pescado se -<br />
co-sa<strong>la</strong>do (salpresa), igual porcentaje a los alimentos preparados a base <strong>de</strong> pescado y<br />
el 5% restante correspondió al valor <strong>de</strong>l pescado fresco, respectivamente. Respecto a<br />
los centros <strong>de</strong> producción, el pescado conge<strong>la</strong>do que consume <strong>la</strong> región proviene <strong>de</strong> <strong>la</strong>s<br />
insta<strong>la</strong>ciones pesqueras <strong>de</strong> Paita, Parachique y Lima; el pescado fresco proce<strong>de</strong> <strong>de</strong> <strong>la</strong>s<br />
zonas <strong>de</strong> San José y Santa Rosa, mientras <strong>la</strong>s conservas son remitidas <strong>de</strong> <strong>la</strong>s insta<strong>la</strong>ciones<br />
que tiene EPSEP en los puertos <strong>de</strong> lio y Paita.<br />
Los principales mercados <strong>de</strong> consumo están constituidos por los subsectores <strong>de</strong> Hualga -<br />
yoc. Chota, Cutervo y Santa Cruz, siendo los centros urbanos <strong>de</strong> Bambamarca y Cutervo,<br />
los mayores consumidores. La <strong>de</strong>manda total <strong>de</strong> pescado y mariscos <strong>de</strong> <strong>la</strong> región se<br />
estima en 570 TM asumiéndose que <strong>la</strong> diferencia no ofertada por el F.P.Z. <strong>de</strong> Chota es<br />
cubierta por los comerciantes <strong>de</strong> pescado particu<strong>la</strong>res.<br />
'2).<br />
Sistemas <strong>de</strong> Comercialización<br />
El abastecimiento <strong>de</strong> productos hidrobiológicos se realizó bajo dos modalida<strong>de</strong>s :<br />
(a). Sistema Tradicional <strong>de</strong> Merca<strong>de</strong>o <strong>de</strong> Pescado<br />
Los comerciantes intermediarios acopian <strong>de</strong> los pescadores el producto y luego es<br />
transportado a los mercados <strong>de</strong> consumo. Normalmente, ellos mismos lo hacen lie<br />
gar a los consumidores y, en escasas oportunida<strong>de</strong>s, a través <strong>de</strong> minoristas. El pro<br />
ducto que comercian con mayor frecuencia es el pescado seco-sa<strong>la</strong>do. Los precios<br />
se rigen <strong>de</strong> acuerdo a <strong>la</strong> oferta y <strong>la</strong> <strong>de</strong>manda, realizándose <strong>la</strong> venta por unida<strong>de</strong>s ,<br />
sin usar el sistema <strong>de</strong> venta por Kg. La participación <strong>de</strong> este sistema se estimó en
DIAGNOSTICO AGROPECUARIO Pág. 475<br />
70% <strong>de</strong> los volúmenes totales comercializados en <strong>la</strong> región.<br />
(b). Sistema Estatal <strong>de</strong> Comercialización <strong>de</strong> Pescado<br />
Las funciones principales <strong>de</strong> <strong>la</strong> Empresa Pública <strong>de</strong> Servicios Pesqueros (EPSEP) en<br />
<strong>la</strong> región son <strong>la</strong>s <strong>de</strong> promover el consumo <strong>de</strong> pescado y regu<strong>la</strong>r los precios en bene<br />
ficio <strong>de</strong>l consumidor, limitando, hasta don<strong>de</strong> sea posible, <strong>la</strong> participación <strong>de</strong> los<br />
comerciantes intermediarios. Para tal fin, <strong>la</strong> EPSEP administra el Frigorífico Pesquero<br />
Zonal <strong>de</strong> Chota, don<strong>de</strong> dispone <strong>de</strong> una cámara frigorífica con una capaci -<br />
dad física <strong>de</strong> 10 TM <strong>de</strong> pescado conge<strong>la</strong>do.<br />
La EPSEP compra el pescado a precios que varían <strong>de</strong> acuerdo a <strong>la</strong> oferta y<strong>la</strong> <strong>de</strong>man<br />
da, siendo conge<strong>la</strong>do en <strong>la</strong>s insta<strong>la</strong>ciones especiales que posee en el litoral, ha -<br />
ciéndolo llegar al F.P.Z. <strong>de</strong> Chota en camiones isotérmicos y poniéndolo al al -<br />
canee <strong>de</strong> los consumidores por medio <strong>de</strong> puestos <strong>de</strong> venta estratégicamente ubica -<br />
dos en los centros urbanos. Para <strong>la</strong> distribución a los lugares apartados, se han es<br />
tablecido rutas y días <strong>de</strong>terminados, con el fin <strong>de</strong> facilitar el abastecimiento re -<br />
gional y tratando <strong>de</strong> que sea cubierto el mayor ámbito posible <strong>de</strong> <strong>la</strong> zona <strong>de</strong> inci<strong>de</strong>ncia.<br />
La eficiencia <strong>de</strong> <strong>la</strong> <strong>la</strong>bor que cumple <strong>la</strong> EPSEP se encuentra limitada por<br />
<strong>la</strong> carencia <strong>de</strong> una a<strong>de</strong>cuada implementación en los servicios <strong>de</strong> transporte.<br />
(3). Principales Funciones y Servicios <strong>de</strong> Comercialización<br />
(a). Acopio y Preparación Comercial<br />
El EPSEP realiza el acopio <strong>de</strong>l pescado conge<strong>la</strong>do y fresco en el F.P.Z. <strong>de</strong> Chora,<br />
envasándolo en cajas térmicas <strong>de</strong> plástico que tienen una capacidad que varía <strong>de</strong><br />
16 a 20 Kg., <strong>de</strong> acuerdo a <strong>la</strong> especie por distribuir. Comercialmente, el producto<br />
es preparado para su venta como pescado fresco, conge<strong>la</strong>do, fileteado, <strong>de</strong>svisce<br />
rado y sin cabeza y como pescado seco-sa<strong>la</strong>do (salpresa). También, en ese mismo<br />
frigorífico, son concentradas <strong>la</strong>s remesas <strong>de</strong> conservas <strong>de</strong> pescado. Las especies<br />
conge<strong>la</strong>das que tienen mayor aceptación regional son <strong>la</strong> merluza, <strong>la</strong> cojinova y e!<br />
¡urel. Al estado fresco, <strong>la</strong> <strong>de</strong>manda es mayor por el "coco" y, al estado <strong>de</strong> sclpre<br />
sa, <strong>la</strong> venta <strong>de</strong> <strong>la</strong> cabal<strong>la</strong> y <strong>de</strong>l ¡urel son <strong>la</strong>s <strong>de</strong> mayor significación.<br />
El pescado seco-sa<strong>la</strong>do, en el comercio tradicional, es emba<strong>la</strong>do en sacos <strong>de</strong> yu -<br />
te que tienen una capacidad para 300 unida<strong>de</strong>s; mientras que, en el comercio <strong>de</strong><br />
<strong>la</strong> empresa estatal, se usan cajas térmicas <strong>de</strong> plástico, que le dan un alto grado <strong>de</strong><br />
higiene y conservación.<br />
(b). Precios y Regu<strong>la</strong>ción<br />
En el comercio <strong>de</strong> productos hidrobiológicos se nota cierta regu<strong>la</strong>ción en los pre —<br />
cios por <strong>la</strong> inci<strong>de</strong>ncia <strong>de</strong> <strong>la</strong> EPSEP en <strong>la</strong> <strong>de</strong>manda regional. El F.P.Z. <strong>de</strong> Chotafí<br />
¡a los precios <strong>de</strong> venta <strong>de</strong> acuerdo al valor inicial <strong>de</strong>l producto más los costos <strong>de</strong><br />
flete y gastos administrativos. Los precios, entre 1974 y 1975, variaron entre S/.<br />
9.00 y S/.25.00 el Kg. para el pescado conge<strong>la</strong>do.
Pág, 476 ZONA NORTE DE CAJAMARCA<br />
. Los precios en el Sector II, especialmente en Contumazá, San Pablo y Chilete,<br />
juegan con mayor libertad, por encontrarse exclusivamente en manos <strong>de</strong> los comer<br />
ciantes intermediarios. La EPSEP opera so<strong>la</strong>mente en el Sector I, con <strong>la</strong>s limita -<br />
clones que le impone <strong>la</strong> infraestructura técnico-administrativa.<br />
3. Otras Activida<strong>de</strong>s Económicas<br />
a. Sector Industrial<br />
(1). Estructura y Características Generales<br />
La actividad industrial en <strong>la</strong> zona <strong>de</strong> estudio es incipiente, con una infraestructura o -<br />
rientada al procesamiento simple <strong>de</strong> productos agropecuarios, por lo que su impacto en<br />
<strong>la</strong> economía regional es casi nulo. Provee <strong>de</strong> alimentos y productos primarios tanto a<br />
<strong>la</strong> región como a <strong>la</strong>s zonas costeras, pero <strong>la</strong> <strong>de</strong>ficiente integración social y escaso <strong>de</strong> -<br />
sarrollo económico observado a nivel regional en Cajamarca ha originado un crecimien<br />
to industrial ínfimo y notoriamente <strong>de</strong>sequilibrado en comparación con otras zonas <strong>de</strong>l<br />
país.<br />
Esta situación se <strong>de</strong>be fundamentalmente a <strong>la</strong> falta <strong>de</strong> recursos económicos, financie -<br />
ros, tecnológicos y energéticos, así como a <strong>la</strong> limitada atención dispensada por los organismos<br />
encargados <strong>de</strong> p<strong>la</strong>nificar su <strong>de</strong>sarrollo, <strong>de</strong> acuerdo a lo consi<strong>de</strong>rado en <strong>la</strong> Ley<br />
General <strong>de</strong> Industrias (D.L. 18350) y en <strong>la</strong> <strong>de</strong> Descentralización Industrial (D.L.<br />
18977).<br />
La inversión presupuestada para los bienios 1971-1972 y 1973-1974, en <strong>la</strong> subregiónCa<br />
¡amarca, se orientó principalmente a crear infraestructura <strong>de</strong> transporte y a apoyar a<br />
<strong>la</strong>s activida<strong>de</strong>s agropecuaria y minera, en tanto que los sectores consi<strong>de</strong>rados dinámicos<br />
tanto por su velocidad <strong>de</strong> crecimiento como por <strong>la</strong> repercusión que tienen sobre otros sec<br />
tores <strong>de</strong> <strong>la</strong> economía, como <strong>la</strong> industria y el turismo, recibieron asignaciones presupues<br />
tales poco significativas, especialmente en el bienio 1973-1974. Estas limitaciones pre<br />
supuestales se hacen más negativas si se tiene en cuenta que Cajamarca recibió una a-<br />
signación presupuesta! mínima y que <strong>la</strong> mayor proporción <strong>de</strong> esa inversión se concentró<br />
en dicha ciudad, todo lo cual ha contribuido al estancamiento <strong>de</strong> <strong>la</strong> estructura producti<br />
—<br />
va.<br />
La Estadística Industrial para el año 1973 muestra que el <strong>de</strong>partamento <strong>de</strong> Cajamarca tu<br />
vo un valor bruto <strong>de</strong> producción industrial para ese año <strong>de</strong> S/. 1,174'775,000.00<br />
- ,<br />
que generó un valor agregado <strong>de</strong> S/.<strong>45</strong>8 , 6<strong>45</strong> / 000.00; por no contarse con una buena ba<br />
se <strong>de</strong> información para <strong>la</strong> zona estudiada, se hace difícil calcu<strong>la</strong>r los valores <strong>de</strong>sagrega<br />
dos correspondientes pero, consi<strong>de</strong>rando que el valor bruto <strong>de</strong> producción, a nivel <strong>de</strong> ~<br />
partamental, representó el 0.6% <strong>de</strong>l valor bruto <strong>de</strong> <strong>la</strong> producción nacional, se colige<br />
<strong>la</strong> mínima inci<strong>de</strong>ncia <strong>de</strong> esta actividad industrial en <strong>la</strong> economía nacional.
DIAGNOSTICO AGROPECUARIO Pág. 477<br />
En base a <strong>la</strong> información proporcionada tanto por los diferentes concejos distritales como<br />
por otras instituciones, asf como por <strong>la</strong> obtenida en el trabajo <strong>de</strong> campo realizado<br />
por ONERN, se ha <strong>de</strong>tectado <strong>la</strong> existencia <strong>de</strong> hasta 504 establecimientos <strong>de</strong>dicados a<br />
activida<strong>de</strong>s industriales, los que figuran agrupados, según su rubro y ubicación, en el<br />
Cuadro N 0 54-DA. Se observa que el 73.2% <strong>de</strong> los establecimientos industriales están<br />
ubicados en el Sector I (Norte), mientras que el 26.8% correspon<strong>de</strong> al Sector II (Sur) ,<br />
<strong>de</strong>stacando Cutervo y Chota, por tener el mayor número <strong>de</strong> establecimientos industria -<br />
les, representados principalmente por <strong>la</strong>s unida<strong>de</strong>s <strong>de</strong> producción <strong>de</strong> chancaca.<br />
En <strong>la</strong> zona, se cuenta con abundantes recursos naturales y humanos, estando éstos en<br />
notoria <strong>de</strong>sventaja y atraso en cuanto se refiere a capacitación y tecnologTa. Hay dis<br />
ponibilidad <strong>de</strong> mano <strong>de</strong> obra para <strong>la</strong> industria proveniente <strong>de</strong>l exce<strong>de</strong>nte que emigra <strong>de</strong>l<br />
sector agropecuario y <strong>de</strong> los <strong>de</strong>socupados, cuyo nivel <strong>de</strong> capacitación es muy bajo» La<br />
pob<strong>la</strong>ción <strong>de</strong>dicada a <strong>la</strong> pequeña industria es numerosa y está constituida por empresa -<br />
rios que, sin asistencia técnica y crediticia, <strong>la</strong>boran con una tecnología "na<strong>de</strong>cuada y<br />
emplean equipos anticuados y obsoletos, <strong>de</strong> procesado mayormente doméstico, afectan<br />
do con ello <strong>la</strong> calidad, cantidad, costos, precios y beneficios <strong>de</strong> sus productos, a los<br />
que <strong>de</strong>be sumarse un sistema <strong>de</strong> comercialización <strong>de</strong>ficiente.<br />
Se estima que el sector manufacturero da ocupación a aproximadamente 1,<strong>03</strong>4 trabajadores,<br />
entre empleados y obreros, lo que representa el 0.39% <strong>de</strong> <strong>la</strong> pob<strong>la</strong>ción total y<br />
el 1 ,62% <strong>de</strong> <strong>la</strong> pob<strong>la</strong>ción económicamente activa <strong>de</strong> <strong>la</strong> zona <strong>de</strong> estudio.<br />
Entre los establecimientos industriales que <strong>de</strong>stacan por su <strong>volumen</strong> y valor <strong>de</strong> produc -<br />
ción se encuentran los que fabrican queso y mantequil<strong>la</strong> y los que e<strong>la</strong>boran chancaca y<br />
aguardiente <strong>de</strong> caño, asT como los <strong>de</strong>dicados a <strong>la</strong> pana<strong>de</strong>ria y a <strong>la</strong> fabricación <strong>de</strong> bebí<br />
das gaseosas, notándose <strong>la</strong> ausencia <strong>de</strong> producción <strong>de</strong> bienes <strong>de</strong> capital; en cambio, <strong>la</strong><br />
pequeña y mediana industria existente no tiene significación económica, tanto por el<br />
bajo valor <strong>de</strong> su producción como por los niveles <strong>de</strong> productividad, lo que aunado a<br />
un reducido mercado origina un bajo ingreso y un mmimo valor agregado.<br />
La actividad industrial tiene estrecha re<strong>la</strong>ción con <strong>la</strong> producción agropecuaria, estando<br />
constituidos <strong>la</strong> casi totalidad <strong>de</strong> los principales insumos utilizados por recursos <strong>de</strong> <strong>la</strong> re<br />
gión; tal es el caso <strong>de</strong> <strong>la</strong>s p<strong>la</strong>ntas <strong>de</strong> transformación primaria, como los trapiches para<br />
<strong>la</strong> fabricación <strong>de</strong> chancaca y aguardiente <strong>de</strong> caña <strong>de</strong> azúcar y los molinos para granos.<br />
También se realiza <strong>la</strong> transformación <strong>de</strong> algunos productos alimenticios, obteniéndose<br />
queso, mantequil<strong>la</strong> y, en menor proporción, choco<strong>la</strong>te y jamón, e<strong>la</strong>borados a nivel fa<br />
miliar y/o <strong>de</strong> pequeña empresa, siguiendo técnicas tradicionales y con limitado impac<br />
to económico.<br />
La producción industrial se comercializa en <strong>la</strong> zona o fuera <strong>de</strong> el<strong>la</strong>; asi", <strong>la</strong>s industrias<br />
<strong>de</strong> pana<strong>de</strong>ría, <strong>de</strong> mol ¡nena y <strong>de</strong> e<strong>la</strong>boración <strong>de</strong> bebidas gaseosas comercializan el<br />
100% <strong>de</strong> sus productos en <strong>la</strong> región, mientras otras industrias, como <strong>la</strong> <strong>de</strong> aguardiente<br />
<strong>de</strong> caña, <strong>de</strong> chancaca, <strong>de</strong> queso y <strong>de</strong> mantequil<strong>la</strong>, ven<strong>de</strong>n sus productos <strong>de</strong>ntro o fuera<br />
<strong>de</strong> <strong>la</strong> zona. La falta <strong>de</strong> p<strong>la</strong>nificación en el sistema <strong>de</strong> producción, el mercado, <strong>la</strong> intervención<br />
<strong>de</strong> comerciantes intermediarios, <strong>la</strong> carencia <strong>de</strong> medios propios <strong>de</strong> transporte
CUADRO N° 54-DA<br />
13<br />
OQ<br />
ESTABLECIMIENTOS INDUSTRIALES POR ACTIVIDAD Y SUBSECTORES<br />
Actividad<br />
Cutervo<br />
Chota<br />
Sector<br />
Sta, Cruz<br />
I<br />
Hualgayoc<br />
Subtotal<br />
Cajamarca<br />
Sector II<br />
San Miguel C entuma zá<br />
Subtotal<br />
TOTAL<br />
Industria <strong>de</strong> AttSmentos<br />
Fabricación <strong>de</strong> queso y mantequil<strong>la</strong><br />
Manufactura <strong>de</strong> productos <strong>de</strong> pana<strong>de</strong>rfa<br />
Preparación y conservación <strong>de</strong> carnes<br />
Manufactura <strong>de</strong> productos <strong>de</strong> molino<br />
E<strong>la</strong>boración <strong>de</strong> chancaca<br />
E<strong>la</strong>boración <strong>de</strong> he<strong>la</strong>dos<br />
Fabricación <strong>de</strong> choco<strong>la</strong>te<br />
MI<br />
13<br />
2<br />
134<br />
1<br />
1<br />
90<br />
2<br />
16<br />
2<br />
67<br />
1<br />
2<br />
27<br />
3<br />
1<br />
23<br />
36<br />
1<br />
21<br />
6<br />
4<br />
3<br />
1<br />
304<br />
3<br />
53<br />
6<br />
9<br />
224<br />
5<br />
4<br />
67<br />
1<br />
10<br />
2<br />
53<br />
1<br />
33<br />
2<br />
8<br />
"4<br />
18<br />
1<br />
11<br />
5<br />
6<br />
3<br />
114<br />
3<br />
23<br />
12<br />
74<br />
2<br />
418<br />
6<br />
76<br />
6<br />
21<br />
298<br />
7<br />
4<br />
Industria <strong>de</strong> Bebidas<br />
E<strong>la</strong>boración <strong>de</strong> aguardiente <strong>de</strong> caña<br />
Fabricación <strong>de</strong> bebidas gaseosas<br />
12<br />
11<br />
1<br />
11<br />
15<br />
2<br />
8<br />
8<br />
><br />
1<br />
2<br />
39<br />
34<br />
5<br />
1<br />
9<br />
2<br />
2<br />
1<br />
1<br />
12<br />
12<br />
11<br />
46<br />
5<br />
Industria <strong>de</strong> <strong>la</strong> Ma<strong>de</strong>ra<br />
Aserra<strong>de</strong>ros y/o talleres dé acepil<strong>la</strong>dura<br />
1<br />
1<br />
J<br />
2<br />
T"<br />
1<br />
3<br />
A,<br />
6<br />
-1<br />
4.<br />
4<br />
1<br />
1<br />
_5<br />
5<br />
11<br />
11<br />
Industria Textil<br />
Hi<strong>la</strong>doss<br />
Fábrica <strong>de</strong> tejidos <strong>de</strong> punto<br />
Industrias diversas<br />
Talleres <strong>de</strong> mecánica<br />
Talleres ff.adíotícnicoS<br />
Imprentas<br />
TOTAL<br />
"VALOR PORCENTUAL<br />
• '<br />
: -<br />
2<br />
1<br />
1<br />
166<br />
_4<br />
.3<br />
1<br />
2<br />
1<br />
1<br />
115<br />
-<br />
:<br />
_:<br />
m<br />
35<br />
9<br />
9<br />
3<br />
1<br />
2<br />
53<br />
13<br />
3<br />
10<br />
J_<br />
3<br />
3<br />
1<br />
369<br />
73.2<br />
X<br />
1<br />
2.<br />
1<br />
1<br />
79<br />
^<br />
,<br />
w<br />
x<br />
1<br />
m<br />
40<br />
„<br />
.<br />
-<br />
16<br />
_1_<br />
1<br />
i<br />
2<br />
1<br />
135<br />
26.8<br />
14<br />
3<br />
11<br />
-24<br />
5<br />
4<br />
1<br />
504<br />
100.0<br />
N<br />
O<br />
Z<br />
><br />
Z<br />
O<br />
70<br />
H<br />
tn<br />
a<br />
tn<br />
n<br />
><br />
•—i<br />
><br />
Fuente: Concejos Distritales.<br />
Banco <strong>de</strong> <strong>la</strong> Nación .<br />
ONERN.<br />
><br />
O<br />
>
DIAGNOSTICO AGROPECUARIO Rág. 479<br />
. y <strong>la</strong> <strong>de</strong>ficiente red vial, hacen dificil <strong>la</strong> comercialización industrial, lo que ligado a<br />
<strong>la</strong> ausencia <strong>de</strong> un sistema <strong>de</strong> apoyo para asegurar servicios <strong>de</strong> asistencia técnica, origi<br />
—<br />
nan que esta actividad se mantenga en una etapa embrionaria.<br />
(2). Descripción <strong>de</strong> <strong>la</strong>s principales activida<strong>de</strong>s industriales<br />
(a). Industria <strong>de</strong> Productos Lácteos<br />
Esta actividad está orientada a <strong>la</strong> fabricación <strong>de</strong> queso y mantequil<strong>la</strong> y se lleva a<br />
cabo en unida<strong>de</strong>s <strong>de</strong> producción que, en su mayoría, están organizadas como em -<br />
presas familiares y, en mfnima inci<strong>de</strong>ncia, como empresas medianas. En el año<br />
1974, esta industria llegó a utilizar aproximadamente 7,500 TM <strong>de</strong> leche fresca ,<br />
cifra que representó el 61% <strong>de</strong> <strong>la</strong> producción total <strong>de</strong> <strong>la</strong> zona y por un valor aproxi<br />
mado <strong>de</strong> S/^S'OOO,000.00, lo que permitió e<strong>la</strong>borar 624 TM <strong>de</strong> queso y mante -<br />
quil<strong>la</strong>.<br />
La leche, que es <strong>la</strong> materia prima básica para <strong>la</strong> e<strong>la</strong>boración <strong>de</strong>l queso, se produce<br />
en <strong>la</strong> zona, mientras que los otros insumos, como <strong>la</strong> sal refinada, el fermento y<br />
el cuajo, se obtienen fuera <strong>de</strong> el<strong>la</strong>; aunque es común el empleo <strong>de</strong> cuajo <strong>de</strong> vacu<br />
no y ovino <strong>de</strong>l lugar. El precio <strong>de</strong> <strong>la</strong> leche varía entre dos y siete soles; por lo<br />
que los productores alejados <strong>de</strong> los centros pob<strong>la</strong>dos y sin medios <strong>de</strong> comunicación<br />
se ven obligados a negociar los quesillos o cuajadas a 20 soles el kilogramo (lo<br />
que equivale a ven<strong>de</strong>r el litro <strong>de</strong> leche entre dos y tres soles. El quesillo es trans<br />
formado posteriormente en queso mantecoso por el intermediario, mezclándolo mu<br />
chas veces con harina <strong>de</strong> papa o yuca con el único fin <strong>de</strong> conseguir un mayor peso<br />
en <strong>de</strong>smedro <strong>de</strong> su calidad. Las técnicas empleadas en esta industria siguen un pa<br />
trón tradicional, con <strong>de</strong>sconocimiento <strong>de</strong>l uso <strong>de</strong> <strong>la</strong>s bacterias lácticas cuya técni<br />
ca es aplicada en <strong>la</strong>s queserías mo<strong>de</strong>rnas para <strong>la</strong> obtención <strong>de</strong> productos <strong>de</strong> cali -<br />
dad. Como consecuencia <strong>de</strong>l uso <strong>de</strong> técnicas ina<strong>de</strong>cuadas dorante el proceso <strong>de</strong><br />
preparación <strong>de</strong>l queso, se presentan fuertes infecciones, lo que ligado a <strong>la</strong> falta<br />
<strong>de</strong> higiene y <strong>de</strong> una aci<strong>de</strong>z a<strong>de</strong>cuada, hace que se obtenga un producto perecible,<br />
existiendo <strong>la</strong> posibilidad <strong>de</strong> que proliferen bacterias patógenas que pue<strong>de</strong>n ocasio<br />
nar enfermeda<strong>de</strong>s a los consumidores.<br />
La mantequil<strong>la</strong> se e<strong>la</strong>bora en menor cantidad que el queso, siguiendo igualmente<br />
un procesamiento <strong>de</strong> escasa tecnología y empleando equipos antiguos y <strong>de</strong> uso manual.<br />
Su e<strong>la</strong>boración no guarda <strong>la</strong>s características que <strong>de</strong>be reunir una verda<strong>de</strong>ra<br />
industria; más bien se presenta como una alternativa ante <strong>la</strong> imposibilidad <strong>de</strong>l pro<br />
ductor a concurrir al mercado <strong>de</strong> leche fresca. Los envases utilizados para <strong>la</strong> comercialización<br />
<strong>de</strong> <strong>la</strong> mantequil<strong>la</strong> están constituidos por papel manteca y<br />
cajas <strong>de</strong> cartón parafinado <strong>de</strong> 1.0 libra <strong>de</strong> capacidad, aunque normalmente el pro<br />
ducto se ven<strong>de</strong> sólo en papel. - -.<br />
Los quesos se comercializan sin envase, empleándose rara vez el papel manteca;<br />
en <strong>la</strong> generalidad <strong>de</strong> los casos, éstos se adquieren en los mercados <strong>de</strong> Chic<strong>la</strong>yo y<br />
Trujillo, principalmente.
Pág. 480<br />
ZONA NORTE DE CAJAMARCA<br />
> Estos productos son puestos a <strong>la</strong> venta en <strong>la</strong> p<strong>la</strong>nta <strong>de</strong> e<strong>la</strong>boración, bien al público<br />
consumidor o a los intermediarios que absorben <strong>la</strong> casi totalidad <strong>de</strong>l producto<br />
para ven<strong>de</strong>rlo fuera <strong>de</strong> <strong>la</strong> zona, principalmente en <strong>la</strong>s ciuda<strong>de</strong>s <strong>de</strong> Chic<strong>la</strong>yo, Tru<br />
jillo y Lima.<br />
Actualmente, <strong>la</strong> Oficina Zonal <strong>de</strong> Cajamarca <strong>de</strong>l Instituto Nacional <strong>de</strong> P<strong>la</strong>nifica<br />
ción viene haciendo los estudios para <strong>la</strong> insta<strong>la</strong>ción <strong>de</strong> varias p<strong>la</strong>ntas <strong>de</strong> transformación<br />
<strong>de</strong> productos lácteos, básicamente queso y, como subproductos, mantequi<br />
lia, requesón y suero final, en zonas alejadas <strong>de</strong> los centros pob<strong>la</strong>dos y con escasos<br />
medios <strong>de</strong> comunicación, con el objeto <strong>de</strong> lograr un mejor aprovechamiento <strong>de</strong><br />
los recursos alimenticios, generar un mayor valor agregado en <strong>la</strong> producción pecua<br />
ria y satisfacer <strong>la</strong> <strong>de</strong>manda interna, sustituyendo <strong>la</strong> importación <strong>de</strong> productos lácteos,<br />
con el consecuente ahorro <strong>de</strong> divisas y apoyando el <strong>de</strong>sarrollo regional.<br />
Estos estudios cuentan con el apoyo <strong>de</strong> <strong>la</strong> Cooperación Técnica <strong>de</strong>l Gobierno Suizo<br />
(COTESU), a través <strong>de</strong>l Proyecto <strong>de</strong> Quesería Nacionales, por medio <strong>de</strong>l cual<br />
da asesoramiento técnico para <strong>la</strong> insta<strong>la</strong>ción <strong>de</strong> p<strong>la</strong>ntas queseras y capacitar perso<br />
nal técnico en <strong>la</strong> e<strong>la</strong>boración <strong>de</strong> productos lácteos. El financiamiento necesario<br />
para <strong>la</strong> insta<strong>la</strong>ción <strong>de</strong> estas p<strong>la</strong>ntas queseras está asegurado mediante <strong>la</strong> participación<br />
<strong>de</strong>l Banco Agrario, el Banco Industrial y un fondo especial <strong>de</strong>l Cantón <strong>de</strong> Ar<br />
govia <strong>de</strong> Suiza.<br />
(b). Industria <strong>de</strong> Bebidas Gasificadas<br />
Esta actividad industrial es efectuada por pocas fábricas, <strong>la</strong>s que utilizan insta<strong>la</strong>ciones<br />
y equipos anticuados, con bajos niveles <strong>de</strong> productividad y sin mayor ¡n -<br />
fluencia económica en <strong>la</strong> zona. En el año 1975, funcionaban 5 p<strong>la</strong>ntas, dando o<br />
cupación a 20 trabajadores estables, entre obreros y empleados, que <strong>la</strong>boraban ó<br />
dias a <strong>la</strong> semana en un turno diario <strong>de</strong> 8 horas; este horario estaba supeditado a<br />
<strong>la</strong> <strong>de</strong>manda <strong>de</strong>l producto que, en <strong>la</strong> mayorfa <strong>de</strong> los casos, era menor que <strong>la</strong> capacidad<br />
<strong>de</strong> producción insta<strong>la</strong>da.<br />
Las principales materias primas utilizadas son azúcar, gas carbónico y ácidos tartárico,<br />
fosfórico y cTtrico, asi" como colorantes y esencias que proce<strong>de</strong>n <strong>de</strong> Lima ,<br />
Chic<strong>la</strong>yo y Trujillo. Otros insumas empleados, tales como envases <strong>de</strong> vidrio para<br />
el embotel<strong>la</strong>miento y comercialización; cajas <strong>de</strong> ma<strong>de</strong>ra para almacenamiento y<br />
transporte y <strong>la</strong>s tapas <strong>de</strong> corona litografiadas, proce<strong>de</strong>n <strong>de</strong> Lima. Algunas empresas<br />
tienen botel<strong>la</strong>s litografiadas con diseño especial y otras utilizan indistintamen<br />
te envases propios y/o <strong>de</strong> otras p<strong>la</strong>ntas. Las empresas fabricantes e<strong>la</strong>boran diversos<br />
tipos y calida<strong>de</strong>s <strong>de</strong> bebidas gaseosas, habiéndose llegado a producir en el año<br />
1975 un total <strong>de</strong> 325,625 litros, con un valor bruto aproximado <strong>de</strong> S/.<br />
2'220,000.00. Estos volúmenes se presentan en forma <strong>de</strong>sagregada y por fábricas<br />
en el Cuadro N 0 55-DA.<br />
La producción <strong>de</strong> <strong>la</strong> zona se comercializa a través <strong>de</strong> minoristas que utilizan diver<br />
sos medios <strong>de</strong> transporte para hacer<strong>la</strong> llegar a los consumidores; estas medios pue<strong>de</strong>n<br />
ser vehículos (don<strong>de</strong> hay caminos carrozables) o acémi<strong>la</strong>s (para distribución cer
DIAGNOSTICO AGROPECUARIO Pag. 481<br />
cana o para el área rural que no cuenta con carreteras). Uno <strong>de</strong> los principales<br />
problemas que afronta esta industria es <strong>la</strong> competencia por parte <strong>de</strong> otras fábricas<br />
y embotel<strong>la</strong>doras ubicadas en Chic<strong>la</strong>yo y Tru¡illo, <strong>la</strong>s que proyectan parte <strong>de</strong> su<br />
producción a esta zona, lo que, agregado al reducido mercado local, hace que es<br />
ta industria se mantenga estancada y sin perspectivas <strong>de</strong> lograr un mayor <strong>de</strong>sarrollo.<br />
CUADRO N 0<br />
55-DA<br />
PRODUCCIÓN DE BEBIDAS GASEOSAS<br />
1974-1975<br />
Fábricas<br />
Distritos<br />
Producción 1974<br />
Litros<br />
Producción 1975<br />
Litros<br />
Rich kó<strong>la</strong><br />
Cholita<br />
San Carlos<br />
El Mi<strong>la</strong>gro<br />
San Francisco<br />
Chota<br />
Chota<br />
Bambamarca<br />
Bambamarca<br />
Cutervo<br />
91,910<br />
17,741<br />
73,414<br />
176,913<br />
22,895<br />
91,958<br />
14,087<br />
54,958<br />
149,638<br />
14,984<br />
Total<br />
382,873<br />
325,625<br />
Fuente: Banco <strong>de</strong> <strong>la</strong> Nación - División <strong>de</strong> alcoholes y bebidas<br />
(c). Industria <strong>de</strong> Derivados <strong>de</strong> <strong>la</strong> Caña <strong>de</strong> Azúcar<br />
Esta actividad está representada por aquel<strong>la</strong>s unida<strong>de</strong>s <strong>de</strong> producción que se <strong>de</strong>dican<br />
a <strong>la</strong> e<strong>la</strong>boración <strong>de</strong> "chancaca" y a <strong>la</strong> <strong>de</strong>sti<strong>la</strong>ción <strong>de</strong> caña <strong>de</strong> azúcar, alcanzando<br />
a procesar el 97.4% <strong>de</strong> <strong>la</strong> producción total; esta industria <strong>de</strong>staca tanto por<br />
el número <strong>de</strong> p<strong>la</strong>ntas o trapiches existentes como por el valor bruto <strong>de</strong> su produc -<br />
ción„<br />
De acuerdo a <strong>la</strong> información proporcionada para el año 1975 por <strong>la</strong> División <strong>de</strong> Al<br />
coholes y Bebidas <strong>de</strong>l Banco <strong>de</strong> <strong>la</strong> Nación, en <strong>la</strong> zona funcionaban 46 unida<strong>de</strong>s<br />
productoras <strong>de</strong> aguardiente <strong>de</strong> caña, <strong>la</strong>s que produjeron 154,424 litros absolutos <strong>de</strong><br />
alcohol, valorizados en S/
482 ZONA NORTE DE CAJAMARCA<br />
„ El principal consumidor <strong>de</strong> estos alcoholes es <strong>la</strong> pob<strong>la</strong>ción rural, que compra el<br />
producto a un promedio <strong>de</strong> S/„32.00 el litro, adquiriendo por consiguiente alcoholes<br />
impuros y dañinos por el alto conteñido <strong>de</strong> fulguróles y al<strong>de</strong>hidos, creando<br />
también problemas sociales <strong>de</strong> alcoholismo en gran parte <strong>de</strong> <strong>la</strong> pob<strong>la</strong>ción campesina.<br />
En este grupo industrial también <strong>de</strong>stacan los centros que e<strong>la</strong>boran <strong>la</strong> "chancaca",<br />
tanto por el numero <strong>de</strong> p<strong>la</strong>ntas existentes como por <strong>la</strong> calidad <strong>de</strong> trabajadores que<br />
<strong>de</strong>pen<strong>de</strong>n <strong>de</strong> esta actividad y por el valor bruto <strong>de</strong> su producción» Es importante<br />
<strong>de</strong>stacar que esta industria es <strong>la</strong> que tiene el mayor número <strong>de</strong> establecimientos<br />
en <strong>la</strong> zona <strong>de</strong> estudio,. Su funcionamiento permite el <strong>de</strong>sarrollo <strong>de</strong> otra actividad<br />
manufacturera conexa, <strong>la</strong> e<strong>la</strong>boración <strong>de</strong> cestos <strong>de</strong> totora, los que son empleados<br />
como envases para comercializar ei producto„<br />
La División <strong>de</strong> Alcoholes y Bebidas <strong>de</strong>l Banco <strong>de</strong> <strong>la</strong> Nación ha registrado para el<br />
año 1975 una producción <strong>de</strong> 1,400 TM <strong>de</strong> chancaca^ <strong>la</strong> que, a un precio promer<br />
dio <strong>de</strong> venta <strong>de</strong> S/\ 10
DIAGNOSTICO AGROPECUARIO Pág. 483<br />
El arroz en cascara es pi<strong>la</strong>do en <strong>la</strong>s localida<strong>de</strong>s <strong>de</strong> L<strong>la</strong>llán (Chilete) y Guin<strong>de</strong>n<br />
(Temb<strong>la</strong><strong>de</strong>ra), siendo el grano en el momento <strong>de</strong> recepción sometido a previo análisis<br />
y <strong>de</strong>terminándose el grado <strong>de</strong> humedad, <strong>la</strong> presencia <strong>de</strong> materias extrañas, el<br />
porcentaje <strong>de</strong> granos quebrados, rojos y dañados, contándose con <strong>la</strong> previa autori_<br />
zación y supervisión <strong>de</strong> <strong>la</strong> Empresa Peruana <strong>de</strong> Servicios Agropecuarios (EPSA).<br />
Los rendimientos mfmmos requeridos para los molinos <strong>de</strong> <strong>la</strong> zona estudiada son <strong>de</strong><br />
68% <strong>de</strong> arroz pi<strong>la</strong>do, 0.70% <strong>de</strong> "ñelén" y 5,5% <strong>de</strong> "polvillo".<br />
Los subproductos <strong>de</strong> <strong>la</strong> industria molinera <strong>de</strong> arroz están constituidos por el "polvi<br />
lio" y el "ñelén", que son comercializados internamente a través <strong>de</strong> EPSA; el pol<br />
vil lo se distribuye en <strong>la</strong> región para uso pecuario y el ñelén es comprado generalmente<br />
por <strong>la</strong>s fábricas <strong>de</strong> cerveza. Los precios puestos en molino y sin envase son<br />
<strong>de</strong> S/.4.00 y S/.5.50 el Kg. para el "polvillo" y "ñelén", respectivamente.<br />
Para otros granos, existen molinos que compran <strong>la</strong> materia prima procesándo<strong>la</strong> y al<br />
macenándo<strong>la</strong> en sus locales para posteriormente comercializar<strong>la</strong>. Otros molinos ,<br />
en forma predominante realizan trabajos para terceras personas, cobrando tarifas<br />
variables según el grano a moler. Asf, en <strong>la</strong> molienda <strong>de</strong> trigo y cebada se cobra<br />
a razón <strong>de</strong> S/. 15.00 <strong>la</strong> arroba, aprovechándose en <strong>la</strong> e<strong>la</strong>boración <strong>de</strong> harina para<br />
pana<strong>de</strong>na y autoconsumo, principalmente.<br />
Para <strong>la</strong> molienda <strong>de</strong>l maiz, se cobra S/. 15.00 <strong>la</strong> arroba, obteniéndose <strong>de</strong>spués <strong>de</strong><br />
una simple preparación un producto conocido popu<strong>la</strong>rmente como "chochoca",muy<br />
empleado en <strong>la</strong> alimentación humana,<br />
b. Sector Artesanal<br />
(1),, Estructura y Caracteristicas Generales<br />
La artesania ocupa un lugar muy importante en <strong>la</strong> economfa <strong>de</strong> un extenso sector <strong>de</strong><br />
nuestra pob<strong>la</strong>ción, unas veces como expresión <strong>de</strong> arte popu<strong>la</strong>r y otras como complemen<br />
to <strong>de</strong> <strong>la</strong> actividad agropecuaria, <strong>de</strong>senvolviéndose con serias limitaciones, ya que es<br />
notoria <strong>la</strong> escasez <strong>de</strong> asistencia técnica y financiera; por esa razón, trabajan con una<br />
tecnología ina<strong>de</strong>cuada, obteniendo productos <strong>de</strong> baja calidad en menor cantidad y ma<br />
yores costos.<br />
(2). C<strong>la</strong>sificación<br />
La actividad artesanal pue<strong>de</strong> dividirse en dos grupos: uno, <strong>de</strong>nominado "Artesanfa Urbana"<br />
o "Mo<strong>de</strong>rna" y <strong>la</strong> otra, "Artesanía Rural" o "Tradicional", diferenciándose en -<br />
tre sf por su naturaleza y funciones, así como en el número y proce<strong>de</strong>ncia <strong>de</strong>l personal<br />
ocupado en cada una <strong>de</strong> el<strong>la</strong>s.<br />
(a). Artesón ¡a Urbana<br />
La artesanía urbana o mo<strong>de</strong>rna se <strong>de</strong>dica más a <strong>la</strong> producción <strong>de</strong> bienes utilitarios
184 ZONA NORTE DE CAJAMARCA<br />
que a <strong>la</strong> artística y está constituida por aquellos establecimientos orientados a tra<br />
bajos <strong>de</strong> carpintería, sastrería y zapatería, principalmente. En <strong>la</strong> zona, hay 24/<br />
establecimientos <strong>de</strong> este tipo, tal como se aprecia en el Cuadro N 0 56-DA, per mi<br />
tiendo dar ocupación a unos 390 trabajadores.<br />
El Sector I (subsectores <strong>de</strong> Cutervo, Chota, Santa Cruz y Hualgayoc) tiene 151 es<br />
tablecimientos artesanales, mientras que el Sector II (subsectores <strong>de</strong> Cajamarca,<br />
San Miguel y Contumazá) tiene 96 establecimientos, que representan el 61.1% y<br />
38.9% <strong>de</strong>l total, respectivamente.<br />
Esta artesanía se caracteriza por constituir <strong>la</strong> principal fuente <strong>de</strong> ingresos <strong>de</strong>l per<br />
sonal que se <strong>de</strong>dica a el<strong>la</strong>, ya que los trabajadores, tanto operarios como propieta<br />
rios, le <strong>de</strong>stinan <strong>la</strong> totalidad <strong>de</strong> <strong>la</strong> jornada <strong>la</strong>boral durante casi todo el año; sin<br />
embargo, se <strong>de</strong>senvuelve con ciertas limitaciones, <strong>de</strong>bido a <strong>la</strong> escasez <strong>de</strong> materia<br />
prima, <strong>la</strong> débil <strong>de</strong>manda en el mercado y <strong>la</strong> falta <strong>de</strong> capital .<br />
Las materias primas utilizadas provienen generalmente <strong>de</strong> <strong>la</strong> Costa y los productos<br />
e<strong>la</strong>borados son comercializados en forma local, siendo comprados por los intermediarios<br />
para remitirlos fuera <strong>de</strong> <strong>la</strong> zona o son adquiridos por los usuarios <strong>de</strong> <strong>la</strong>s<br />
áreas urbanas o rurales.<br />
(b). Artesanía Rural<br />
La Artesanía Rural o tradicional se <strong>de</strong>dica a <strong>la</strong> e<strong>la</strong>boración <strong>de</strong> artículos artísticos,<br />
dándole cierta característica típica <strong>de</strong> acuerdo al lugar don<strong>de</strong> se e<strong>la</strong>bora, <strong>de</strong>sta -<br />
cando <strong>la</strong>s activida<strong>de</strong>s <strong>de</strong> hi<strong>la</strong>n<strong>de</strong>ría, textilería y sombrerería. El personal <strong>de</strong>dicado<br />
a esta actividad está constituido principalmente por <strong>la</strong> pob<strong>la</strong>ción rural ya que los<br />
agricultores, gana<strong>de</strong>ros u obreros toman esta actividad como complementaria, para<br />
obtener ingresos adicionales; por ello, el potencial artesanal es subutilizado ,<br />
ya que se da en forma parcial .y, generalmente, por períodos estacionales.<br />
Debido a lo complejo <strong>de</strong> <strong>la</strong> estructura ocupacional <strong>de</strong> este grupo, se hace difícil<br />
calcu<strong>la</strong>r exactamente el número <strong>de</strong> personas <strong>de</strong>dicadas a esta actividad; pero, tomando<br />
en cuenta <strong>la</strong> información existente, así como los estudios <strong>de</strong> campo realiza<br />
dos por ONERN, se ha estimado que éstos alcanzan a 25,000. En cuanto al abastecimiento<br />
<strong>de</strong> materia prima, ésta proviene mayormente <strong>de</strong> fuera <strong>de</strong> <strong>la</strong> zona y está<br />
constituida principalmente por hilos, tintes y paja, los cuales son <strong>de</strong> baja calidad;<br />
en el caso <strong>de</strong> hi<strong>la</strong>dos, a falta <strong>de</strong> <strong>la</strong>na <strong>de</strong> oveja, los artesanos hacen uso <strong>de</strong> <strong>la</strong>nas<br />
comerciales que compran a precios elevados.<br />
Los trabajos artesanales caracterizan a <strong>la</strong> zona que los produce; así. Chota se distingue<br />
por sus trabajos <strong>de</strong> hi<strong>la</strong>dos <strong>de</strong> algodón, ponchos, cha<strong>la</strong>nes <strong>la</strong>brados y picados,<br />
cubrecamas, individuales <strong>de</strong> algodón, alforjas <strong>la</strong>bradas y picadas; en San Mi<br />
guel <strong>de</strong> Pal <strong>la</strong>ques, los trabajos son más finos que en Chota, utilizando hilos <strong>de</strong> aF<br />
godón merecerizado; en Cutervo, predominan los trabajos <strong>de</strong> cuero; Bambamarca se<br />
distingue por sus trabajos <strong>de</strong> paja, como sombreros e individuales, y Contumazá,<br />
por sus trabajos <strong>de</strong> tapetería y mantelería, usando como materias primas hilos mer-
o<br />
1 — • -<br />
Oficio<br />
Q.'¿ 11ÍU N" 56 ;P¿\<br />
NUMERO DE ESTABLECIMIENTOS ARTES<strong>ANA</strong>LES POR OFICIOS Y SUBSECTORES<br />
( 1871})<br />
Sector I<br />
Sector<br />
Cutervo Chota Santa Cruz Hualgayoc Subtotal Cajainarca San Miguel<br />
II<br />
Contumazá<br />
Subtotal<br />
Total<br />
i/><br />
H<br />
*—•<br />
n<br />
p<br />
ti<br />
to<br />
O<br />
13<br />
*ii<br />
n<br />
G<br />
*P3<br />
Carpintería<br />
Sastrería y costurería<br />
Za patena<br />
Soldadurfa<br />
Carpintería metálica<br />
Ta<strong>la</strong>bartería<br />
Hoja<strong>la</strong>tería<br />
15<br />
15<br />
9<br />
2<br />
6<br />
3<br />
1<br />
17<br />
8<br />
11<br />
2<br />
4<br />
1<br />
1<br />
4<br />
3<br />
3<br />
1<br />
1<br />
-<br />
-<br />
16<br />
12<br />
10<br />
1<br />
4<br />
-<br />
1<br />
52<br />
38<br />
33<br />
6<br />
15<br />
4<br />
3<br />
12<br />
7<br />
10<br />
2<br />
2<br />
1<br />
-<br />
10<br />
11<br />
7<br />
1<br />
2<br />
1<br />
-<br />
12<br />
6<br />
9<br />
1<br />
2<br />
-<br />
-<br />
34<br />
24<br />
26<br />
4<br />
6<br />
2<br />
-<br />
86<br />
62<br />
59<br />
10<br />
21<br />
6<br />
3<br />
Total<br />
51<br />
44<br />
12<br />
44<br />
151<br />
34<br />
32<br />
30<br />
96<br />
247<br />
Valor<br />
Porcentual<br />
61.1<br />
38.9<br />
100.0<br />
Fuente: Concejos Distritales.<br />
ONERN.<br />
CO
Pág. 486<br />
ZONA NORTE DE CAJAMARCA<br />
cerizados y <strong>la</strong>nas.<br />
(3), Problemas <strong>de</strong> <strong>la</strong> Artesanfa<br />
La artesanía afronta diversos problemas re<strong>la</strong>cionados con <strong>la</strong> <strong>de</strong>sorganización <strong>de</strong> los pro<br />
ductores y su concurrencia ais<strong>la</strong>da al mercada, el pobre abastecimiento <strong>de</strong>l capital <strong>de</strong><br />
operación asi - como <strong>la</strong> <strong>de</strong>ficiente estabilidad en los mercados, tanto en lo referente a<br />
<strong>la</strong> compra <strong>de</strong> insumas como en <strong>la</strong> venta <strong>de</strong> los productos terminados, agregando a esto<br />
<strong>la</strong> carencia <strong>de</strong> medios propios <strong>de</strong> transporte y <strong>de</strong>ficiente red <strong>de</strong> vias <strong>de</strong> comunicación .<br />
Estos factores, en conjunto, resultan en una incapacidad para comercializar los produc<br />
tos fuera <strong>de</strong>l mercado local y a precios convenientes, excesivos gastos al comprar <strong>la</strong>s i. -<br />
materias primas en mfnima cantidad asi* como elevados costos <strong>de</strong> transporte tanto para<br />
comprar insumas como para ven<strong>de</strong>r los productos acabados, agravado todo esto por <strong>la</strong><br />
participación especu<strong>la</strong>dora <strong>de</strong> los comerciantes intermediarios que absorben <strong>la</strong> mayor<br />
parte <strong>de</strong> <strong>la</strong> utilidad.<br />
La comercialización <strong>de</strong> los productos acabados sigue constituyendo el mayor problema<br />
<strong>de</strong> los artesanos, <strong>de</strong>bido principalmente a <strong>la</strong> dispersión y <strong>de</strong>sorganización <strong>de</strong> los pro -<br />
ductores y a <strong>la</strong> intervención <strong>de</strong> comerciantes que, aprovechándose <strong>de</strong> <strong>la</strong> falta <strong>de</strong> mercados<br />
permanentes para los productores, obtienen elevadas ganancias al comercializar<br />
a precios mayores los productos, no sin antes fijar precios muy bajos en los centros <strong>de</strong><br />
producción.<br />
(4). Perspectivas <strong>de</strong> Desarrollo<br />
Con el objeto <strong>de</strong> lograr el <strong>de</strong>sarrollo artesanal <strong>de</strong> <strong>la</strong> zona y en general <strong>de</strong> toda <strong>la</strong> re -<br />
gión, se vienen realizando acciones para lograr una racionalización <strong>de</strong> los procesos <strong>de</strong><br />
producción y comercialización. Estas acciones son llevadas a cabo por diferentes orga<br />
nismos e instituciones estatales, tales como <strong>la</strong> Empresa Peruana <strong>de</strong> Promoción Artesanal<br />
(EPPA-PERU), el Sistema Nacional <strong>de</strong> Apoyo a <strong>la</strong> Movilización Social (SINAMOS),por<br />
intermedio <strong>de</strong>l área <strong>de</strong> apoyo a <strong>la</strong> organización artesanal, y <strong>la</strong> Asociación <strong>de</strong> Coopera<br />
ción con <strong>la</strong> Mujer Campesina (ACOMUC).<br />
La Empresa Peruana <strong>de</strong> Promoción Artesanal tiene como objetivo promocionar <strong>la</strong> artesa<br />
nía a nivel <strong>de</strong>partamental, prestando asistencia técnica y financiera; este último aspee<br />
to se lleva a cabo en coordinación con el Banco Industrial <strong>de</strong>l Perú a través <strong>de</strong> losprés<br />
tamos artesanales. Esta empresa se encarga algunas veces <strong>de</strong> <strong>la</strong> comercialización <strong>de</strong><br />
los productos acabados, aunque <strong>la</strong> falta <strong>de</strong> capacidad insta<strong>la</strong>da y su limitada operativi<br />
dad hacen que sus funciones se circunscriban al ámbito <strong>de</strong> <strong>la</strong> ciudad <strong>de</strong> Cajamarca,<br />
(5). El Crédito en los Sectores Industrial y Artesanal<br />
Aparte <strong>de</strong> los problemas que confrontan los sectores industrial y artesanal, <strong>de</strong>be indicar<br />
se que <strong>la</strong> disponibilidad <strong>de</strong> capital es fundamental, ya que este recurso <strong>de</strong>termina que<br />
el sector tenga un <strong>de</strong>sarrollo dinámico o que se torne lento y se <strong>de</strong>teriore en compara -<br />
ción al <strong>de</strong>sarrollo que alcancen otros sectores.
DIAGNOSTICO AGROPECUARIO Pág. 487<br />
Teniendo en cuenta los limitados recursos financieros que disponen los sectores indus -<br />
trial y artesanal, es necesario que esta <strong>de</strong>ficiencia se supere mediante el crédito, ya<br />
que este factor es necesario en cada una <strong>de</strong> <strong>la</strong>s etapas productivas. El crédito lleva no<br />
sólo fines económicos sino también sociales, porque protege y fortalece <strong>la</strong> pequeña em<br />
presa individual, fomenta <strong>la</strong> creación <strong>de</strong> nuevas empresas industriales y/o <strong>la</strong> amplia -<br />
ción <strong>de</strong> <strong>la</strong>s ya existentes; en consecuencia, crea nuevas fuentes <strong>de</strong> trabajo. Debe <strong>de</strong>s<br />
tacarse que <strong>la</strong> zona, a causa <strong>de</strong> su situación geográfica y al estado <strong>de</strong> <strong>la</strong>s vías <strong>de</strong> co -<br />
municación, no posee en <strong>la</strong> actualidad capacidad para insta<strong>la</strong>r industrias <strong>de</strong> cierta en<br />
vergadura, <strong>la</strong>s que pue<strong>de</strong>n <strong>de</strong>sarrol<strong>la</strong>rse si se estimu<strong>la</strong> el procesamiento <strong>de</strong> <strong>la</strong> produc -<br />
ción agropecuaria.<br />
En <strong>la</strong> actividad industrial y artesanal, el Banco Industrial <strong>de</strong>l Perú es el principal agen<br />
te financiero, pero su influencia en <strong>la</strong> zona estudiada es mmima, lo mismo que a nivel<br />
<strong>de</strong>partamental. En el Cuadro N 0 57-DA, se muestra <strong>la</strong>s operaciones <strong>de</strong> crédito <strong>de</strong>sarro<br />
liadas por esta institución, pudiendo apreciarse que, para el perFodo <strong>de</strong> 1971 a 1974,<br />
el <strong>de</strong>partamento <strong>de</strong> Cafamarca captó un total <strong>de</strong> S/.SS'l 85, 000.00, mientras que, en<br />
contraste, Lima-Cal<strong>la</strong>o obtenfa S/.8,774 , 771,000.00, cifras que representan el *<br />
0.22% y 54.29%, respectivamente, <strong>de</strong> los avibs a nivel nacional. Si a lo expuesto,<br />
se agrega que <strong>la</strong> mayor proporción <strong>de</strong> los préstamos se concentra en <strong>la</strong> ciudad <strong>de</strong>Ca<br />
jamarca y alre<strong>de</strong>dores, se pue<strong>de</strong> <strong>de</strong>cir que <strong>la</strong> zona casi no participó <strong>de</strong>l crédito otorga<br />
do, a <strong>la</strong> que se suma que el Banco Industrial <strong>de</strong>l Perú tiene para todo el <strong>de</strong>partamento<br />
<strong>de</strong> Cajamarca sólo una sucursal en <strong>la</strong> ciudad <strong>de</strong>l mismo nombre, no asimi<strong>la</strong>ndo nuevos<br />
usuarios por falta <strong>de</strong> agencias en <strong>la</strong>s principales ciuda<strong>de</strong>s <strong>de</strong> <strong>la</strong> zona estudiada.<br />
CUADRO N 0<br />
57-DA<br />
OPERACIONES DE CRÉDITO DEL BANCO INDUSTRIAL DEL PERU<br />
Años<br />
i<br />
Cajamarca<br />
(SA)<br />
Lima-Cal<strong>la</strong>o<br />
(SA)<br />
Total País<br />
(SA)<br />
1971<br />
1972<br />
1973<br />
1974<br />
5-915,000.00<br />
7-535,000.00<br />
10-598,000.00<br />
11-137,000.00<br />
813-758,000.00<br />
2,185'/y9,000.00<br />
3,106-185,000.00<br />
2,669-049,000.00<br />
1,449-442,000.00<br />
4,369-378,000.00<br />
5,9<strong>03</strong>-483,000.00<br />
4,439-702,000.00<br />
Total<br />
35-185,000.00<br />
8,774-771,000.00<br />
16,162-005,000.00<br />
Fuente : Memorias <strong>de</strong>l Banco Industrial <strong>de</strong>l Perú.<br />
La ubicación <strong>de</strong> <strong>la</strong> Oficina <strong>de</strong>l Banco Industrial <strong>de</strong>l Perú ocasiona<br />
que los usuarios tengan que movilizarse <strong>de</strong>s<strong>de</strong> sitios lejanos para tramitar sus préstamos,com<br />
plicándose <strong>la</strong> operatividad <strong>de</strong>l sistema en época <strong>de</strong> lluvias, don<strong>de</strong> <strong>la</strong>s carreteras son difíciles<br />
<strong>de</strong> transitar, existiendo temporadas en que se pier<strong>de</strong> contacto entre el usuario <strong>de</strong>l eré -<br />
dito y el Banco. Consi<strong>de</strong>rando a<strong>de</strong>más los requisitos que hay que llenar para solicitar un<br />
préstamo, <strong>la</strong> lentitud <strong>de</strong>l trámite y el <strong>de</strong>sconocimiento <strong>de</strong>l sistema <strong>de</strong> crédito por parte <strong>de</strong>l
p áa _ 488<br />
ZONA NORTE DE CAJAMARCA<br />
industrial y <strong>de</strong>l artesano, se pue<strong>de</strong> aqui<strong>la</strong>tar <strong>la</strong> difícil accesibilidad a este servicio.<br />
c. Sector Tunstico<br />
(1). Estructura y Características Generales<br />
El turismo constituye una actividad que contribuye al <strong>de</strong>sarrollo económico <strong>de</strong>l pais,<br />
siendo una fuente importante <strong>de</strong> obtención <strong>de</strong> divisas y actuando también como un impulsor<br />
<strong>de</strong> integración a nivel nacional.<br />
Actualmente, el turismo en esta zona es muy limitado, <strong>de</strong>bido a que no existe un acón<br />
dicionamiento a<strong>de</strong>cuado para <strong>la</strong> captación <strong>de</strong> flujos <strong>de</strong> visitantes nacionales y/o extran<br />
jeros, sin que los organismos ni <strong>la</strong>s instituciones públicas y privadas hayan realizado <strong>la</strong>s<br />
acciones necesarias a este fin. Por esta razón, esta actividad se <strong>de</strong>sarrol<strong>la</strong> en forma<br />
<strong>de</strong>sorganizada, no ofreciéndose facilida<strong>de</strong>s <strong>de</strong> minima comodidad y servicios al turista,<br />
notándose a<strong>de</strong>más <strong>la</strong> ausencia <strong>de</strong> a<strong>de</strong>cuados sistemas <strong>de</strong> promoción y fomento.<br />
En <strong>la</strong> ciudad <strong>de</strong> Cajamarca y alre<strong>de</strong>dores, que son <strong>la</strong>s zonas <strong>de</strong> mavor atractivo turístico,<br />
<strong>la</strong> infraestructura <strong>de</strong> servicios para fomentar el turismo es <strong>de</strong>ficiente, siendo simi<strong>la</strong>r<br />
en <strong>la</strong> zona <strong>de</strong> estudio, ya que sólo hay una reducida capacidad insta<strong>la</strong>da <strong>de</strong> alojamiento<br />
y <strong>de</strong> recepción <strong>de</strong> viajeros, careciéndose <strong>de</strong> <strong>la</strong>s comodida<strong>de</strong>s necesarias para el<br />
visitante. Se aprecia también <strong>la</strong> falta <strong>de</strong> servicios <strong>de</strong> información y orientación, salvo<br />
los e<strong>la</strong>borados por <strong>la</strong> Misión Belga y referidos a ¡a ciudad <strong>de</strong> Cajamarca y alre<strong>de</strong>dores;<br />
asimismo, el servicio <strong>de</strong> transporte es muy <strong>de</strong>ficiente y resulta muy difícil movilizarse<br />
cuando no se cuenta con vehículos propios.<br />
(2). Atractivos Turísticos<br />
Como centro <strong>de</strong> atracción turístico pue<strong>de</strong> consi<strong>de</strong>rarse al Parque Nacional <strong>de</strong> Cutervo,<br />
creado por <strong>la</strong> Ley N 0 13694, <strong>de</strong>l 20 <strong>de</strong> Setiembre <strong>de</strong> 1961, con el objeto <strong>de</strong> preserver<br />
una región natural, que constituye un importante escenario y una area apta para <strong>la</strong> in<br />
vestigación <strong>de</strong> <strong>la</strong>s ciencias naturales. Aparte <strong>de</strong> su atracción turística por sus bellos<br />
paisajes, gran<strong>de</strong>s formaciones botánicas, impresionantes cavernas que sirven <strong>de</strong> habitat<br />
a aves originarias, conocidas como "guácharos", <strong>de</strong>staca por su abundante fauna, l<strong>la</strong>mativos<br />
petroglifos y otros restos arqueológicos; sin embargo, este lugar no cuenta con<br />
facilida<strong>de</strong>s para el turista, ya sea mediante albergues, a<strong>de</strong>cuada accesibilidad u otro<br />
tipo <strong>de</strong> servicios.<br />
En el distrito <strong>de</strong> San Pablo, se encuentran ruinas arqueológicas conocidas como <strong>la</strong> <strong>de</strong><br />
"Ventanil<strong>la</strong>s", con sus tumbas superpuestas, tipo nido <strong>de</strong> águi<strong>la</strong>s; con características si<br />
mi<strong>la</strong>res se tiene también a <strong>la</strong>s ruinas <strong>de</strong> "Cal<strong>la</strong>ncas" y "Tunad". Al Suroeste <strong>de</strong> San Pa<br />
blo, se hal<strong>la</strong>n <strong>la</strong>s ruinas <strong>de</strong> Kuntur Wassi (casa <strong>de</strong>l Cóndor), cuyo templo consta <strong>de</strong> treF<br />
p<strong>la</strong>taformas superpuestas y numerosos monolitos con inscripciones y grabados, que re -<br />
presentan al cóndor, al ¡aguar y a <strong>la</strong> serpiente, trilogía sagrada <strong>de</strong> <strong>la</strong> gran cultura Cha<br />
vín. En <strong>la</strong>s cercanías <strong>de</strong>l mismo pob<strong>la</strong>do, existen chulpas en los cerros <strong>de</strong> Cashorco, ~
DIAGNOSTICO AGROPECUARIO Pág. 489<br />
Chalqques. y Tambo Real; y al Norte, se ubican <strong>la</strong>s ruinas <strong>de</strong> Incatambo (Posada <strong>de</strong>l Inca).<br />
De interés arqueológico son consi<strong>de</strong>radas también <strong>la</strong>s ruinas <strong>de</strong> Catán y Tantarica, ubi<br />
cadas en <strong>la</strong> provincia <strong>de</strong> Contumazá que, al igual que los anteriores centros <strong>de</strong> atracción<br />
turística, carecen <strong>de</strong> servicios y son <strong>de</strong> dificil accesibilidad.<br />
(3). Perspectivas <strong>de</strong> Desarrollo<br />
El acuerdo especTfico entre el Gobierno <strong>de</strong>l Perú y el Reino <strong>de</strong> Bélgica para el <strong>de</strong>sarro<br />
lio <strong>de</strong> <strong>la</strong> subregión <strong>de</strong> Cajamarca, suscrito el 27 <strong>de</strong> Diciembre <strong>de</strong> 1971, contemp<strong>la</strong> el<br />
Proyecto 08 <strong>de</strong> Promoción al Turismo, al cual ha sido posteriormente integrada <strong>la</strong> actividad<br />
artesanal y cultural, con participación <strong>de</strong> <strong>la</strong> Dirección General <strong>de</strong> Turismo <strong>de</strong>l<br />
Ministerio <strong>de</strong> Industria y Turismo, <strong>de</strong> <strong>la</strong> Empresa Peruana <strong>de</strong> Promoción Artesanal y <strong>de</strong>l<br />
Instituto Nacional <strong>de</strong> Cultura^ Entre sus principales acciones inmediatas, compren<strong>de</strong> a<br />
<strong>la</strong> ciudad <strong>de</strong> Cajamarca y alre<strong>de</strong>dores que, aunque no ha recibido el impacto esperado ,<br />
ha absorbido <strong>la</strong> casi totalidad <strong>de</strong> los benefic'os <strong>de</strong> este Proyecto, .razón por <strong>la</strong> cual en<br />
<strong>la</strong> zona estudiada su influencia ha sido mfnima.<br />
D. CONCLUSIONES Y RECOMENDACIONES<br />
1. Conclusiones Referentes a <strong>la</strong> Estructura <strong>de</strong> Producción<br />
a. La actividad agropecuaria es <strong>la</strong> más importante en <strong>la</strong> zona <strong>de</strong> estudio por ser <strong>la</strong> princi -<br />
pal fuente <strong>de</strong> trabajo y <strong>de</strong> provisión <strong>de</strong> alimentos, representando un aporte <strong>de</strong> especial<br />
significación a <strong>la</strong> formación <strong>de</strong> capital en <strong>la</strong> región.<br />
b. La zona <strong>de</strong> estudio compren<strong>de</strong> 550,000 Ha», estimándose que el área anual <strong>de</strong> produc -<br />
ción agríco<strong>la</strong> durante <strong>la</strong> campaña 1974-1975 fue <strong>de</strong> 84,517 Ha., extensión que represen<br />
tó el 15.4% <strong>de</strong>l total; <strong>de</strong> ese total el 82.2% (69,464 Ha.) se cultivaron bajo el regimen<br />
<strong>de</strong> lluvias (secano) y el 17.8% (15,053 Ha.) bajo riego. El 84.6% restante está representado<br />
por áreas ocupadas por pastos naturales, bosques (herbáceos y arbustivos), roque<br />
dales, lechos <strong>de</strong> río y otros que, en su mayor parte, constituyen recursos naturales que<br />
pue<strong>de</strong>n ser aprovechados mediante p<strong>la</strong>nes racionóles <strong>de</strong> expiotacíón„<br />
c. Con fines <strong>de</strong> análisis, <strong>la</strong> zona <strong>de</strong> estudio ha sido dividida en dos sectores. El Sector I<br />
(Norte), que compren<strong>de</strong> <strong>la</strong>s provincias <strong>de</strong> Cutervo, Chota, Santa Cruz y Hualgayoc, o<br />
cupa en conjunto el 61.0% (51,599 Ha.) <strong>de</strong>l área anual <strong>de</strong> producción, <strong>de</strong> <strong>la</strong>s cuales<br />
sólo 4,009 Ha. se cultivaron bajo riego. El Sector II (Sur) compren<strong>de</strong> <strong>la</strong>s provincias<strong>de</strong><br />
Cajamarca, San Miguel y Contumazá, que en conjunto ocuparon el 39.0% (32,918 Ha.)<br />
^ <strong>de</strong>l área anual <strong>de</strong> producción, <strong>de</strong> <strong>la</strong>s cuales se cultivaron 11,044 Ha. bajo riego.<br />
d. La producción agropecuaria se <strong>de</strong>sarrolló <strong>de</strong>ntro <strong>de</strong> un marco <strong>de</strong> características propias<br />
<strong>de</strong> <strong>la</strong> región, resultado <strong>de</strong> <strong>la</strong>s condiciones topocI imáticas existentes así como <strong>de</strong> los patrones<br />
socio-culturales y técnicos, siendo un producto <strong>de</strong>l costumbrismo tradicional. La
Pág. 490<br />
ZONA NORTE DE CAJAMARCA<br />
producción agríco<strong>la</strong> se <strong>de</strong>stinó a satisfacer <strong>la</strong>s necesida<strong>de</strong>s <strong>de</strong> subsistencia <strong>de</strong> <strong>la</strong> pob<strong>la</strong><br />
ción y el exce<strong>de</strong>nte se ofertó al mercado local y regional. La producción pecuaria es<br />
tá dirigida a <strong>la</strong> economía <strong>de</strong> mercado <strong>de</strong>bido a que sus productos tienen una <strong>de</strong>manda<br />
creciente.<br />
e. La actividad agríco<strong>la</strong> en <strong>la</strong> campaña 1974-1975 generó un <strong>volumen</strong> <strong>de</strong> producción <strong>de</strong><br />
157,428 TM., valorizadas en S/.507'676,000.00, correspondiendo el mayor aporteal<br />
Sector I (Norte), con el 59.4%, y <strong>la</strong> diferencia, al Sector II (Sur). A nivel <strong>de</strong> sub -<br />
sector, <strong>de</strong>stacan los aportes <strong>de</strong> Hualgayoc, Cajamarca y Chota.<br />
f. La actividad pecuaria se realiza en base a <strong>la</strong> pob<strong>la</strong>ción actual animal, cuya valoriza<br />
ción ha sido estimada en S/. 1,551 '294,000.00. La producción obtenida en <strong>la</strong> campa<br />
ña <strong>de</strong> 1974-1975 alcanzó a un <strong>volumen</strong> <strong>de</strong> 21,865 TM., valorizadas en S/.<br />
574'!96,000.00; <strong>de</strong> ese total, el Sector I (Norte) generó el 55.1% y el Sector II (Sur)<br />
<strong>la</strong> diferencia. Respecto al valor <strong>de</strong> <strong>la</strong> pob<strong>la</strong>ción pecuaria, es importante seña<strong>la</strong>r que<br />
<strong>la</strong> mayor inversión está representada por el ganado vacuno, con el 84.7%, siendo sig<br />
n if ¡cativamente reducido el aporte <strong>de</strong> <strong>la</strong>s <strong>de</strong>más especies. A nivel <strong>de</strong> subsectores, <strong>de</strong>s<br />
tacaron por su mayor participación Cutervo, San Miguel y Cajamarca.<br />
g. La actividad agropecuaria en <strong>la</strong> campaña 1974-75 alcanzó un <strong>volumen</strong> <strong>de</strong> producción<br />
<strong>de</strong> 179,293 TM», <strong>de</strong> <strong>la</strong>s cuales el 87.8% proce<strong>de</strong> <strong>de</strong> <strong>la</strong> producción agríco<strong>la</strong> y <strong>la</strong> dife<br />
rencia <strong>de</strong> <strong>la</strong> pecuaria; el valor <strong>de</strong> <strong>la</strong> producción ascendió a S/. 1,081 '872,000.00, par<br />
ticipando <strong>la</strong> gana<strong>de</strong>ría con el 53.1% y <strong>la</strong> agricultura con el 46*9% restante. El sector<br />
I (Norte) generó el 57.1% <strong>de</strong>l valor y el Sector II (Sur) <strong>la</strong> diferencia, <strong>de</strong>stacando<br />
por su mayor aporte los subsectores <strong>de</strong> Cajamarca, Chota, ^Huaígayoc, Cutervo y San<br />
Miguel.<br />
h. Existe predominio <strong>de</strong>l minifundio disperso, apreciándose que el 72.2% <strong>de</strong> <strong>la</strong>s unida<strong>de</strong>s<br />
agríco<strong>la</strong>s menores <strong>de</strong> 5 Ha. ocupan sólo el 17.4% <strong>de</strong>l área total, con un área agríco<strong>la</strong><br />
útil que abarca <strong>de</strong>l 60 al 70% <strong>de</strong> <strong>la</strong> extensión total. En contraposición a lo ante -<br />
rior, el 0.6% <strong>de</strong> <strong>la</strong>s unida<strong>de</strong>s agríco<strong>la</strong>s (mayores <strong>de</strong> 100 Ha.) abarcan el 32.1% <strong>de</strong>l<br />
área total, en los que el área agríco<strong>la</strong> útil sólo representa <strong>de</strong>l 5 al 10% <strong>de</strong>l área total.<br />
i. Respecto a los sistemas <strong>de</strong> conducción <strong>de</strong> <strong>la</strong> tierra, se dan formas directas e indirectas,<br />
a pesar que <strong>la</strong>s últimas modalida<strong>de</strong>s presentan variantes que se oponen a <strong>la</strong>s leyes agrá<br />
rias vigentes. El proceso <strong>de</strong> Reforma Agraria en <strong>la</strong> zona se encuentra en su inicio, <strong>de</strong><br />
bido a <strong>la</strong> falta <strong>de</strong> presupuesto para contrafar personal idóneo y a situaciones políticosociales<br />
y administrativas especiales; sin embargo, <strong>de</strong>stacan por su importancia <strong>la</strong>s resoluciones<br />
zonales <strong>de</strong> inafectación, dirigidas a consolidar <strong>la</strong> pequeña y mediana pro -<br />
piedad, y <strong>la</strong>s <strong>de</strong> afectación, con <strong>la</strong>s que se propone transformar y or<strong>de</strong>nar <strong>la</strong> nueva es<br />
tructura agraria, aboliendo <strong>la</strong>s formas <strong>de</strong> explotación <strong>de</strong> <strong>la</strong> tierra que contravienen <strong>la</strong>s<br />
normas que seña<strong>la</strong> <strong>la</strong> Ley N 0 17716.<br />
¡. La pob<strong>la</strong>ción humana asentada en <strong>la</strong> zona <strong>de</strong> estudio, alcanzó en 1972 a 260,214 habi<br />
tantes, <strong>de</strong> los cuales el 24.9% (64,809 habitantes) constituyó <strong>la</strong> pob<strong>la</strong>ción económica"<br />
mente activa (PEA), encontrándose en <strong>la</strong> condición <strong>de</strong> ocupadas 63,659 habitantes<br />
(98.2%); <strong>de</strong> ese total, 48,309 habitantes (75.9%) se <strong>de</strong>dican a <strong>la</strong> actividad agropecua
DIAGNOSTICO AGROPECUARIO Pág. ,491<br />
o ría. En estos cálculos, <strong>la</strong> PEA ocupada resulta muy elevada, ya que el subempleo o<br />
subocupación se disfraza entre <strong>la</strong> pob<strong>la</strong>ción ocupada en <strong>la</strong> actividad agropecuaria y se<br />
estima que afecta a 57,356 habitantes (88.5%) <strong>de</strong> <strong>la</strong> PEA ocupada.<br />
k. En <strong>la</strong> actividad agropecuaria, se emplea indistintamente <strong>la</strong> mano <strong>de</strong> obra <strong>de</strong> hombres y<br />
mujeres, cuya disponibilidad es variada. El valor <strong>de</strong> los jornales en toda <strong>la</strong> zona es<br />
casi homogéneo, alcanzando el promedio a S/.30.00 <strong>la</strong> tarea, con excepción <strong>de</strong> los<br />
cultivos <strong>de</strong> caña <strong>de</strong> azúcar y arroz, que pagan S/.60.00 <strong>la</strong> tarea; <strong>la</strong> remuneración por<br />
los servicios se hace en dinero, con. comida y dinero y, en <strong>la</strong>s épocas <strong>de</strong> cosecha, se<br />
paga por lo general con productos.<br />
I. El uso <strong>de</strong> una a<strong>de</strong>cuada tecnología está fuertemente limitada por <strong>la</strong>s condiciones naturales<br />
imperantes, por los altos costos que representa su aplicación y por el poco atractivo<br />
que tienen los precios <strong>de</strong> venta <strong>de</strong> los productos agropecuarios, vale <strong>de</strong>cir, por <strong>la</strong><br />
diferencia <strong>de</strong> términos <strong>de</strong> intercambio urbano-rural. En <strong>la</strong> producción agríco<strong>la</strong>, los<br />
cultivos <strong>de</strong> arroz y <strong>de</strong> papa son los que reciben mayor apoyo tecnológico y, en <strong>la</strong> ex -<br />
plotación vacuna, <strong>la</strong> actividad pecuaria.<br />
IL<br />
El capital <strong>de</strong> trabajo en su totalidad proviene <strong>de</strong>l agricultor y/o gana<strong>de</strong>ro, resultando<br />
generalmente insuficiente para cubrir los costos <strong>de</strong> producción. El capital <strong>de</strong> trabajo<br />
(costos directos) necesario para <strong>la</strong> producción agríco<strong>la</strong> <strong>de</strong> <strong>la</strong> campaña, 1974-75 fue e?<br />
timado en S/.335 , 725,000.00, <strong>de</strong> los cuales en insumos se invirtió el 32.3% y en mano<br />
<strong>de</strong> obra el 31.1%, mientras <strong>la</strong> tracción y otros gastos <strong>de</strong>mandaron porcentajes meno<br />
-res*. De este total, el Sector I (Norte) absorbió el 60.6% y el Sector II (Sur), el 39.4"<br />
porciento, <strong>de</strong>stacando por <strong>la</strong> mayor <strong>de</strong>manda <strong>de</strong> capital <strong>de</strong> trabajo los subsectores <strong>de</strong><br />
Hualgayoc, Cajamarca y Chota.<br />
m. Los costos directos para <strong>la</strong> producción pecuaria fueron estimados en S/.365 ! 751, 000.00,<br />
<strong>de</strong> los cuales <strong>la</strong> explotación vacuna absorbió el 85.6%, siendo los gastos <strong>de</strong> alimenta -<br />
ción y mano <strong>de</strong> obra los <strong>de</strong> mayor significación. De este total, el Sector I (Norte) absorbió<br />
el 56.8% y el Sector II (Sur), <strong>la</strong> diferencia; los mayores costos fueron <strong>de</strong>manda -<br />
dos por los subsectores <strong>de</strong> San Miguel, Cutervo, Chota y Cajamarca.<br />
n. Los costos <strong>de</strong> producción agropecuaria alcanzaron a S/.701 '476,000.00, correspondien<br />
do a <strong>la</strong> actividad pecuaria el 52.1% <strong>de</strong> <strong>la</strong> inversión y a <strong>la</strong> agricultura <strong>la</strong> diferencia. El<br />
Sector I (Norte) absorbió el 58.6% y el Sector II (Sur) el 41.4%; a nivel <strong>de</strong> subsectores,<br />
<strong>la</strong> mayor inversión se realizó en Hualgayoc, Cajamarca y Chota.<br />
ñ. Las utilida<strong>de</strong>s logradas en <strong>la</strong> actividad agropecuaria, durante <strong>la</strong> campaña 1974-75, han<br />
sido estimadas en S/.380'396,000.00, <strong>de</strong> <strong>la</strong>s cuales <strong>la</strong> actividad pecuaria aportó el<br />
54.8% y <strong>la</strong> agríco<strong>la</strong> el <strong>45</strong>.2% restante; <strong>la</strong> participación <strong>de</strong>l Sector I (Norte) fue <strong>de</strong>l<br />
54.3% y <strong>la</strong> diferencia <strong>45</strong>.7% fue <strong>de</strong>l Sector II (Sur). En el caso <strong>de</strong> <strong>la</strong> actividad pecua<br />
ria, el Sector I (Norte) participé pon el 52.0% y el otro sector con <strong>la</strong> diferencia; <strong>de</strong>stacando<br />
por su mayor aporte los subsectores <strong>de</strong> Cutervo, San Miguel y Cajamarca. En<br />
<strong>la</strong> actividad agríco<strong>la</strong>, el Sector I (Norte) participó con el 57.2% y el Sector II (Sur) ,<br />
con <strong>la</strong> diferencia; los mayores aportes fueron generados por los subsectores <strong>de</strong> Cajamarca,<br />
Hualgayoc y Chota.
Pág. 492<br />
•<br />
ZONA NORTE DE CAJAMARCA<br />
o. Los servicios <strong>de</strong> asistencia técnica fueron prestados a través <strong>de</strong> fós agencias agrarias <strong>de</strong><br />
Cutervo, Santa Cruz, Chota, Bambamarca, Ca¡anriarca yChilete, <strong>de</strong>pendientes <strong>de</strong> <strong>la</strong>s<br />
Oficinas Agrarias <strong>de</strong> Chota, Cajamarca y Chepén, respectivamente, pertenecientes a<br />
<strong>la</strong> Zona Agraria N 0 II <strong>de</strong>l Ministerio <strong>de</strong> Agricultura. El personal técnico <strong>de</strong> estas <strong>de</strong>pen<strong>de</strong>ncias<br />
proporcionan asesoramiento a los agricultores y/o gana<strong>de</strong>ros en aspectos <strong>de</strong><br />
Producción, <strong>de</strong> Comercialización, <strong>de</strong> Investigación, <strong>de</strong> Reforma Agraria y <strong>de</strong> Forestal<br />
y Caza, asi* como <strong>de</strong> Inspección y Control. Estas acciones son muy limitadas <strong>de</strong>bidas<br />
al escaso presupuesto operativo, a <strong>la</strong> <strong>de</strong>ficiencia <strong>de</strong>l equipo e insta<strong>la</strong>ciones existentes,<br />
a <strong>la</strong> falta <strong>de</strong> capacitación <strong>de</strong>l personal que trabaja y a <strong>la</strong> escasez <strong>de</strong> medios <strong>de</strong> trans -<br />
porte,<br />
p<br />
Las activida<strong>de</strong>s que <strong>de</strong>sarrol<strong>la</strong> <strong>la</strong> Oficina Regional <strong>de</strong> Apoyo a <strong>la</strong> Movilización Social<br />
(ORAMS II) están <strong>de</strong>stinadas a fomentar <strong>la</strong> organización <strong>de</strong> cooperativas, común ida -<br />
<strong>de</strong>s, grupos campesinos y ligas agrarias y a consolidar <strong>la</strong> Fe<strong>de</strong>ración <strong>de</strong> Campesinos <strong>de</strong><br />
Cajamarca; sin embargo, <strong>la</strong> amplitud <strong>de</strong>l ámbito <strong>de</strong> acción y los limitados recursos téc<br />
nicos, humanos, presupuéstales y <strong>de</strong> equipos, dificultan que se alcancen los objetivos<br />
seña<strong>la</strong>dos.<br />
q. Las principales fuentes <strong>de</strong> crédito para el sector agropecuario fueron el Banco Agrario<br />
<strong>de</strong>l Perú y el Fondo en Fi<strong>de</strong>icomiso, los que durante <strong>la</strong> campaña <strong>de</strong> 1974-75 otorgaron<br />
préstamos por un monto <strong>de</strong> S/.lS^l ,260.00; <strong>de</strong> ese total, el Banco habilitó el 61 ,0<br />
porciento y el Fondo en Fi<strong>de</strong>icomiso financió el 390 0% restante,.<br />
r. El Banco Agrario otorgó préstamos por un monto <strong>de</strong> S/. 11 "252,000,00, <strong>de</strong> los cuales <strong>la</strong><br />
agricultura captó el 63„ó%, que se <strong>de</strong>dicaron preferentemente al cultivo <strong>de</strong> arroz, <strong>de</strong><br />
papa y <strong>de</strong> maTz; y <strong>la</strong> gana<strong>de</strong>ría captó el 36.4% <strong>de</strong>l total, invirtiéndose <strong>de</strong> ellos el<br />
100.0% en <strong>la</strong> explotación <strong>de</strong>l ganado vacuno. El Fondo en Fi<strong>de</strong>icomiso otorgó presta<br />
mos por un monfo <strong>de</strong> S/„7"l88,640 00, <strong>de</strong>stinados principalmente a <strong>la</strong> producción agn<br />
co<strong>la</strong>, que absorbió el 87.1%, siendo el 12.6% absorbido por <strong>la</strong> gana<strong>de</strong>ricio<br />
s„ La productividad <strong>de</strong> <strong>la</strong> tierra en el cultivo <strong>de</strong> <strong>la</strong> papa presenta dos variantes; <strong>la</strong> primera,<br />
cuando <strong>la</strong> producción está ligada a <strong>la</strong> economfa <strong>de</strong> mercado y que, generalmente ,<br />
resulta alta, patentizando el esfuerzo <strong>de</strong>l hombre por obtener un mejor rendimiento;<br />
<strong>la</strong> otra, que se hace para subsistencia, en <strong>la</strong> que <strong>la</strong> productivdad es baja, observando<br />
se simi<strong>la</strong>r ten<strong>de</strong>ncia en los cultivos <strong>de</strong> mafz, trigo, cebada, arveja y otros.<br />
t. La productividad <strong>de</strong> <strong>la</strong> mano <strong>de</strong> obra en los cultivos seña<strong>la</strong>dos es diferente y variable ,<br />
<strong>de</strong>bido a <strong>la</strong> heterogeneidad <strong>de</strong> <strong>la</strong> fuerza <strong>de</strong> trabajo, en <strong>la</strong> que inci<strong>de</strong>n principalmente<br />
<strong>la</strong>s características topográficas y <strong>la</strong> dimensión <strong>de</strong> <strong>la</strong>s unida<strong>de</strong>s <strong>de</strong> producción„<br />
u. La productividad <strong>de</strong>l capital en los fundos ligados a <strong>la</strong> economía <strong>de</strong> mercado permite re<br />
cuperar el capi tal invertido, pero en los fundos no ligados a <strong>la</strong> economfa <strong>de</strong> mercado ,<br />
los costos <strong>de</strong> producción son superiores al valor <strong>de</strong> <strong>la</strong> cosecha; este <strong>de</strong>sequilibrio en el<br />
proceso productivo agudiza <strong>la</strong> ten<strong>de</strong>ncia al <strong>de</strong>crecimiento <strong>de</strong> <strong>la</strong> inversión, lo que daco<br />
mo resultado una menor productividad <strong>de</strong> <strong>la</strong> tierra„
DIAGNOSTICO AGROPECUARIO Pág. 493<br />
2. Conclusiones Referentes a <strong>la</strong> Estructura <strong>de</strong> Comercialización<br />
a. El proceso <strong>de</strong> comercialización <strong>de</strong> los productos agropecuarios se encuentra afectado<br />
por acciones <strong>de</strong> acaparamiento y especu<strong>la</strong>ción, vicios y <strong>de</strong>fectos propios <strong>de</strong> <strong>la</strong> estructura<br />
comercial imperante, que ha sometido a los productores a los requerimientos eco -<br />
nómicos <strong>de</strong> los comerciantes.<br />
b. Las <strong>de</strong>cisiones <strong>de</strong> merca<strong>de</strong>o <strong>de</strong> los productos regionales son influenciados, principal<br />
mente, por los mercados <strong>de</strong> Chic<strong>la</strong>yo, Trujillo, <strong>la</strong>s cooperativas agrarias <strong>de</strong> producción<br />
azucareras <strong>de</strong>l Norte <strong>de</strong>l país y por el gran mercado metropolitano <strong>de</strong> Lima-Cal<strong>la</strong>o. En<br />
menor proporción, inci<strong>de</strong>n los mercados regionales <strong>de</strong> Cajamarca, Hualgayoc, Bambamarca,<br />
Chota y Cutervo, principalmente.<br />
c. Las informaciones <strong>de</strong> mercado y <strong>la</strong> colocación <strong>de</strong> los productos agropecuarios sufren se<br />
rias dificulta<strong>de</strong>s en cuanto a su difusión regional por <strong>la</strong> difícil topografía que presenta<br />
<strong>la</strong> región, los pequeños volúmenes comercializables, <strong>la</strong>s gran<strong>de</strong>s distancias que separan<br />
<strong>la</strong>s unida<strong>de</strong>s <strong>de</strong> producción con los centros <strong>de</strong> consumo y el bajo grado cultural <strong>de</strong> los<br />
agricultores,<br />
d. La precaria organización socioeconómica <strong>de</strong> los productores y <strong>la</strong> falta <strong>de</strong> apoyo y servi<br />
ci os estatales al proceso facilitan <strong>la</strong>-intervención <strong>de</strong> los comerciantes mayoristas e intermediarios<br />
que, muchas veces, perjudican a los productores y a los consumidores.<br />
e. Las organizaciones agropecuarias asociativas no participan en <strong>la</strong> comercialización <strong>de</strong><br />
los productos agropecuarios, a excepción <strong>de</strong> algunos intentos ais<strong>la</strong>dos que se orientan a<br />
<strong>la</strong> adquisición y distribución <strong>de</strong> insumas agropecuarios.<br />
f. Las diversas cuencas <strong>de</strong> <strong>la</strong> región no disponen <strong>de</strong> una a<strong>de</strong>cuada infraestructura física <strong>de</strong><br />
comercialización que facilite el acopio, <strong>la</strong> preparación comercial, el almacenaje y <strong>la</strong><br />
distribución <strong>de</strong> los productos agropecuarios e insumos, impidiendo, en esta forma, <strong>la</strong> so<br />
lución <strong>de</strong> los problemas <strong>de</strong>rivados <strong>de</strong> <strong>la</strong> periodicidad <strong>de</strong> <strong>la</strong>s cosechas, <strong>de</strong> <strong>la</strong> diversificación<br />
<strong>de</strong> <strong>la</strong> producción y <strong>de</strong> los pequeños volúmenes disponibles para comercializar.<br />
g. En <strong>la</strong> zona <strong>de</strong> estudio, se aprecia una gran <strong>de</strong>ficiencia en <strong>la</strong> normalización y estandari<br />
zación <strong>de</strong> pesas, medidas, envases y calida<strong>de</strong>s <strong>de</strong> los productos, limitando <strong>la</strong> adopción<br />
<strong>de</strong> una política para <strong>la</strong> fijación <strong>de</strong> precios y <strong>de</strong> <strong>la</strong>s medidas necesarias para <strong>la</strong> conserva<br />
cíón y manípüleo<strong>de</strong> los productos» ,<br />
h. Los centros feriales o p<strong>la</strong>zas agropecuarias <strong>de</strong> <strong>la</strong> región actúan <strong>de</strong>sor<strong>de</strong>nadamente, sin<br />
contar con <strong>la</strong> onentaciom tecno-comercial ni <strong>la</strong> reg<strong>la</strong>mentación necesaria paramormar<br />
<strong>la</strong>s operaciones y <strong>la</strong> participación <strong>de</strong> <strong>la</strong>s instituciones en esta importante actividad eco<br />
nómico regional.<br />
i. Las condiciones climáticas y <strong>la</strong> agreste topografía <strong>de</strong> <strong>la</strong> región limitan seriamente <strong>la</strong>mo<br />
vilización <strong>de</strong> los productos agropecuarios,Haciendo <strong>de</strong>pen<strong>de</strong>r <strong>de</strong>l estado <strong>de</strong> conservación<br />
<strong>de</strong> <strong>la</strong>s carreteras <strong>la</strong> comercialización <strong>de</strong> ellos.
Me. 434 ZONA \'ORIF DE CAJA MA RCA<br />
¡, El Ministerio <strong>de</strong> Pesquena^ a través <strong>de</strong> <strong>la</strong> Empresa Publica <strong>de</strong> Servicios Pesqueros<br />
(EPSEP ) participa en <strong>la</strong> comercialización <strong>de</strong> los productos hidrobioiógicos con ¡a finalidad<br />
<strong>de</strong> promocionar e! consumo y regu<strong>la</strong>r los volúmenes y precios <strong>de</strong> los productos pes<br />
queros, sin conseguir limitar <strong>la</strong> intervención <strong>de</strong> los comerciantes intermediarios.<br />
3. Conclusiones Referentes a <strong>la</strong> Ag ro ind us tr i a, ArtesanTa y Turismo<br />
a. La industria es un sector muy dinámico por <strong>la</strong> fuerte repercución que tiene sobre otras<br />
activida<strong>de</strong>s; no obstante, su participación en <strong>la</strong> economía <strong>de</strong> <strong>la</strong> zona es muy reducida.<br />
b. La actividad industrial en <strong>la</strong> zona se encuentra atrasada y muestra un grado <strong>de</strong> <strong>de</strong>sarrollo<br />
incipiente, notándose en forma predominante inversiones privadas, siendo Ínfima <strong>la</strong><br />
inversión pública.<br />
c. Este atraso industrial se <strong>de</strong>be básicamente a <strong>la</strong> alta proporción <strong>de</strong> materias primas <strong>de</strong> es<br />
casa e<strong>la</strong>boración, a <strong>la</strong> falta <strong>de</strong> recursos económicos, financieros, técnicos y energéticos<br />
y a <strong>la</strong> escasa atención dispensada por los organismos encargados <strong>de</strong> p<strong>la</strong>nificar su<br />
<strong>de</strong>sarrollo.<br />
d. La <strong>de</strong>ficiente organización socioeconómica <strong>de</strong> los productores industriales y artesano -<br />
les, <strong>la</strong> carencia <strong>de</strong> medios <strong>de</strong> transporte propios, <strong>la</strong> <strong>de</strong>ficiente red <strong>de</strong> vfas <strong>de</strong> comunicación<br />
y <strong>la</strong> intervención <strong>de</strong> comerciantes intermediarios impi<strong>de</strong>n que este sector pueda<br />
operar y ampliar sus activida<strong>de</strong>s y participar equititativamente <strong>de</strong>l valor que tienen sus<br />
productos en los diferentes mercados.<br />
e. Existen diversas instituciones que están ligadas al sector industrial y artesanal, pero <strong>la</strong><br />
coordinación <strong>de</strong> acciones entre el<strong>la</strong>s es limitada.<br />
f. El valor bruto <strong>de</strong> producción <strong>de</strong>rivado <strong>de</strong> <strong>la</strong> actividad industrial <strong>de</strong> <strong>la</strong> zona alcanza ni<br />
veles podo significativos en comparación al valor bruto <strong>de</strong> producción nacional.<br />
g. El Banco Industrial <strong>de</strong>l Perú es <strong>la</strong> principal fuente <strong>de</strong> capitales para <strong>la</strong> industria y arte<br />
sania regional; sin embargo, su operatividad no se a<strong>de</strong>cúa a <strong>la</strong>s necesida<strong>de</strong>s y a <strong>la</strong> si -<br />
tuación real <strong>de</strong> <strong>la</strong> zona, motivo por el cual su intervención es limitada.<br />
h. Los establecimientos industriales que tienen mayor importancia, tanto por su <strong>volumen</strong><br />
como por el valor <strong>de</strong> su producción, son los que se <strong>de</strong>dican a <strong>la</strong> fabricación <strong>de</strong> quesos<br />
y mantequil<strong>la</strong> y a <strong>la</strong> e<strong>la</strong>boración <strong>de</strong> chancaca, <strong>de</strong> aguardiente <strong>de</strong> caria <strong>de</strong> azúcar y <strong>de</strong><br />
bebidas gaseosas.<br />
i. La mayor concentración industrial se encuentra en el Sector I, con un porcentaje equivalente<br />
al 73.2% <strong>de</strong>l total, mientras que al Sector II le correspon<strong>de</strong> sólo el 26.8% <strong>de</strong>l<br />
total.<br />
¡. La pob<strong>la</strong>ción <strong>de</strong>dicada a <strong>la</strong> pequeña industria es numerosa, pero carece <strong>de</strong> un a<strong>de</strong>cúa-
DIAGNOSTICO AGROPECUARIO Pág. 49 £:<br />
do sistema <strong>de</strong> asistencia técnica, empleando una tecnología anticuada y equipos ina -<br />
<strong>de</strong>cuados con escasez <strong>de</strong> recursos financieros, así como limitado capital <strong>de</strong> trabajo y,<br />
como resultado, se observa una baja productividad<br />
k. La industria <strong>de</strong> productos lácteos está orientada a <strong>la</strong> fabricación <strong>de</strong> queso y mantequi -<br />
lia; en el año 1974,, utilizó 7,500 TM <strong>de</strong> leche fresca, por un valor aproximado <strong>de</strong><br />
S/,44 s l02,000,00, permitiendo e<strong>la</strong>borar 624 TM <strong>de</strong> quesoymantequil<strong>la</strong>.<br />
I. La industria <strong>de</strong> bebidas gaseosas produjo en el año 1975 un total <strong>de</strong> 325,625 litros, con<br />
un valor bruto aproximado <strong>de</strong> S/.2'220,000.00,<br />
II.<br />
La industria <strong>de</strong> <strong>de</strong>rivados <strong>de</strong> <strong>la</strong> caña <strong>de</strong> azúcar y <strong>la</strong> <strong>de</strong>dicada a <strong>la</strong> e<strong>la</strong>boración <strong>de</strong> chají<br />
caca y <strong>de</strong> aguardiente obtuvo en el año 1975 un valor bruto <strong>de</strong> producción <strong>de</strong> aproxi -<br />
madamente S/.23'651,000.00 .<br />
m. La industria <strong>de</strong> <strong>la</strong> ma<strong>de</strong>ra y <strong>la</strong> <strong>de</strong> productos <strong>de</strong> molinería tienen un limitado impacto e<br />
conómico en <strong>la</strong> zona <strong>de</strong> estudio»<br />
n. La artesanfa es una actividad <strong>de</strong> gran importancia socioeconómica, sirviendo como ex_<br />
presión <strong>de</strong> arte popu<strong>la</strong>r y, muchas veces, como complemento <strong>de</strong> <strong>la</strong> actividad agrope —<br />
cuaria; en otros casos, se constituye en <strong>la</strong> principal fuente <strong>de</strong> ingresos <strong>de</strong> <strong>la</strong>s personas<br />
que se <strong>de</strong>dican a el<strong>la</strong>.<br />
ñ« El turismo en <strong>la</strong> zona <strong>de</strong> estudio es casi nulo, involucrando bajo este índice al turismo<br />
interno; esta situación se <strong>de</strong>be principalmente a <strong>la</strong> ausencia <strong>de</strong> una infraestructura <strong>de</strong><br />
servicios y a <strong>la</strong> <strong>de</strong>ficiente red <strong>de</strong> vías <strong>de</strong> comunicación.<br />
o. Son importantes como atractivos turísticos el Parque Nacional <strong>de</strong> Cutervo; <strong>la</strong>s ruinas ar<br />
queológicas <strong>de</strong> Ventanil<strong>la</strong>s, Kuntur Wassi e Incatambo, ubicadas en el distrito <strong>de</strong> San<br />
Pablo; asimismo, <strong>de</strong>stacan <strong>la</strong>s ruinas <strong>de</strong> Catán y Tantarica, ubicadas en <strong>la</strong> provincia <strong>de</strong><br />
Contumazá.<br />
4. Recomendaciones Referentes a <strong>la</strong> Estructura <strong>de</strong> Producción<br />
a. La existencia <strong>de</strong> importantes áreas cultivadas <strong>de</strong> especies nativas como <strong>la</strong> oca, el ollu<br />
co, <strong>la</strong> mashua, <strong>la</strong> arracacha y <strong>la</strong> pituca, don<strong>de</strong> otros tipos <strong>de</strong> p<strong>la</strong>ntas crecen con limitaciones,<br />
permite recomendar que se incentive <strong>la</strong> investigación, <strong>la</strong> difusión y <strong>la</strong> pro -<br />
ducción <strong>de</strong> estos cultivos para diversificar <strong>la</strong> dieta alimenticia y aumentar su consumo<br />
en otros mercados, maximizando el uso <strong>de</strong> <strong>la</strong> tierra mediante especies ecológicamente<br />
adaptadas a <strong>la</strong> zona.<br />
b. En <strong>la</strong>s áreas dotadas <strong>de</strong> riego permanente y con condiciones favorables <strong>de</strong> suelos, clima<br />
y vías <strong>de</strong> acceso, se <strong>de</strong>be promover el cultivo <strong>de</strong> hortalizas, <strong>de</strong>biendo ser dirigida su<br />
producción al abastecimiento permanente <strong>de</strong> los mercados circundantes
Pág. 496<br />
ZONA NORTE DE CAJAMARCA<br />
c. Teniendo en cuenta <strong>la</strong> existencia <strong>de</strong> consi<strong>de</strong>rables áreas <strong>de</strong> cultivos con diferentes mi<br />
croclimas aparentes para el <strong>de</strong>sarrollo <strong>de</strong> especies frutales, tropicales y subtropicales ,<br />
se recomienda <strong>la</strong> insta<strong>la</strong>ción <strong>de</strong> viveros y <strong>la</strong> estructuración <strong>de</strong> programas que promocio<br />
nen p<strong>la</strong>ntaciones <strong>de</strong> este tipo.<br />
d. Dado que el cultivo <strong>de</strong> arracacha presenta ventajas <strong>de</strong> resistencia a <strong>la</strong>s he<strong>la</strong>das y se<br />
<strong>de</strong>sarrol<strong>la</strong> en climas fríos, se recomienda realizar estudios <strong>de</strong> selección y mejoramiento<br />
para obtener varieda<strong>de</strong>s <strong>de</strong> alto rendimiento que permitan asegurar su ingreso al mer<br />
cado y competir con otros productos simi<strong>la</strong>reso<br />
e. La presencia <strong>de</strong> p<strong>la</strong>ntas productoras <strong>de</strong> fibras, como <strong>la</strong>s cabuyas y/o maguey (Furcroya<br />
andina o chuchao y Agave sp.), que crecen en <strong>la</strong>s áreas eriazas y marginales <strong>de</strong> <strong>la</strong>szo<br />
ñas cálidas y temp<strong>la</strong>das, permiten recomendar que se realicen estudios y proyectos que<br />
hagan factible su futura explotación racional, siempre y cuando se increménte<strong>la</strong> pro -<br />
ducción unitaria y <strong>la</strong> calidad <strong>de</strong> <strong>la</strong>s fibras mediante programas <strong>de</strong> investigación agrfco<br />
<strong>la</strong>.<br />
f. La existencia <strong>de</strong> extensas áreas en el grupo N 0 2 <strong>de</strong> suelos (Cap. Vil), que son aparen<br />
tes para el <strong>de</strong>sarrollo <strong>de</strong> bosques, pastos naturales y cultivos permanentes, permite recomendar<br />
<strong>la</strong> insta<strong>la</strong>ción <strong>de</strong> viveros forestales y <strong>la</strong> posterior p<strong>la</strong>ntación <strong>de</strong> bosques <strong>de</strong><br />
especies adaptables al medio ambiente <strong>de</strong> <strong>la</strong>s zonas <strong>de</strong> vida, simultáneamente a <strong>la</strong> implementación<br />
<strong>de</strong> un a<strong>de</strong>cuado p<strong>la</strong>n <strong>de</strong> uso <strong>de</strong> los pastos naturales»<br />
g„ Para el sembrío <strong>de</strong> los cultivos alimenticios se utilizan semil<strong>la</strong>s en cuya selección no<br />
se usan a<strong>de</strong>cuados criterios técnicos; este hecho se refleja en los bajos rendimientos que<br />
se obtienen en <strong>la</strong>s cosechas, por lo que se recomienda <strong>la</strong> creación <strong>de</strong> un Centro Regio<br />
nal <strong>de</strong> Producción y Distribución <strong>de</strong> semil<strong>la</strong>s, en el que <strong>de</strong>be darse especial importancia<br />
a los cultivos que ocupan mayor área, como el maíz, cebada, papa y especies nativas.<br />
h. El conjunto <strong>de</strong> recomendaciones muestra que en <strong>la</strong> zona es necesario establecer un cen<br />
tro <strong>de</strong> investigación agropecuario, así como un centro productor <strong>de</strong> semil<strong>la</strong>s <strong>de</strong> p<strong>la</strong>ntas<br />
alimenticias, forrajeras e industríales, que podría trabajar en estrecha coordinación con<br />
<strong>la</strong> Universidad Técnica <strong>de</strong> Cajamarca (U.T.C.), el Centro Regional <strong>de</strong> Investigación<br />
Agraria <strong>de</strong>l Norte (CRIAN II) y el Proyecto Piloto Cajamarca - La Libertad (PPCLL).<br />
i. Las diferentes c<strong>la</strong>ses <strong>de</strong> suelos, así como <strong>la</strong>s variables condiciones topográficas, requie<br />
ren el perfeccionamiento <strong>de</strong> los instrumentos <strong>de</strong> <strong>la</strong>branza que se adapten a <strong>la</strong>s caracteristicas<br />
<strong>de</strong> <strong>la</strong> zona, para lograr un mejor <strong>la</strong>boreo <strong>de</strong> <strong>la</strong> tierra.<br />
j. Teniendo en consi<strong>de</strong>ración que el uso <strong>de</strong> los fertilizantes representa un alto costo <strong>de</strong><br />
inversión en los cultivos, aparte <strong>de</strong>l <strong>de</strong>ficiente suministro existente a los centros <strong>de</strong> pro<br />
ducción, se requiere estructurar programas <strong>de</strong> capacitación y divulgación para los agri<br />
cultores en <strong>la</strong> técnica <strong>de</strong>l uso <strong>de</strong> abono <strong>de</strong> corral, en <strong>la</strong> preparación <strong>de</strong> compost, en el<br />
abonamiento en ver<strong>de</strong> y en el uso <strong>de</strong> mezc<strong>la</strong>s orgánico-minerales que permiten un mejor<br />
aprovechamiento <strong>de</strong> los residuos animales, <strong>de</strong> los rastrojos y <strong>de</strong> los cultivos especiales<br />
que tien<strong>de</strong>n a mejorar el nivel <strong>de</strong> fertilidad <strong>de</strong> los suelos.
DIAGNOSTICO AGROPECUARIO Pág. 497<br />
k- Las cuantiosas pérdidas que se tiene actualmente <strong>de</strong>bido al <strong>de</strong>sconocimiento <strong>de</strong>l uso <strong>de</strong><br />
pesticidas en <strong>la</strong> agricultura disminuirá si se establecen normas y/o reg<strong>la</strong>mentos obligatorios<br />
<strong>de</strong> control <strong>de</strong> p<strong>la</strong>gas y enfermeda<strong>de</strong>s en los diferentes cultivos; medida que <strong>de</strong>be<br />
ser apoyada por un programa <strong>de</strong> capacitación permanente a través <strong>de</strong> los núcleos <strong>de</strong><br />
producción locales y por I mea <strong>de</strong> cultivo, <strong>de</strong> manera que se aproveche el efecto multiplicador<br />
<strong>de</strong> <strong>la</strong> enseñanza <strong>de</strong> estas prácticas-<br />
I. Siendo el monocultivo anual, especialmente en <strong>la</strong>s áreas <strong>de</strong> maíz, <strong>de</strong> arroz, <strong>de</strong> caña <strong>de</strong><br />
azúcar y <strong>de</strong> cereales, una práctica generalizada que provoca el agotamiento <strong>de</strong> los te<br />
rrenos, es recomendable motivar a los agricultores para que efectúen rotaciones y atenú<br />
en en esta forma <strong>la</strong> pérdida <strong>de</strong> <strong>la</strong> fertilidad <strong>de</strong> los suelos.<br />
IL<br />
El capital <strong>de</strong> trabajo proviene casi siempre <strong>de</strong> los recursos <strong>de</strong>l agricultor y/o gana<strong>de</strong>ro,<br />
por lo que se hace necesario establecer en forma complementaria una estructura amplia<br />
y operativa <strong>de</strong> crédito que permita proveer, a intereses y p<strong>la</strong>zos a<strong>de</strong>cuados, dicho capital<br />
al sector agrario,<br />
m. La transformación simple <strong>de</strong> algunos productos, como papaseca, chochoca, ¡ora, morón<br />
y otros, que se lleva a cabo a esca<strong>la</strong> doméstica en el medio rural, necesita <strong>de</strong> un ma -<br />
yor apoyo económico y técnico <strong>de</strong> los organismos <strong>de</strong> <strong>de</strong>sarrollo regional con el fin <strong>de</strong><br />
constituir pequeñas industrias que permitan exportar productos regionales con un mayor<br />
valor agregado y con menor grado <strong>de</strong> perecibilidad, asF como absorber <strong>la</strong> mano <strong>de</strong> obra<br />
familiar exce<strong>de</strong>nte en épocas <strong>de</strong> menor <strong>de</strong>manda <strong>la</strong>boral,<br />
n En <strong>la</strong>s partes altas o alto-andina correspondientes a los subsectores <strong>de</strong> Cajamarca, San<br />
Miguel y Hualgayoc, los pastos naturales están muy poco aprovechados, por lo que es<br />
recomendable <strong>la</strong> organización <strong>de</strong> empresas asociativas que utilicen racionalmente esos<br />
recursos mediante <strong>la</strong> crianza <strong>de</strong> vacunos, ovinos, auquénidos y/o equinos (para carne).<br />
Simultáneamente, se <strong>de</strong>ben realizar estudios <strong>de</strong> adaptación y experimentación <strong>de</strong> especies<br />
forrajeras exóticas <strong>de</strong> mejores cualida<strong>de</strong>s y que sobre todo sean pa<strong>la</strong>tables, <strong>de</strong> gran<br />
rendimiento y <strong>de</strong> alto valor alimenticio,<br />
n. Dada <strong>la</strong> trascen<strong>de</strong>ntal importancia que tiene <strong>la</strong> crianza doméstica <strong>de</strong> cuyes, es necesario<br />
que los organismos vincu<strong>la</strong>dos a este tipo <strong>de</strong> activida<strong>de</strong>s realicen estudios <strong>de</strong> diag -<br />
nóstico y control <strong>de</strong> <strong>la</strong>s enfermeda<strong>de</strong>s que los afectan, <strong>de</strong>biendo estructurarse en forma<br />
simultánea programas <strong>de</strong> mejoramiento genético y <strong>de</strong> manejo.<br />
o* A nivel <strong>de</strong> pequeña propiedad, <strong>la</strong> conducción indirecta <strong>de</strong> <strong>la</strong> tierra en sus diversas formas<br />
está muy generalizada, por lo que es urgente que <strong>la</strong>s acciones <strong>de</strong> reforma agraria se<br />
intensifiquen, con <strong>la</strong> finalidad <strong>de</strong> eliminar <strong>la</strong>s modalida<strong>de</strong>s antisociales <strong>de</strong> explotación<br />
<strong>de</strong> <strong>la</strong> tierra.<br />
p<br />
La productividad <strong>de</strong> los fundos en <strong>la</strong> zona pue<strong>de</strong> incrementarse sustancia I men te en los<br />
principales cultivos, como papa, maíz, cebada y otros; para lograr ese objetivo se requiere<br />
<strong>de</strong>l abastecimiento oportuno <strong>de</strong> insumos agnco<strong>la</strong>s, por lo que se recomienda que<br />
el Estado implemente, a nivel regional, una infraestructura <strong>de</strong> transporte, así como el<br />
almacenamiento y distribución <strong>de</strong> esos productos, <strong>de</strong> manera qué sean fácilmente acce-
Pág. 498<br />
ZONA NORTE DE CAJAMARCA<br />
- , sibles a los agricultores individuales y/o a <strong>la</strong>s organizaciones campesinas.<br />
q 0 . El asesoramiento técnico que otorga el Ministerio <strong>de</strong> Agricultura es insuficiente por <strong>la</strong><br />
gran extensión <strong>de</strong>l área que abarca, recomendándose que su mejoramiento sea <strong>de</strong> carác<br />
ter integral; en forma complementaria; <strong>de</strong>be dotársele <strong>de</strong> medios y recursos que guar -<br />
<strong>de</strong>n corre<strong>la</strong>ción con <strong>la</strong> amplitud <strong>de</strong> los servicios a prestar.<br />
r<br />
Se recomienda ¡mplementar un mayor y mejor servicio <strong>de</strong> extensión agraria que emplee<br />
eficientes sistemas <strong>de</strong> divulgación técnica y <strong>de</strong> consul tona, que permitan incrementar<br />
<strong>la</strong> producción y <strong>la</strong> productividad <strong>de</strong> <strong>la</strong>s explotaciones agropecuarias y forestales, asf<br />
como motivar a los agricultores, individualmente o en grupos, para que contribuyan en<br />
los programas <strong>de</strong> conservación <strong>de</strong> suelos, <strong>de</strong> uso y conservación <strong>de</strong> aguas, <strong>de</strong> foresta -<br />
ción y <strong>de</strong> pastos, que, en última instancia, están <strong>de</strong>stinadas a mejorar <strong>la</strong>s condiciones<br />
<strong>de</strong> vida <strong>de</strong>l campesino.<br />
> SIMAMOS, en el área <strong>de</strong> organizaciones rurales, <strong>de</strong>be promover, organizar y supervisar<br />
<strong>la</strong> formación <strong>de</strong> empresas comunales que tengan una actividad permanente y continua,<br />
<strong>de</strong> manera que puedan absorber <strong>la</strong> mano <strong>de</strong> obra <strong>de</strong>socupada <strong>de</strong> <strong>la</strong>s comunida<strong>de</strong>s .<br />
Con tal fin, SIMAMOS <strong>de</strong>bería incrementar sus unida<strong>de</strong>s <strong>de</strong> promoción <strong>de</strong> base en <strong>la</strong><br />
zona, dotándoseles <strong>de</strong> recursos y <strong>de</strong> medios (técnicos, insta<strong>la</strong>ciones, equipos y perso -<br />
nal), para que pueda cumplir con <strong>la</strong>s funciones recomendadas en el sector agrario.<br />
5. Recomendaciones sobre <strong>la</strong> Estructura <strong>de</strong> Comercialización<br />
a t<br />
Modificar y adaptar <strong>la</strong> estructura socioeconómica <strong>de</strong> comercialización a <strong>la</strong>s caracteris<br />
ticas <strong>de</strong> <strong>la</strong> nueva estructura <strong>de</strong> producción agraria y a los requerimientos <strong>de</strong> los mercados<br />
<strong>de</strong> consumo, promoviendo el abandono <strong>de</strong>l criterio mercantil <strong>de</strong>l proceso, para asu<br />
mir un rol netamente social en beneficio <strong>de</strong> <strong>la</strong> comunidad.<br />
b. Motivar a los conductores directos y a los organizaciones campesinas existentes para<br />
que se integren en centrales o empresas asociativas, con el propósito <strong>de</strong> participar en<br />
forma organizada en <strong>la</strong> solución <strong>de</strong> los problemas <strong>de</strong> comercialización y distribución <strong>de</strong><br />
los productos regionales, así como para el abastecimiento <strong>de</strong> insumos.<br />
c. Limitar, mediante dispositivos especiales, <strong>la</strong> participación <strong>de</strong>l excesivo número <strong>de</strong> cof<br />
merciantes intermediarios en <strong>la</strong> comercialización <strong>de</strong> los productos alimenticios básicos,<br />
en forma que regule, controle y fiscalice <strong>la</strong> participación <strong>de</strong> éstos en el proceso.<br />
d. Aplicar y difundir una política <strong>de</strong> precios para productos agropecuarios <strong>de</strong> <strong>la</strong> región/<br />
con el objeto <strong>de</strong> conciliar los intereses económicos y sociales <strong>de</strong> los productores, consumidores<br />
y comerciantes; al mismo tiempo que incentive <strong>la</strong> producción, satisfaga <strong>la</strong>s<br />
necesida<strong>de</strong>s <strong>de</strong> consumo y motive <strong>la</strong> participación justa <strong>de</strong> los comerciantes.<br />
e. Reforzar <strong>la</strong> ímplementación tecno-administrativa <strong>de</strong> <strong>la</strong> Empresa Pública <strong>de</strong> Servicios A<br />
gropecuarios con <strong>la</strong> finalidad <strong>de</strong> ampliar su frontera <strong>de</strong> servicios y perfeccionar el ma-
DIAGNOSTICO AGROPECUARIO Pág. 499<br />
nejo <strong>de</strong> los precios <strong>de</strong> garantía y <strong>de</strong> refugio <strong>de</strong> los productos agropecuarios sometidos a<br />
estos regímenes; así como para propiciar una mayor participación <strong>de</strong> esta empresa en<br />
el proceso <strong>de</strong> comercialización regional.<br />
f. Difundir y aplicar, mediante seminarios <strong>de</strong> divulgación, <strong>la</strong>s normas técnicas <strong>de</strong> comer<br />
cialización e<strong>la</strong>boradas por el Instituto <strong>de</strong> Investigación Tecnológica Industrial y <strong>de</strong><br />
Normas Técnicas (ITINTEC), entre los productores, los comerciantes y los consumidores;<br />
estos seminarios <strong>de</strong>berán ser organizados por el Centro Nacional <strong>de</strong> Capacitación<br />
e Investigación para <strong>la</strong> Reforma Agraria (CENCIRA), en coordinación con el Ministerio<br />
<strong>de</strong> Comercio y <strong>de</strong> Alimentación, con el fin <strong>de</strong> estandarizar los elementos <strong>de</strong> merca<br />
<strong>de</strong>a»<br />
g. Implementar a<strong>de</strong>cuadamente los servicios <strong>de</strong> transporte <strong>de</strong> <strong>la</strong> Empresa Pública <strong>de</strong> Servi<br />
cios Pesqueros (EPSEP), con <strong>la</strong> finalidad <strong>de</strong> aumentar <strong>la</strong> participación <strong>de</strong> esta institu -<br />
ción en el abastecimiento <strong>de</strong> productos hidrobiológicos en <strong>la</strong> región.<br />
h. Reforzar <strong>la</strong> capacidad operativa <strong>de</strong>l Ministerio <strong>de</strong> Pesquería, para efectuar estudios <strong>de</strong><br />
repob<strong>la</strong>ción <strong>de</strong> truchas en <strong>la</strong>s aguas continentales <strong>de</strong> <strong>la</strong> región, previo estudio <strong>de</strong> <strong>la</strong><br />
siembra <strong>de</strong> especies fitófagas, que sirvan <strong>de</strong> alimento a este salmónido.<br />
¡ 0 Organizar a los consumidores regionales con el objeto <strong>de</strong> modificar los patrones <strong>de</strong> con<br />
sumo distorsionados mediante programas <strong>de</strong> divulgación y <strong>de</strong> comunicación masiva que<br />
capaciten a <strong>la</strong> comunidad en materia alimentaria y nutrícional <strong>de</strong> tal manera que el<br />
consumo sea orientado a <strong>la</strong> producción local.<br />
j. Dotar a <strong>la</strong> región <strong>de</strong> <strong>la</strong> infraestructura <strong>de</strong> comercialización necesaria para garantizar el<br />
control, <strong>la</strong> preparación comercial, el almacenamiento, <strong>la</strong> distribución y el abastecí -<br />
miento regional <strong>de</strong> productos, en base a <strong>la</strong>:construcción <strong>de</strong> <strong>la</strong>s siguientes insta<strong>la</strong>ciones:<br />
Centros <strong>de</strong> acopio y empaque para productos agríco<strong>la</strong>s regionales en los sectores<br />
<strong>de</strong> Contumazá, Chota y Cutervo.<br />
Centros <strong>de</strong> beneficio <strong>de</strong> ganado en los sectores <strong>de</strong> Contumazó, Chota, Cutervo y<br />
Bambamarca.<br />
Centros <strong>de</strong> recepción <strong>de</strong> almacenamiento y <strong>de</strong> redistribución <strong>de</strong> productos alimen<br />
ticios en Chota y Cutervo.<br />
Insta<strong>la</strong>ción <strong>de</strong> mercados minoristas, preferentemente <strong>de</strong> tipo cooperativo.<br />
Centros <strong>de</strong> distribución regional <strong>de</strong> insumes.
Pág. 500<br />
ZONA NORTE DE CAJAMARCA<br />
6. Recomendaciones Referentes a <strong>la</strong> Ag ro i nd us tr ia, ArtesanTa y Turi<br />
smo<br />
a. Se hace necesario <strong>la</strong> promoción, formación y financiamiento <strong>de</strong> nuevas empresas indus<br />
trioles, así como fortalecer y ampliar <strong>la</strong>s existentes para lo cual se <strong>de</strong>be utilizar aí"<br />
máximo el criterio <strong>de</strong> integración <strong>de</strong> recursos humanos y <strong>la</strong>s materias primas factibles<br />
<strong>de</strong> industrialización en <strong>la</strong> región.<br />
b„ Las industrias manufactureras que pue<strong>de</strong>n propiciarse en <strong>la</strong> zona <strong>de</strong>ben corregir <strong>la</strong> estructura<br />
actual y, lo que es importante, fomentar cierto nivel <strong>de</strong> procesamiento que es<br />
muy limitado a esca<strong>la</strong> nacional. También se hace necesario asegurar el perfeccionamiento<br />
<strong>de</strong> <strong>la</strong>s industrias insta<strong>la</strong>das, con el fin <strong>de</strong> elevar el nivel técnico <strong>de</strong> producción<br />
y productividad actual o<br />
c. Es conveniente <strong>la</strong> movilización <strong>de</strong> recursos <strong>de</strong>l sector público y privado para el fomen<br />
to y asistencia <strong>de</strong> <strong>la</strong> pequeña industria y artesanía»<br />
d. El Instituto Nacional <strong>de</strong> P<strong>la</strong>nificación, a través <strong>de</strong> su Oficina en Cajamarca, <strong>de</strong>be<br />
coordinar con los diferentes organismos e instituciones nacionales e internacionales <strong>la</strong><br />
estructuración <strong>de</strong> un p<strong>la</strong>n coherente <strong>de</strong> industrialización, promoviendo a su vez <strong>la</strong> e<br />
jecución <strong>de</strong> estudios a diferente nivel que permita crear <strong>la</strong> estructura <strong>de</strong> servicios, <strong>de</strong><br />
financiación y <strong>la</strong> insta<strong>la</strong>ción <strong>de</strong> p<strong>la</strong>ntas <strong>de</strong> procesamiento <strong>de</strong> productos agropecuarios,<br />
dándose preferencia a <strong>la</strong> industrialización <strong>de</strong> productos,peúéario^especialmente los<br />
lácteos, como queso y mantequil<strong>la</strong>,<br />
e. Se <strong>de</strong>ben establecer objetivos inmediatos que propicien el <strong>de</strong>sarrollo <strong>de</strong> <strong>la</strong> actividad<br />
artesanal, mediante una capacitación en el aspecto técnico^ organizativo y empresarial;<br />
asf como un mejoramiento en <strong>la</strong> calidad y cantidad <strong>de</strong> los productos para competir<br />
en forma ventajosa en nuevos mercados, mejorar los rendimientos, ofrecer nuevas<br />
formas <strong>de</strong> acabado en los productos para dar variedad a <strong>la</strong> producción y, a <strong>la</strong> vez, res<br />
catar e incrementar el uso <strong>de</strong> antiguas formas <strong>de</strong> expresión. Asimismo, es importante<br />
fomentar <strong>la</strong> insta<strong>la</strong>ción <strong>de</strong> talleres artesanales y proporcionar facilida<strong>de</strong>s para el abas<br />
tecimiento <strong>de</strong> insumos, ayuda en <strong>la</strong> comercialización y asesoramiento para <strong>la</strong> obtención<br />
<strong>de</strong> créditos,,<br />
f. Es conveniente limitar <strong>la</strong> participación <strong>de</strong>l excesivo numero <strong>de</strong> comerciantes intermediarios<br />
en <strong>la</strong> comercialización <strong>de</strong> los productos, tanto industriales como artesanales»<br />
g» Es importante <strong>la</strong> a<strong>de</strong>cuación <strong>de</strong> <strong>la</strong> estructura <strong>de</strong>l Banco Industrial <strong>de</strong>l Perú a <strong>la</strong> real i -<br />
dad socioeconómica <strong>de</strong> <strong>la</strong> zona, <strong>de</strong>biendo <strong>de</strong>sarrol<strong>la</strong>r una <strong>la</strong>bor <strong>de</strong> promoción crediticia<br />
con el fin <strong>de</strong> brindar servicio en aquel<strong>la</strong>s áreas que no lo disponen; también es ne<br />
cesarlo agilizar el sistema <strong>de</strong> tramitación <strong>de</strong> los préstamos para darles una mayor operatividado<br />
h. Es preciso incentivar el turismo para lo cual es necesario crear una infraestructura tu-
DIAGNOSTICO AGROPECUARIO Pág„ 501<br />
rístíca que permita aprovechar los recursos que presenta <strong>la</strong> zona <strong>de</strong> estudio.<br />
i. Se <strong>de</strong>be promover <strong>la</strong> formu<strong>la</strong>ción <strong>de</strong> proyectos multisectoriales <strong>de</strong>ntro <strong>de</strong> <strong>la</strong> región, con<br />
el objeto <strong>de</strong> encontrar soluciones integrales para los problemas <strong>de</strong> <strong>la</strong> producción agrope<br />
cuaría e industrial, asi" como para <strong>la</strong> comercialización y abastecimiento <strong>de</strong> alimentos e<br />
insumes o<br />
•o
ANEXOS
ANEXO I<br />
CARACTERÍSTICAS<br />
GENERALES<br />
Pob<strong>la</strong>ción económicamente activa en <strong>la</strong> zona <strong>de</strong> estudio.<br />
Pob<strong>la</strong>ción empadronada en el <strong>de</strong>partamento <strong>de</strong> Cajamarca, según <strong>de</strong>partamentos y pro<br />
vincias <strong>de</strong> origen.<br />
Matricu<strong>la</strong> por núcleo educativo comunal, según niveles y modalidad.<br />
Tasas <strong>de</strong> mortalidad en <strong>la</strong> zona <strong>de</strong> estudio.<br />
Casos notificados <strong>de</strong> enfermeda<strong>de</strong>s.transmisibles.<br />
Principales recursos humanos y su tasa por habitante.<br />
Materiales predominantes por vivienda.<br />
Viviendas según régimen <strong>de</strong> tenencia.<br />
Dotación <strong>de</strong> servicios en viviendas.
Sectores<br />
por<br />
Provincias<br />
Sector 1<br />
Hualgayoc<br />
Chota<br />
lo<br />
Cutervo<br />
Santa Cruz<br />
Sector 2<br />
Cajamarca<br />
Contumazá<br />
"¡o<br />
San Miguel<br />
Total<br />
%<br />
Total<br />
176,965<br />
100.0<br />
62,217<br />
100.0<br />
59,436<br />
100.0<br />
47,111<br />
100.0<br />
8,201<br />
100.0<br />
83,249<br />
100.0<br />
39,<strong>03</strong>7<br />
100.0<br />
13,374<br />
100.0<br />
30,838<br />
100.0<br />
260,214<br />
100.0<br />
..<br />
CUADRO N° 1<br />
POBLACIÓN ECONÓMICAMENTE ACTIVA EN LA ZONA DE ESTUDIO<br />
Pob<strong>la</strong>ción Económicamente<br />
Pob<strong>la</strong>ción Total » Activa (*) y Tasa <strong>de</strong><br />
Urbana<br />
23,313<br />
13.2<br />
6,171<br />
9.9<br />
9,187<br />
15.5<br />
7,135<br />
15.1<br />
820<br />
10.0<br />
11,311<br />
13.6<br />
4,324<br />
11.1<br />
4,213<br />
31.5<br />
2,774<br />
9.0<br />
34,264<br />
13.2<br />
Rural<br />
153,652<br />
86.8<br />
56,046<br />
90,1<br />
50,249<br />
84.5<br />
39,976<br />
84.9<br />
7,381<br />
90.0<br />
71,938<br />
186.4<br />
37,713<br />
88.9<br />
9,161<br />
68.5<br />
28,064<br />
91 0<br />
225,590<br />
86.8<br />
i<br />
Total<br />
43,981<br />
24.9<br />
17,110<br />
27.5<br />
14,205<br />
23.9<br />
10,788<br />
22.9<br />
1,878<br />
22.9<br />
20,828<br />
25.0<br />
9,876<br />
25.3<br />
3,705<br />
27.7<br />
7,247<br />
23.5<br />
64,809<br />
24.9<br />
Actividad<br />
Urbana<br />
6,305<br />
27.0<br />
1,740<br />
28.2<br />
2,<strong>45</strong>3<br />
26.7<br />
1,805<br />
22.6<br />
217<br />
26.5<br />
2,978<br />
26.3<br />
1,094<br />
25.3<br />
1,154<br />
27.4<br />
730<br />
26,3<br />
9,283<br />
27.1<br />
Rural<br />
37,766<br />
24.6<br />
15,370<br />
27.4<br />
11,752<br />
23.5<br />
8,983<br />
1,661<br />
22.4<br />
17,850<br />
24.8<br />
8,782<br />
25.3<br />
2,551<br />
27.9<br />
6,517<br />
23.2<br />
55,616<br />
24.7<br />
Total<br />
43,365<br />
16,888<br />
14,020<br />
10,615<br />
1,842<br />
20,294<br />
9,580<br />
3,568<br />
7,146<br />
63,659<br />
Ocupada<br />
Urbana<br />
5,932<br />
1,639<br />
2,360<br />
1,724<br />
Pob<strong>la</strong>ción Económicamente Activa<br />
209<br />
2,807<br />
1,012<br />
1,095<br />
700<br />
8,739<br />
Rural<br />
37,433<br />
15,249<br />
11,660<br />
8,891<br />
1,633<br />
17,487<br />
8,568<br />
2,473<br />
6,446<br />
54,920<br />
Total<br />
616<br />
222<br />
185<br />
173<br />
36<br />
534<br />
296<br />
137<br />
101<br />
1,150<br />
Desocupada<br />
n<br />
(*) Pob<strong>la</strong>ción económicamente activa <strong>de</strong> 6 años y más. ><br />
Fuente : Cuadros N° 20 y 21 <strong>de</strong>l VII Censo Nacional <strong>de</strong> Pob<strong>la</strong>ción, Cajamarca 1972. ><br />
2<br />
Urbana<br />
283<br />
101<br />
93<br />
81<br />
8<br />
171<br />
82<br />
59<br />
30<br />
<strong>45</strong>4<br />
Rural<br />
333<br />
121<br />
92<br />
92<br />
28<br />
363<br />
214<br />
78<br />
71<br />
69G
CUADRO N l 2<br />
POBLACIÓN EMPADRONADA EN EL DEPARTAMENTO DE CAJAMARCA SEGÚN DEPARTAMENTOS Y PROVINCI ftS DE ORÍ GEN<br />
><br />
z<br />
X<br />
O<br />
Pob<strong>la</strong> ción <strong>de</strong>l Departa mentó <strong>de</strong> Cajamar -<br />
ca Se gún Departamento <strong>de</strong> Nacimiento u<br />
Oriaen<br />
(1).<br />
(2).<br />
(3).<br />
(4).<br />
(5).<br />
(6).<br />
(7).<br />
(8).<br />
(9).<br />
(10).<br />
(11).<br />
(12).<br />
(i3):<br />
(14).<br />
(15).<br />
(16)<br />
(17)<br />
(18)<br />
(19)<br />
(20)<br />
(21)<br />
(22)<br />
(23)<br />
(24)<br />
(25)<br />
Amazonas<br />
Ancash<br />
A pun mac<br />
Arequipa<br />
Ayacucho<br />
Cajamarca<br />
Cal<strong>la</strong>o<br />
Cuzco<br />
Huanca vélica<br />
Huánuco<br />
lea<br />
Junfn<br />
La Libertad<br />
Lambayeque<br />
Lima<br />
Loreto<br />
Madre <strong>de</strong> Dios<br />
Moquegua<br />
Pasco<br />
Piura<br />
Puno<br />
San Martin<br />
Tacna<br />
Tumbes<br />
Extranjero<br />
No especffico<br />
092<br />
878<br />
202<br />
350<br />
186<br />
867,938'<br />
157<br />
154<br />
114<br />
134<br />
131<br />
230<br />
9,562<br />
7,671<br />
3 5 072<br />
218<br />
31<br />
24<br />
53<br />
21,415<br />
136<br />
241<br />
32<br />
109<br />
335<br />
3.696<br />
0.2<br />
0.1<br />
0.1<br />
0.1<br />
--<br />
94.3<br />
--<br />
--<br />
--<br />
--<br />
--<br />
0.1<br />
1.0<br />
0.8<br />
0.3<br />
0.1<br />
--<br />
--<br />
--<br />
2.3<br />
--<br />
0.1<br />
-<br />
--<br />
0.1<br />
0.4<br />
Total<br />
919,161<br />
100.0<br />
Junio <strong>de</strong> 1972<br />
Pob<strong>la</strong>ción <strong>de</strong>l Departamento <strong>de</strong> C; jamar -<br />
ca según Provincia <strong>de</strong> Origen o Nacimien<br />
to.<br />
(6) Cajamarca<br />
(6) Cajabamba<br />
(6) Celendfn<br />
(6) Contumazá<br />
(6) Cutervo<br />
(6) Chota<br />
(6) Hualgayoc<br />
(6) Jaén<br />
(6) Santa Cruz<br />
(6) San Miguel<br />
(6) San Ignacio<br />
No especificado<br />
Total<br />
199,613<br />
56,220<br />
63,096<br />
34,187<br />
112,682<br />
| 146,042<br />
67,109<br />
52,999<br />
47,808<br />
53,327<br />
34,538<br />
317<br />
867,938<br />
23.0<br />
6.5<br />
7.6<br />
3.9<br />
13.0<br />
1 16.8<br />
7.7<br />
6.1<br />
5.5<br />
6.1<br />
4.0<br />
0.1<br />
100.0<br />
Pob<strong>la</strong>ción Nacida en los Depártame itos<br />
<strong>de</strong> Piura, Lambayeque y La Libertac ,<br />
según Provincia,<br />
(20 ) Piura<br />
521 1.3<br />
(20 ) Ayabaca<br />
5,883 15.2<br />
(20 ) Huancabamba 11,924 30,9<br />
(20 i Morropón<br />
2,584 6.6<br />
(20 ) Paita<br />
47 0.1<br />
(20 ) Sul<strong>la</strong>na<br />
255 0.7<br />
(20 ) Ta<strong>la</strong>ra<br />
157 0.4<br />
(20 i No especificado 80 0.2<br />
(13 ) Trujillo<br />
2,961 7.7<br />
(13<br />
(13,<br />
(13,<br />
(13<br />
(13)<br />
(13)<br />
(13]<br />
(14<br />
(14)<br />
(14]<br />
(14)<br />
Bolivar<br />
H uamachuco<br />
Otuzco<br />
Pacasmayo<br />
Patáz<br />
Santiago <strong>de</strong> Chuco<br />
No especificado<br />
Chic<strong>la</strong>yo<br />
Lambayeque<br />
Ferreñafe<br />
No especificado<br />
370<br />
2,485<br />
1,226<br />
1,894<br />
362<br />
2<strong>45</strong><br />
19<br />
4,243<br />
2,487<br />
884<br />
57<br />
0.1<br />
6,4<br />
3.2<br />
4.9<br />
0.9<br />
0.6<br />
--<br />
12.0<br />
6.4<br />
2.3<br />
0.1<br />
Total<br />
38,648<br />
100.0<br />
1<br />
O<br />
pa<br />
><br />
n<br />
H<br />
(Si<br />
H<br />
n<br />
5> on<br />
O<br />
m<br />
><br />
en<br />
Fuente : Cuadros N 0 6 y 7 <strong>de</strong>l VII < Censo N icional <strong>de</strong> Pob<strong>la</strong>ción, C aiamarca.<br />
-a
CUADRO N" 3<br />
MATRICULA POR NÚCLEO EDUCATIVO COMUNAL StGUN NIVELES Y MODALIDAD<br />
1<br />
NÚCLEOS EDUCATIVOS COMUNALES DE LA ZONA DE ESTUDIO<br />
Niveles y Modalida<strong>de</strong>s<br />
01-Z82<br />
<strong>03</strong>-Z82<br />
0Ó-Z8?<br />
07-Z82<br />
08-Z82<br />
09-Z82<br />
11-Z82<br />
i4-za2<br />
19-Z82<br />
10-Z11<br />
ll-Zll<br />
Total<br />
H<br />
M<br />
H<br />
1<br />
M<br />
H<br />
M<br />
H<br />
M<br />
H<br />
M<br />
H<br />
M<br />
H<br />
M<br />
H<br />
M<br />
H<br />
M<br />
H<br />
M<br />
H<br />
M<br />
Educación Inicial<br />
418<br />
397<br />
153<br />
158<br />
30<br />
39<br />
65<br />
62<br />
62<br />
65<br />
50<br />
58<br />
32<br />
38<br />
20<br />
22<br />
66<br />
40<br />
92<br />
87<br />
190<br />
184<br />
2,328<br />
Educación Básica Regu<strong>la</strong>r y Primaria Diurpa<br />
3,244<br />
2,022<br />
2,017<br />
1,767<br />
2,012<br />
1,2<strong>45</strong><br />
2,<strong>03</strong>5<br />
1,627<br />
1,192<br />
1,109<br />
1,928<br />
1,340<br />
4,722<br />
2,269<br />
1,250<br />
933<br />
1,800<br />
1,290<br />
2,655<br />
2,110<br />
3,125<br />
2,531<br />
44,223<br />
Educación Básica Laboral<br />
109<br />
64<br />
173<br />
Educación Superior Profesional<br />
Calificación Profesional Extraordinaria<br />
Eclucación Especial<br />
142<br />
354<br />
6<br />
25<br />
1,027<br />
1<br />
Educación Secundaria Común<br />
- Diurna<br />
1,741<br />
909<br />
343<br />
230<br />
140<br />
73<br />
211<br />
105<br />
316<br />
166<br />
315<br />
130<br />
393<br />
244<br />
75<br />
49<br />
186<br />
154<br />
354<br />
296<br />
6,430<br />
-'Nocturna<br />
553<br />
244<br />
49<br />
23<br />
869<br />
Educación Secundaria Técnica<br />
J-<br />
- Diurna<br />
653<br />
363<br />
1,016<br />
- Nocturna<br />
342<br />
158<br />
500<br />
Educación Técnica Superior<br />
Formación Magisterial<br />
""<br />
•1<br />
N<br />
O<br />
z<br />
><br />
Total Alumnos<br />
Total Personal Docente<br />
Total Au<strong>la</strong>s en Uso<br />
Centros Educativos Estatales<br />
Centros Educativos Particu<strong>la</strong>res<br />
Carta Docente<br />
7,093 4,947<br />
277<br />
304<br />
71<br />
5<br />
43.5<br />
2,562 2,178<br />
168<br />
147<br />
51<br />
1<br />
28.2<br />
2,182 1,357<br />
79<br />
83<br />
35<br />
-<br />
44.8<br />
2;311 1,794<br />
99<br />
111<br />
37<br />
~<br />
41.5<br />
1,576 'l,365<br />
122<br />
108<br />
55<br />
-<br />
24.1<br />
2,293 1,528<br />
90<br />
116<br />
41<br />
2<br />
42.5<br />
5,256 2,615 1,3<strong>45</strong> 1,004<br />
167<br />
83<br />
164 \ 72<br />
59<br />
25<br />
~ -<br />
47.1<br />
28.3<br />
1,866 1,330<br />
78<br />
96<br />
36<br />
4<br />
41.0<br />
2,933 2,35l|3,669 3,011 56,566<br />
254 1 272 1,689<br />
289<br />
54<br />
1<br />
20.8<br />
302<br />
69<br />
2<br />
24.6<br />
1,729<br />
533<br />
15<br />
33.S<br />
o<br />
jo<br />
H<br />
m<br />
a<br />
rn<br />
n<br />
><br />
Fuente : Unidad <strong>de</strong> Programación Estadística; Zona <strong>de</strong> Educación N° 82 y 11; 1 y VIII. Región <strong>de</strong> Educación.<br />
><br />
n<br />
>
ANEXO I - CARACTERÍSTICAS GENERALES P&o 5<br />
CUADRO N 0 4<br />
TASAS DE MORTALIDAD EN LA ZONA DE ESTUDIO<br />
Indicadores<br />
- Mortalidad general<br />
- Mortalidad infantil<br />
- Mortalidad materna<br />
- Mortalidad neo-natal<br />
Tasa x 100<br />
7.86% habitantes<br />
63.23% nacidos vivos<br />
20.01% nacidos vivos<br />
13.29% nacidos vivos<br />
Fuente : Area Hospita<strong>la</strong>ria <strong>de</strong> Cajamarca, Unidad Estadística<br />
CUADRO N 0 5<br />
CASOS NOTIFICADOS DE ENFERMEDADES TRANSMISIBLES<br />
Enfermeda<strong>de</strong>s Transmisibles<br />
- Sarampión<br />
- Tos ferina<br />
- Difteria<br />
- Poliomelitis<br />
- Disenterias<br />
- Tifoi<strong>de</strong>a y paratifoi<strong>de</strong>a<br />
- Hepatitis infecciosa<br />
- Tétanos<br />
- Otras helmintiásis<br />
| - Paludismo<br />
1970<br />
290<br />
43<br />
9<br />
137<br />
—<br />
3<br />
46<br />
—<br />
1971<br />
35<br />
290<br />
6<br />
1<br />
38<br />
327<br />
32<br />
1<br />
223<br />
—<br />
Fuente : Area Hospita<strong>la</strong>ria <strong>de</strong> Cajamarca, Unidad Estadística.<br />
CUADRO N 0 6<br />
1972<br />
93<br />
185<br />
—<br />
1<br />
144<br />
83<br />
34<br />
1<br />
lió<br />
14<br />
1973 |<br />
91<br />
130<br />
1<br />
3 1<br />
39<br />
147<br />
28<br />
1<br />
114<br />
97<br />
PRINCIPALES RECURSOS HUMANOS Y SU TASA POR HABITANTES<br />
Año 1973<br />
Recursos<br />
- Médicos<br />
- Odontólogos<br />
- Enfermeras<br />
- Auxiliares <strong>de</strong> enfermerra<br />
- Obstetrices<br />
| - Técnicos <strong>de</strong> saneamiento<br />
Número<br />
29<br />
4<br />
16<br />
110<br />
4<br />
6<br />
Tasa x 1,000<br />
habitantes |<br />
0.11<br />
0.02<br />
0.06<br />
0.42<br />
0.02<br />
0.02<br />
Fuente : Area Hospita<strong>la</strong>ria <strong>de</strong> Cajamarca, Unidad Estadística,
CUADRO N 0 7<br />
<strong>la</strong>»<br />
VIVIENDAS SEGÚN MATERIALES PREDOMINANTES<br />
Materiales en :<br />
- Pare<strong>de</strong>s<br />
- Pisos<br />
- Techos<br />
Pared <strong>la</strong>drillo<br />
Pared piedra cal o cemento<br />
Pared adobe o tapia<br />
Pared quincha<br />
Pared piedra o barro<br />
Pared ma<strong>de</strong>ra<br />
Pared estera<br />
Otro tipo<br />
Total viviendas<br />
Piso ma<strong>de</strong>ra o parquet<br />
Piso loseta<br />
Piso cemento o <strong>la</strong>drillo<br />
Piso <strong>la</strong>minas asfálticas<br />
Pisotierra y otros<br />
No especificado<br />
Total viviendas<br />
Techo concreto<br />
Techo ma<strong>de</strong>ra<br />
Techo tejas<br />
Techo p<strong>la</strong>nchas <strong>de</strong> ca<strong>la</strong>mina<br />
Techo caña o estera<br />
Techo paja<br />
Techo sil<strong>la</strong>r u otro<br />
Otro material<br />
Total viviendas<br />
Urbajo<br />
Viviendas<br />
159<br />
31<br />
5,440<br />
177<br />
256<br />
6<br />
6<br />
31<br />
6,106<br />
1,258<br />
92<br />
934<br />
12<br />
3,786<br />
24<br />
6,106<br />
18<br />
55<br />
3,810<br />
1,942<br />
31<br />
116 .<br />
—<br />
134<br />
6,106<br />
%<br />
2.6<br />
0.5<br />
89.1<br />
2.9<br />
4.2<br />
0.1<br />
0.1<br />
0.5<br />
100.0<br />
20.6<br />
1.5<br />
15.3<br />
0.2<br />
62.0<br />
0.4<br />
100.0<br />
0.3<br />
0.9<br />
62.4<br />
31.8<br />
0.5<br />
1,9<br />
—<br />
2.2<br />
100.0<br />
Sector 1<br />
Rural<br />
Viviendas<br />
111<br />
74<br />
17,712<br />
6,273<br />
12,104<br />
369<br />
—<br />
258<br />
36,901<br />
443<br />
74<br />
295<br />
—<br />
35,868<br />
221<br />
36,901<br />
—<br />
295<br />
15,498<br />
6,642<br />
959<br />
10,923<br />
—<br />
2,584<br />
36,901<br />
%<br />
0.3<br />
0.2<br />
48.0<br />
17.0<br />
32.8<br />
1.0<br />
—<br />
0,7<br />
100.0<br />
1.2<br />
0.2<br />
0.8<br />
—<br />
97.2<br />
0.6<br />
100.0<br />
—<br />
0.8<br />
42.0<br />
18.0<br />
2.6<br />
29.6<br />
—<br />
7.0<br />
100.0<br />
Urbano<br />
Viviendas<br />
42<br />
10<br />
3,<strong>03</strong>9<br />
17<br />
13<br />
3<br />
—<br />
23<br />
3,247<br />
192<br />
23<br />
1,026<br />
3<br />
1,987<br />
16<br />
3,247<br />
19<br />
10<br />
1,082<br />
1,812<br />
136<br />
156<br />
—<br />
32<br />
3,247<br />
Sec tor 2<br />
%<br />
1.3<br />
0.3<br />
93,6<br />
3.6<br />
0.4<br />
0.1<br />
—<br />
0.7<br />
100.0<br />
5.9<br />
0.7<br />
31.6<br />
0.1<br />
61.2<br />
0.5<br />
100.0<br />
0.6<br />
0.3<br />
33.3<br />
55.8<br />
4.2<br />
4.8<br />
—<br />
1.0<br />
100.0<br />
Rural<br />
Viviendas<br />
70<br />
53<br />
12,819<br />
3,688<br />
940<br />
18<br />
—<br />
142<br />
17,730<br />
71<br />
35<br />
709<br />
17<br />
16,808<br />
90<br />
17,730<br />
18<br />
5,975<br />
3,723<br />
1,082<br />
6,489<br />
—<br />
443<br />
17,730<br />
Fuente : Cuadro N° 12. Censo Nacional <strong>de</strong> Vivienda 1972 <strong>de</strong>l Dpto. <strong>de</strong> Cajamarca, Tomo II. Oficina Nacional <strong>de</strong> Estadística y Censos.<br />
%<br />
0.4<br />
0.3<br />
72.3<br />
20.8<br />
5.3<br />
0.1<br />
—<br />
0.8<br />
100.0<br />
0.4<br />
0.2<br />
4.0<br />
0.1<br />
94.8<br />
0.5<br />
100.0<br />
—<br />
0.1<br />
33.7<br />
21.0<br />
6J<br />
36.6<br />
—<br />
2.5<br />
100.0<br />
N<br />
O<br />
z<br />
><br />
•z<br />
o<br />
¡o<br />
H<br />
m<br />
O<br />
n<br />
><br />
n<br />
>
z<br />
m<br />
X<br />
O<br />
Régimen <strong>de</strong> Tenencia<br />
CUADRO N 0 8<br />
VIVIENDAS SEGÚN REGIMEN DE TENENCIA ><br />
Total<br />
Viviendas<br />
%<br />
Urbana<br />
Viviendas<br />
%<br />
Viviendas<br />
Rural<br />
%<br />
7a<br />
><br />
Total Sector 1<br />
42,867<br />
100.0<br />
6,041<br />
100.0<br />
36, 826<br />
100.0<br />
- Propia<br />
- Alquiler venta<br />
- Alqui<strong>la</strong>da<br />
- Usufructuada<br />
- Otra forma<br />
- No especificado<br />
37,978<br />
165<br />
1,567<br />
2,313<br />
250<br />
594<br />
88.6<br />
0.4<br />
3.7<br />
5.4<br />
0.6<br />
1.3<br />
4,356<br />
91<br />
1,015<br />
471<br />
66<br />
42<br />
72.1<br />
1.5<br />
16.8<br />
7.8<br />
1.1<br />
0.7<br />
33,622<br />
74<br />
552<br />
1,842<br />
184<br />
552<br />
91.3<br />
0.2<br />
1.5<br />
5.0<br />
0.5<br />
1.5<br />
Total Sector 2<br />
20,913<br />
100.0<br />
3,219<br />
100.0<br />
17,694<br />
100.0<br />
- Propia<br />
- Alquiler venta<br />
- Alqui<strong>la</strong>da<br />
- Usufructuada<br />
- Otra forma<br />
- No especificado<br />
13,810<br />
113<br />
749<br />
5,751<br />
184<br />
306<br />
66.0<br />
0.5<br />
3.6<br />
27.5<br />
0.9<br />
1.5<br />
2,079<br />
42<br />
502<br />
531<br />
42<br />
23<br />
64.6<br />
1.3<br />
15.6<br />
16.5<br />
1.3<br />
0.7<br />
11,731<br />
71<br />
247<br />
5,220<br />
142<br />
283<br />
66.3<br />
0.4<br />
1.4<br />
29.5<br />
0.8<br />
1.6<br />
Fuente; Cuadro N" 10. Censo Nacional <strong>de</strong> Vivienda 1972 <strong>de</strong>l Dpto. <strong>de</strong> Cajamarca.<br />
Nacional <strong>de</strong> Estadística y Censos (ONEC) .<br />
Tomo II. Oficina<br />
"a<br />
era
CUADRO N 0 9<br />
DOTACIÓN DE SERVICIOS EN VIVIENDAS<br />
Dotación<br />
Alumbrado<br />
Abastecimiento <strong>de</strong> Agua<br />
Servicio <strong>de</strong> Baño<br />
Servicio Higiénico<br />
Sector<br />
Eléctrico<br />
(%)<br />
(Otra C<strong>la</strong>se Gas,<br />
Kerosene, Ve<strong>la</strong>,<br />
otros) (%)<br />
T , „ | Pozo<br />
Tubería _ . .<br />
, . Privado<br />
(<br />
' (%)<br />
Acarreo<br />
(%)<br />
Ducha<br />
o Tina<br />
(%)<br />
. . . Inodoro o<br />
No tiene<br />
(%)<br />
W ¿ ) '<br />
Otros<br />
(Excusado, Bota<strong>de</strong>ro,<br />
otros)<br />
Total Sector 1<br />
4.0<br />
96.0<br />
5.1 j 3.1<br />
91.8<br />
2.0<br />
98.0 2.0<br />
98.0<br />
Area Urbana<br />
31.0<br />
69.0<br />
38.6 j 0.5<br />
60,9<br />
15.0<br />
85,0 16.0<br />
84,0<br />
Area Rural<br />
0.1<br />
99.9<br />
0.1<br />
3.5<br />
96.4<br />
0.1<br />
99.9 0.1<br />
99.9<br />
Total Sector 2<br />
12.0<br />
88.0<br />
11.0<br />
1.6 .<br />
87.4<br />
5.0<br />
95,0 4,0<br />
96.0<br />
Area Urbana<br />
38.0<br />
62.0<br />
32.0<br />
0.6<br />
67.4<br />
15.0<br />
35,0 10.0<br />
90.0 1<br />
Area Rural<br />
0.2<br />
99.8<br />
0.2<br />
2.0<br />
97.8<br />
0,2<br />
99,8 0.1<br />
99.9 1<br />
Total<br />
6.0<br />
94.0<br />
6.5<br />
2.7<br />
91,8<br />
3,0<br />
97.0 3.0<br />
97.0 1<br />
Fuente • Caadros N° 13 ! 15 y 15. Censo Nacional <strong>de</strong> Vivienda, 1972 <strong>de</strong>lDpto, <strong>de</strong> Cajamarca, Tomo II, Oficina Nacional <strong>de</strong> Estadística y Censos<br />
(ONEC),<br />
^<br />
<br />
O
ANEXO II - CLIMATOLOGÍA Pág. 9<br />
ANEXO<br />
II<br />
CLIMATOLOGÍA<br />
Gráfico <strong>de</strong>l régimen <strong>de</strong> distribución mensual <strong>de</strong> <strong>la</strong>s<br />
precipitaciones pluviales.<br />
Gráfico <strong>de</strong>l régimen mensual <strong>de</strong> <strong>la</strong>s temperaturas me<br />
dias.<br />
Gráfico <strong>de</strong>l régimen mensual <strong>de</strong> <strong>la</strong> evaporación.<br />
Gráfico <strong>de</strong>l régimen mensual <strong>de</strong> <strong>la</strong> humedad<br />
re<strong>la</strong>ti<br />
va.<br />
Gráfico c'o<br />
Rosas <strong>de</strong> Viontos.<br />
0
Pág. 10<br />
ZONA NORTE DE CAJAMARCA<br />
REGIMEN DE DISTRIBUCIÓN MENSUAL DE LAS PRECIPITACIONES PLUVIALES<br />
CHILETE( 1964-1974)<br />
Gráfico N" 1<br />
MAGDALENA (1964-1973)<br />
E<br />
E<br />
c<br />
c<br />
'o<br />
200<br />
Altitud : 900 m.i.n.m.<br />
Total from. Anual : 200.7 m m.<br />
Altitud : 1,300 m.s.n.m.<br />
Total Prora. Anual : 375.2 m m.<br />
a.<br />
Meses<br />
Meses<br />
SAN JUAN (1964-1974) CONTUMAZA (1965-1974)<br />
Altitud : 2, 250 m.s.n.m.<br />
Total Prom. Anual • 676.6 mm.<br />
Altitud! 2^520 m.i.n.m.<br />
Total Prora. Anual: 531.4 n<br />
i ; 1 1 r<br />
A S O N D E<br />
Meses<br />
Meses<br />
500<br />
YUMAGUAL (1969-1973)<br />
Altitud : 2,600 m.s.n.m.<br />
Total Prora. Anual: 1,193,1 „„,.<br />
HUACRARUCO (1955-1967)<br />
Altitud : 2,750 m.s.n.m.<br />
Total Prora. Anual : 1,0»7.1 n. m.<br />
E<br />
E<br />
c<br />
O)<br />
c<br />
*2<br />
"o<br />
o<br />
2<br />
a.<br />
300<br />
/ \<br />
V\\ /<br />
/ /\\\ /x/ 7 /<br />
/<br />
r<br />
\\\ //C^'/<br />
i i i i i i i i r" i<br />
Meses<br />
Meses
ANEXO n-CUMATOLOGIA Píg. 11<br />
REGIMEN DE DISTRIBUCIÓN MENSUAL DE LAS PRECIPITACIONES PLUVIALES<br />
Gráfico N 0 1<br />
COCHABAMBA (1964-1974)<br />
LAJAS (1964-1974)<br />
i<br />
c<br />
o<br />
¡3<br />
2<br />
.'5.<br />
"o<br />
e<br />
a.<br />
J<br />
^y<br />
i<br />
A<br />
/ \<br />
i<br />
AltiMd : 1,700 m.s.n.m.<br />
Total Prom. Anual : 815.3 m m.<br />
V /\<br />
\ /<br />
\ \__y y^y \ .<br />
NT.<br />
E F M A M J J A S O N O E<br />
í^eses<br />
A<br />
Allitud : 2,100 m.>.r>.m.<br />
Totot Prom. Anual : 983.3 m m.<br />
.A _^<br />
[/<br />
""•""<br />
J<br />
/xV /-<br />
""^v<br />
E F M A M J j A S O N D E<br />
MSMS<br />
\<br />
^<br />
CHOTMl 964-1974)<br />
2AM»ANGAY(I«8-m4><br />
400 -"<br />
Altitud : 2,20&m.s.n.m.<br />
Total Prom. Anual : 958.1 t<br />
Altitud : 3,200 m.í.n.m.<br />
Total Piam. Anual s 1,0<strong>03</strong>.2 m m.<br />
7<br />
/ \<br />
/\\ A A<br />
F M A M J A S O<br />
Meses<br />
\—^<br />
1 1 ^.— T- T^-^-—. .—,____,—<br />
Meses<br />
LEYENDA<br />
Total mensual máximo extremo<br />
Total promedio mensual<br />
Total merMual mrnimo oxfremo
Pig. 12<br />
ZONA NORTE DE CAJAMARCA<br />
REGIMEN DE DISTRIBUCIÓN MENSUAL DE LAS PRECIPITACIONES PLUVIALES<br />
Gráfico N 0 1<br />
CONCHAN (1964-1974)<br />
BAMBAMARCA (1967-1973)<br />
Altitud : 2,200 m.s.n.m.<br />
Total Prom. Anral : 96S.1 m m.<br />
Altitud : 2,520 m.s.n.m.<br />
Total Prom. Anual 755.9 m m.<br />
E<br />
c<br />
« 300<br />
c<br />
'.2<br />
'o<br />
o<br />
•- 200<br />
'Ü<br />
LLAUCAN (1964-1974) CUTERVO( 1964-1973)<br />
Altitud<br />
2f$30 m.s.n.m.<br />
Total Prom. Anual : 681.7 m m.<br />
Altitud • 2,650 m.s.n.m.<br />
Total Prom. Anual • 92B.6 mm.<br />
LLAUCANO-TORORCO (1967-1974)<br />
LA LLICA (1962-1974)<br />
Alt.hjd:2¿20m.i.n.n..<br />
Total Prom. Anual : 747.8 m m.<br />
Altitud .2,640 m.s.n.m.<br />
Total Prom. Anual<br />
890.8 mm.<br />
E<br />
E<br />
c<br />
ANJXO II - CLIMATOLOGÍA Pág. 13<br />
REGIMEN DE DISTRIBUCIÓN MENSUAL DE LAS PRECIPITACIONES PLUVIALES<br />
Gráfico N» 1<br />
SAN JUAN DE LACAMACA (1962-1974)<br />
QUEBRADA SHUGAR ( 1962-1974)<br />
Altitud : 2,650 m.a.n.m.<br />
Total Prom. Anool : 878.7 m m.<br />
Ahitad : 3,200 m.i n.m.<br />
Total Prom. Anual : 1,1X8.5 mm.<br />
E<br />
E<br />
c<br />
Pág. 14<br />
ZONA NORTE DE CAJAMARCA<br />
REGIMEN DE DISTRIBUCIÓN MENSUAL DE LAS PRECIPITACIONES PLUVIALES<br />
GróficoN 0 1<br />
400<br />
TONGOD (1950-1970)<br />
Altitud . 2,630 m.s.n.m.<br />
Total Prom. Anual : 1,999.1 m n<br />
CHUGUR (1964-1973)<br />
« AltiMd 2,750 tn.í.n.m.<br />
A Total Prom. Anual • 1,295.0 m m.<br />
\<br />
/ ^<br />
/ \ /A<br />
,' ^<br />
\<br />
-—<br />
\ \ / /\ "1<br />
E<br />
F<br />
M<br />
A M J J A S O N D E<br />
Meses<br />
RUPAHUASI (19Ó6-1971 )<br />
QUILCATE ( 1966-1969)<br />
Altitud 2,850 m.s.n m.<br />
Total Prom. Anual ; 1,296.2 m m.<br />
Altitud : 3,050 m.s.n.m.<br />
Taíal Prom. Anuo! • 1,009.5 n<br />
F M A M J J<br />
Meses<br />
Meses<br />
LEYENDA<br />
Total mensual rráximo extremo<br />
Total promedio mensual<br />
Totaf mensual mínimo extremo
ANEXO II - CLIMATOLOGÍA Píg. 15<br />
REGIMEN DE DISTRIBUCIÓN MENSUAL DE LAS PRECIPITACIONES PLUVIALES<br />
Gráfico N" 1<br />
LLAPA (1965-1974)<br />
Altitud 2,920 m.s.n.m.<br />
Total Prom. Anual: 986.3 n<br />
GRANJA PORCON ( 1967-1974)<br />
Altitud • 3,100 m.l.n.m.<br />
Total Prom. Anual. T,306.4 m n».<br />
Meses<br />
J J A S O N<br />
Meses<br />
D E<br />
500<br />
QUEBRADA HONDA (1971 -1974)<br />
Altitvd Í 3,750 m.s,n.m.<br />
Total Prom. Anual: 856.6 m n<br />
c<br />
o<br />
c<br />
»o<br />
'o<br />
S<br />
p<br />
ioo<br />
a.<br />
Total mensual máximo extremo<br />
LEYENDA<br />
Total promedio mensual<br />
Total mensual mínimo extremo<br />
Meses
Pág. 16<br />
ZONA NORTE DE CAJAMARCA<br />
REGIMEN MENSUAL DE LAS TEMPERATURAS MEDIAS<br />
COCHABAMBA(T964-1974) LAJAS (1968-1974)<br />
Gráfico N 0 2<br />
Temperatura "C<br />
5 8 8 í<br />
' "<br />
)8_ 9<br />
~^— \ ^<br />
^—-^<br />
16.5<br />
—-^ —<br />
i i i i i i i i i i i<br />
E F M A M J J A S O N D E<br />
Meses<br />
CHOTA (T970-1974)<br />
1 1 1 1 1 1 1 1 1 1 1<br />
E F M A M J J A S O N D E<br />
Meses<br />
CONCHAN (1964-1974)<br />
Temperatura 0 C<br />
5 8 8 í<br />
-" """""^<br />
15.6<br />
^->^ ^—— ~^<br />
— ———<br />
•>5.2 " "<br />
l i l i l í<br />
E F M A M J J A S O N D E<br />
Meses<br />
BAMBAMARCA (1962-1974)<br />
1 1 1 1 1 1 1 1 1 1 1<br />
E F M A M J J A S O N D E<br />
Meses<br />
CUTERVO (1964-1974)<br />
30-<br />
O<br />
I "i<br />
2<br />
1 J<br />
i—<br />
14.7 "-— '<br />
— — • - —<br />
13.7<br />
E F M A M J J A S O N D.E<br />
Meses<br />
LLAUCANO T O RORCO (1967-1974)<br />
: F M A M J J A S O N D E<br />
Meses<br />
u<br />
O<br />
2<br />
30 -<br />
LEYENDA<br />
i 20-<br />
1<br />
,£ io-<br />
13.9<br />
~~ — ' " •<br />
Promedio mensual<br />
E F M A M J J A S O N D E<br />
Meses
ANEXO II-CLIMATOLOGIA Pág. 17<br />
REGIMEN MENSUAL DE LAS TEMPERATURAS MEDIAS<br />
RUPAHUASI (1966-1972)<br />
Gráfico N» 2<br />
U 30<br />
o<br />
E<br />
g 20<br />
o-\ i—i 1 1 1 1 1 1 1 1 1—<br />
E F M A M J J A S O N D E<br />
Meses<br />
SAhWUAN( 1964-1974) CONTUMAZA (1965-1974)<br />
^-—*^_ ^— ' '<br />
14.4<br />
--.- —""<br />
Meses<br />
Meses<br />
GRANJA PORCON ( 1967-1974)<br />
o<br />
I<br />
g 20<br />
LEYENDA<br />
Promedio mensual máximo extremo<br />
10.4<br />
Promedio mensual<br />
Promedio mensual mínimo extremo<br />
Promedio anual<br />
-1 1 1 1 1 1 1 1 T 1 1 "i<br />
E F M A M J J A S O N D E<br />
Meses
Pág."Í8<br />
ZONA NORTE DE CAJAMARCA<br />
REGIMEN MENSUAL DE LA EVAPORACIÓN<br />
COCHABAMBA (1964-1974) * LAJAS (1968-1974)<br />
Gráfico N 0 3<br />
L______^——-_/—<br />
^^'~- ---,<br />
o -<br />
E F M A M J J A S O N D E<br />
Meses<br />
E F M A M J J A S O N D E<br />
Meses<br />
•400 -i<br />
CHOTA (1970-1974)<br />
CONCHAN (1968-1973)<br />
0-<br />
«.#=3^<br />
E F M A M J J A S O N D E<br />
Meses<br />
CUTERVO (1968-1972)<br />
E F M A M J J A S O N D E<br />
Meses<br />
LLAUCANO-TORORCO (1967-1974)<br />
3O0-<br />
200-<br />
100-<br />
300-<br />
100 -<br />
0- 1 1 1 T 1 i 1 1—" 1—~—1 1<br />
E F M A M J J A S O N D E<br />
A/teses<br />
LEYENDA<br />
Total mensual máximo extremo<br />
Total promedio mensual<br />
Total mensual mfnimo extremo
ANEXO II - CLIMATOLOGÍA Pág. 19<br />
REGIMEN MENSUAL DE LA EVAPORACIÓN<br />
Gráfico N" 3<br />
SAN JUAN (1964-1974)<br />
CONTUMAZA (1965-1974)<br />
o<br />
i—<br />
/\<br />
• \<br />
0 -<br />
1 1 1 1 1 1 1 1 1 1 1<br />
M A M S O N<br />
Meses<br />
GRANJA PORCON ( 1967-1974)<br />
400-<br />
^J<br />
300-<br />
200-<br />
100-<br />
; F M A M J J A 4 Ó N D E<br />
LEYENDA<br />
Total mensual mínimo extremo<br />
Total promedio mensucl<br />
Total mensual móxim» extremo<br />
Meses
Pág. 20<br />
ZONA NORTE DE CAJAMARCA<br />
REGIMEN MENSUAL DE LA HUMEDAD RELATIVA.<br />
Gráfico N" 4<br />
COCHABAMBA (1964-1974) LAJAS (1968-1974)<br />
,^ 80<br />
78%<br />
78%,<br />
-~i i i 1 i 1 1—~i 1 1 n<br />
E F M A M J J A S O I ^ D E<br />
Meses<br />
E F M A M J J A S O N D E<br />
Meses<br />
CHOTA 1970-1974)<br />
""'<br />
•~-^,^'<br />
CONCHAN (1970-1974)<br />
——<br />
,-'" ---.<br />
__<br />
90%<br />
"~ \ ^-'<br />
—<br />
/<br />
"8<br />
"O<br />
OÍ 1 1 1 1 1 1 1 1 1 1 r-<br />
É F M A M J J A S O N D E E F M A M J J A S O N D E<br />
Meses<br />
Meses<br />
BAMBAMARCA ( 1967-1974)<br />
LEYENDA<br />
Promedio mensual máximo extremo<br />
Promedio mensual<br />
Promedio mensual mínimo extremo<br />
Promedio anual<br />
-i ' r<br />
E F M A M J J A S O N D E<br />
Meses
ANEXO II- CLIMATOLOGÍA Pág. 21<br />
REGIMEN MENSUAL DE LA HUMEDAD RELATIVA<br />
Gráfico N 0 4<br />
i<br />
o<br />
><br />
0£<br />
£<br />
tOOn<br />
80-<br />
60-<br />
40 -<br />
20 -<br />
^.^<br />
CUTERVO( 1964-1973)<br />
———~~—-^__<br />
82 % ^ ^<br />
"V-^ _ ^ ^<br />
"—^<br />
\ s '<br />
0 - l 1 1 1 1 l 1 1 1 1 I<br />
E F M A M J J A S O N D E<br />
Meses<br />
SAN JUAN (1964-1974)<br />
A<br />
/ \<br />
LEYENDA<br />
Promedio mensual máximo extremo<br />
Promedio mensual<br />
f<br />
Promedio mensual minimo extremo<br />
Promedio anual<br />
0<br />
-i 1 1 1 1 i 1 1 ¡ 1 i r<br />
E F M A M J J A S O N D E<br />
Meses
Pág. 22<br />
ZONA NORTE DE CAJAMARCA<br />
ROSA DE VIENTOS SUPERFICIALES<br />
PORCENTAJES GRAFICADOS DE LOS RUMBOS OBSERVADOS<br />
N<br />
Gráfico N 0 5<br />
VERANO<br />
ESTACIÓN<br />
SÍMBOLO<br />
PERIODO DE<br />
REGISTRO<br />
Cochabamba<br />
Chota<br />
Conchan<br />
San Juan<br />
Contumazá<br />
Granja Porcón<br />
1967-1974<br />
1970 -1974<br />
1967 - 1973<br />
1967 -1974<br />
1967 -1974<br />
1967 - 1974
ANEXO II - CLIMATOLOGÍA Pág. 23<br />
ROSA DE VIENTOS SUPERFICIALES<br />
PORCENTAJES GRAFICADOS DE LOS RUMBOS OBSERVADOS<br />
N<br />
Gráfico N • 5<br />
s<br />
OTOÑO<br />
ESTACIÓN<br />
Cochabanixi<br />
Chata<br />
Conchan<br />
Son Juan<br />
Conturaazó<br />
Granja Parean<br />
SÍMBOLO<br />
PERIODO DE<br />
REGISFRO<br />
1967-1974<br />
1970 - 1974<br />
1947-1973<br />
1967-1974<br />
1967 - 1974<br />
1947-1974*
Pág. 24<br />
ZONA NORTE DE CAJAMARCA<br />
ROSA DE VIENTOS SUPERFICIALES<br />
PORCENTAJES GRAFICADOS DE LOS RUMBOS OBSERVADOS<br />
N<br />
Gráfico N" 5<br />
INVIERNO<br />
ESTACIÓN<br />
Cochabamba<br />
Chota<br />
San Juan<br />
Contumaza<br />
Granja Porcón<br />
*<br />
_ _<br />
-<br />
SÍMBOLO<br />
PERIODO DE<br />
REGISTRO<br />
1967-1974<br />
1970 - 1974<br />
1967-1973<br />
1967 - 1974<br />
1967 - 1974<br />
1967-1974
ANEXO II - CLIMATOLOGÍA Pág. 25<br />
ROSA-DE VIENTOS SUPERFICIALES<br />
PORCENTAJES GRAFICADOS DE LOS RUMBOS OBSERVADOS<br />
N<br />
100<br />
Gráfico N 0 5<br />
s<br />
PRIMAVERA<br />
ESTACIÓN<br />
Cochabamba<br />
Chota<br />
Conchan<br />
San Juan<br />
Contumazá<br />
Granja Porcón<br />
SÍMBOLO<br />
- —<br />
PERIODO DE<br />
REGISTRO<br />
1967 -1974<br />
1970 - 1974<br />
1967 - 1973<br />
1967 - 1974<br />
1967-1974<br />
1967 - 1974
Pág. 26 ZONA NORTE DE CAJAMARCA<br />
ANEXO<br />
III<br />
ECOLOGÍA<br />
Superficie aproximada <strong>de</strong> <strong>la</strong>s Zonas <strong>de</strong> Vida.<br />
Cálculo <strong>de</strong> los Ba<strong>la</strong>nces Hfdricos para <strong>la</strong>s estaciones <strong>de</strong> Cochabamba.<br />
Tunad, Lajas, Bambamarca, Contumazá, San<br />
Juan, Conchan, L<strong>la</strong>ucano, Cutervo, Chota, Hualgayoc<br />
y<br />
Rupahuasi.<br />
Gráficos <strong>de</strong> los Ba<strong>la</strong>nces HTdricos para <strong>la</strong>s estaciones <strong>de</strong> Co<br />
chabamba. Tunad, Lajas, Bambamarca, Contumazá,<br />
San<br />
Juan, Conchan, L<strong>la</strong>ucano, Cutervo, Chota, Hualgayoc<br />
y<br />
Rupahuasi o<br />
-__ o
?,<br />
ANEXO III - ECOLOGÍA<br />
Pa 8'<br />
CUADRO N 0 1<br />
SUPERFICiE APROXIMADA DE LA ZONAS DE VIDA<br />
Zonas <strong>de</strong> Vida<br />
Area Total<br />
(Ha,)<br />
Por Zonas <strong>de</strong><br />
Vida<br />
%<br />
Por Pisos<br />
Altítudínales<br />
Matorral <strong>de</strong>sértico - Premontano Tropical<br />
Monte espinoso - Premontano Tropical<br />
Bosque seco - Premontano Tropical<br />
5,700<br />
19,500<br />
41,800<br />
1,0<br />
3,5<br />
7,6<br />
12.1<br />
Estepa espinosa - Montano Bajo Tropical<br />
Bosque seco - Montano Bajo Tropical<br />
Bosque húmedo - Montano Bajo Tiopical<br />
Bosque muy húmedo - Montano Bajo Tropical<br />
6,400<br />
61,600<br />
107, 000<br />
12,000<br />
1.2<br />
11.2<br />
19.5<br />
2,2<br />
34 J<br />
Estepa - Montano Tropical<br />
Bosque húmedo - Montano Tropical<br />
Bosque muy húmedo - Montano Tropical<br />
6,350<br />
13,000<br />
184,000<br />
1,2<br />
2.4<br />
33,4<br />
37,0<br />
Páramo muy húmedo - Subalpino Tropical<br />
Páramo pluvial - Subalpino Tropical<br />
86,400<br />
6,250<br />
15,7<br />
1,1<br />
16o8<br />
Total<br />
550,000<br />
100,0<br />
100.0 1
CUADRO N" 2<br />
TABLA: CALCULO DEL BALANCE HIDRICO DE SUELOS ZONALES CON VEGETACIÓN NATURAL MADURO PARA "COCHABAMBA"<br />
Periodo <strong>de</strong> registro:<br />
Precipitación 64/74 Temperatura 64/74<br />
Zona <strong>de</strong> vida: bs-PT<br />
P.£T./R 1.36<br />
LAT: 06° 28* S<br />
LONG. :78 o 53" W<br />
ALT.: l,700m.s.n.m.<br />
s<br />
OQ<br />
00<br />
Promedio <strong>de</strong> <strong>la</strong>rgo término<br />
en C-o-mm.<br />
Ene.<br />
Feb.<br />
Mar.<br />
Abr,<br />
Meses <strong>de</strong>l Año<br />
May. Jun. Jul.<br />
Ago,<br />
Set.<br />
Oct,<br />
Nov.<br />
Die.<br />
Año<br />
1. Temperatura<br />
18.8<br />
19.0<br />
18.9<br />
18.'9<br />
19.1<br />
18.8<br />
18,6<br />
19.1 '<br />
19.1<br />
19.0<br />
18.9<br />
18.9<br />
18.9<br />
2. Biotemperatura<br />
18.8<br />
19.0<br />
18.9<br />
18.9<br />
19.1<br />
18.8<br />
18.6<br />
19.1<br />
19.1<br />
19.0<br />
18.9<br />
18.9<br />
18.9<br />
3. Evapotranspiración potencial<br />
94<br />
87<br />
95<br />
91<br />
96<br />
91<br />
93<br />
96<br />
92<br />
95<br />
91<br />
95<br />
1116<br />
4. Evapotranspiración límite en<br />
clima seco [^0.7302 )<br />
70<br />
64<br />
70<br />
66<br />
70<br />
66<br />
68<br />
70<br />
67<br />
69<br />
66<br />
69<br />
815<br />
5. Precipitación<br />
53<br />
66<br />
117<br />
116<br />
51<br />
26<br />
15<br />
42<br />
76<br />
119<br />
86<br />
48<br />
815<br />
6. Evapotranspiración real<br />
70<br />
64<br />
70<br />
66<br />
70<br />
66<br />
26<br />
27<br />
52<br />
69<br />
66<br />
69<br />
715<br />
7. Exceso <strong>de</strong> precipitación<br />
--<br />
2<br />
47<br />
50<br />
40<br />
--<br />
15<br />
24<br />
50<br />
20<br />
--<br />
8. Recarga <strong>de</strong> humedad <strong>de</strong>l suelo<br />
--<br />
--<br />
36<br />
--<br />
--<br />
--<br />
--<br />
15<br />
24<br />
31<br />
--<br />
--<br />
9. Agotamiento <strong>de</strong> humedad <strong>de</strong>l<br />
suelo<br />
!<br />
10. Humedad almacenada en el sue<br />
lo:fin <strong>de</strong> mes ( PF 33 mm.)<br />
11. Escorrentia tot;l<br />
12. Deficiencia <strong>de</strong> humedad en el<br />
suelo: fin <strong>de</strong> mes<br />
13. Deficiencia <strong>de</strong> precipitación<br />
j 14<br />
L<br />
C ondición <strong>de</strong> humedad<br />
17 15<br />
44 46<br />
-- --<br />
—<br />
17 — •=<br />
» • 19 40 11 -- -•<br />
82<br />
11<br />
--<br />
82<br />
50<br />
63<br />
--<br />
—<br />
23<br />
--<br />
10<br />
12<br />
--<br />
21<br />
27<br />
--<br />
6<br />
51<br />
--<br />
« •<br />
-- 19 0 53 28 —<br />
H Ú M E D O S E C O ¡ H Ú M E D O<br />
Derechos reservados: Centro Científico Tropical.<br />
-<br />
82<br />
19<br />
--<br />
e *<br />
V *<br />
82<br />
20<br />
--<br />
--<br />
21<br />
61<br />
21<br />
100<br />
178<br />
N<br />
O<br />
z<br />
><br />
z<br />
o<br />
JO<br />
H<br />
m<br />
O<br />
w<br />
n<br />
><br />
«—i<br />
><br />
><br />
n
ESTACIÓN COCHABAMBA<br />
RELACIÓN DE BIOTEMPERATURA, PRECIPITACIÓN Y EVAPOTRANSPIRACION POTENCIAL<br />
Evapofranspiración Real<br />
Evapotranspiración Potencial<br />
Temperatura<br />
Zona <strong>de</strong> Vida : bosque seco - Premontano Tropical<br />
Altitud : 1,700 m.s.n.m.<br />
Latitud :<br />
06-° 28' S<br />
Longitud : 78° 53' O<br />
PROMEDIO ANUAL DE t<br />
1.- Biotemperatura 18.9 °C<br />
2.- Precipitación total 815 mm.<br />
3.- Potencial <strong>de</strong> evapotranspiración 1,116 mm.<br />
4.- Re<strong>la</strong>ción <strong>de</strong> evapotranspiración potencial l .36<br />
5.- Evapotranspiración real estimada 715 mm.<br />
6.- Escorrentia 100 mm.<br />
7.- Deficiencia <strong>de</strong> precipitación 178 mm.<br />
T—r<br />
M A M J J A<br />
S O N D<br />
Subtropical<br />
W<br />
( XT'<br />
V Subhúmedoy<br />
A \<br />
2.00 1.00 0.50<br />
Premontano<br />
24°<br />
Re<strong>la</strong>ción ETP<br />
UBICACIÓN CLIMÁTICA : ®
CUADRO N° 3<br />
XABLA: CALCL LO DEL BALANCE HIDRICO DE SUELOS ZONALES CON VEGETACIÓN NATURAL MADURO P^RA: TUNAD<br />
Período <strong>de</strong> registro<br />
Zona <strong>de</strong> vida bs-PT (1 <strong>la</strong>nbícional<br />
Promedio <strong>de</strong> <strong>la</strong>rgo término<br />
en "C o mm.<br />
Ene,,<br />
Precípítaciór ^Q'"? Temperaruia 70/72<br />
Feb„<br />
Mar.<br />
Abr.<br />
P.ET-/R 1„98<br />
Meses <strong>de</strong>l Ano<br />
May.<br />
Jun.<br />
Jul.<br />
Ago.<br />
Set,.<br />
Oct,<br />
LAT, 07'- 3 0' S<br />
LONG. "8° 43' \\<br />
ALT. 2,000 m.^n.m.<br />
Nov.<br />
Die.<br />
Año<br />
1. Temperatura<br />
17.1<br />
17.6<br />
17.6<br />
17.9<br />
18.1<br />
18.0<br />
18.2<br />
18.2<br />
18,5<br />
18,2<br />
18.3<br />
18.0<br />
18.0<br />
2, Bloíemperatura<br />
17.7<br />
17.6<br />
17.6<br />
17.9<br />
18.1<br />
18.0<br />
18,2<br />
18.5<br />
18.5<br />
18.2<br />
18.3<br />
18.0<br />
18.0<br />
3. Evapotranspiración potencial<br />
89<br />
80<br />
88<br />
87<br />
91<br />
87<br />
91<br />
91<br />
90<br />
91<br />
89<br />
90<br />
1064<br />
4. Evapotranspiración límite en<br />
clima seco 0.5056<br />
<strong>45</strong><br />
40<br />
44<br />
44<br />
46<br />
44<br />
46<br />
46<br />
46<br />
46<br />
<strong>45</strong><br />
46<br />
538<br />
5= Precipitación<br />
90<br />
99<br />
112<br />
65<br />
1<br />
5<br />
0<br />
12<br />
16<br />
35<br />
23<br />
81<br />
538<br />
6c<br />
Evapotranspiración real<br />
<strong>45</strong><br />
40<br />
44<br />
44<br />
38<br />
13<br />
4<br />
9<br />
12<br />
23<br />
23<br />
35<br />
330<br />
7. Exceso <strong>de</strong> precipitación<br />
<strong>45</strong><br />
59<br />
68<br />
21<br />
.,<br />
..<br />
..<br />
3<br />
4<br />
12<br />
..<br />
46<br />
8. Recarga <strong>de</strong> humedad <strong>de</strong>l suelo<br />
--<br />
--<br />
,.<br />
--<br />
--<br />
..<br />
.-<br />
3<br />
4<br />
12<br />
--<br />
46<br />
9. Agotamiento <strong>de</strong> humedad <strong>de</strong>l<br />
PF 16<br />
suelo<br />
mm °<br />
10. Humedad almacenada en el<br />
suelo: fin <strong>de</strong> mes<br />
11. Escorrentfa total<br />
12» Deficiencia <strong>de</strong> humedad en el<br />
suelo: fin <strong>de</strong> mes<br />
13. Deficiencia <strong>de</strong> precipitación<br />
14, C ondición <strong>de</strong> humedad<br />
-.<br />
54<br />
<strong>45</strong><br />
--<br />
..<br />
..<br />
54<br />
59<br />
-.<br />
.,<br />
.,<br />
54<br />
68<br />
..<br />
-.<br />
--<br />
54<br />
21<br />
--<br />
--<br />
I.UMEDO MUV "UMFDO 'XMt-DO SECO<br />
j<br />
37<br />
17<br />
..<br />
--<br />
<strong>45</strong><br />
8<br />
9<br />
--<br />
18<br />
39<br />
4<br />
5<br />
—<br />
12<br />
46<br />
1<br />
8<br />
13<br />
34<br />
Derechos reservados: Centro Cientrfico Tropical<br />
--<br />
12<br />
..<br />
9<br />
30<br />
-.<br />
24<br />
--<br />
--<br />
11<br />
O<br />
z<br />
><br />
z<br />
o<br />
pa<br />
H<br />
m<br />
D<br />
m<br />
n<br />
><br />
N<br />
--<br />
24<br />
--<br />
..<br />
22<br />
30<br />
54<br />
16<br />
--<br />
209<br />
227<br />
><br />
>
ESTACIÓN TUNAD<br />
RELACIÓN DE BIOTEMPERATURA, PRECIPITACIÓN Y EVAPOTRANSPIRACIÓN POTENCIAL<br />
Evapotranspiración Real<br />
Evapotranspiración Potencial<br />
Temperatura<br />
Zona <strong>de</strong> Vida : bosque seco - Premontano Tropical<br />
Altitud: 2,000 m.s.n.m.<br />
Latitud : 07° 10' S<br />
Longitud : 78° 43' O<br />
PROMEDIO ANUAL DE :<br />
1.- Biotemperatura 18 0 C<br />
2.- Precipitación total 538 mm.<br />
3.- Potencial <strong>de</strong> evapotranspiración 1,064 mm.<br />
4.- Re<strong>la</strong>ción <strong>de</strong> evapotranspiración potencial 1.98<br />
5.- Evapotranspiración real estimada 330 mm.<br />
6.- Escorrentia 209 mm.<br />
7.- Deficiencia <strong>de</strong> precipitación 227 mm.<br />
Subtropical<br />
Re<strong>la</strong>ción ETP<br />
UBICACIÓN CLIMÁTICA :
CUADRO M° 4<br />
TABLA: CALCULO DEL BALANCE HIDRICO DE SUELOS ZONALES CON VEGETACIÓN NATURAL PARA "LAJAS 1<br />
Período <strong>de</strong> registro Precipitación 64/71 Temperatura 67/71 LONG. 78° 44' W<br />
Zona <strong>de</strong> vida bs-PT P.ET./R1.02 ALT, 2,050 m a s.n,m.<br />
Promedio <strong>de</strong> <strong>la</strong>rgo término<br />
en "C o mm»<br />
Ene<br />
Feb,<br />
Mar.<br />
Abr.<br />
Meses <strong>de</strong>l A ño<br />
May.<br />
Jun.<br />
Jul.<br />
Ago.<br />
Set.<br />
Oct.<br />
Nov.<br />
Die.<br />
Año<br />
1. Temperatura<br />
16.5<br />
16.9<br />
16.4<br />
16.8<br />
16.7<br />
16,1<br />
16.6<br />
16.3<br />
16.5<br />
16.5<br />
16.9<br />
16.5<br />
16.5<br />
2. Bioremperaiura<br />
16.5<br />
16.9<br />
16.4<br />
16.8<br />
16.7<br />
16.1<br />
16.6<br />
16.3<br />
16.5<br />
16.5<br />
16.9<br />
16.5<br />
16.5<br />
3 0 Evapotranspiracíón potencial<br />
83<br />
77<br />
82<br />
81<br />
84<br />
78<br />
83<br />
82<br />
80<br />
83<br />
82<br />
83<br />
978<br />
4. Evapotranspíracíón limite en seco<br />
0.9775<br />
81<br />
75<br />
80<br />
79<br />
82<br />
76<br />
81<br />
80<br />
78<br />
81<br />
80<br />
81<br />
954<br />
5. Precipí ración<br />
75<br />
81<br />
162<br />
96<br />
58<br />
28<br />
21<br />
40<br />
76<br />
137<br />
108<br />
74<br />
956<br />
6. Eva potra nspi ración real<br />
81<br />
7s<br />
80<br />
79<br />
82<br />
64<br />
39<br />
49<br />
43<br />
81<br />
80<br />
81<br />
834<br />
7„ Exceso <strong>de</strong> precipitación<br />
..<br />
6<br />
32<br />
17<br />
--<br />
E 3<br />
--<br />
--<br />
33<br />
56<br />
28<br />
--<br />
8, Recarga <strong>de</strong> humedad <strong>de</strong>l suelo<br />
-.<br />
6<br />
7<br />
,,<br />
,-<br />
.=<br />
„<br />
.-<br />
33<br />
54<br />
-,<br />
.-<br />
9„ Agotamiento <strong>de</strong> humedad <strong>de</strong>l<br />
suelo<br />
6<br />
—<br />
7<br />
—<br />
24<br />
36<br />
18<br />
9<br />
„<br />
—<br />
-.<br />
7<br />
10. Humedad almacenada en el suelo<br />
fin <strong>de</strong> mes PF" 48 mrru<br />
83<br />
89<br />
96<br />
96<br />
72<br />
36<br />
18<br />
9<br />
42<br />
96<br />
96<br />
89<br />
11. Escorrentra total<br />
--<br />
.-<br />
75<br />
17<br />
--<br />
fe ^<br />
--<br />
—<br />
—<br />
2<br />
28<br />
—<br />
122<br />
12. Deficiencia <strong>de</strong> humedad en el sue"<br />
lo: fin <strong>de</strong> mes<br />
.=<br />
--<br />
--<br />
»•"<br />
..<br />
12<br />
30<br />
39<br />
6<br />
—<br />
'-<br />
—<br />
13, Deficiencia <strong>de</strong> precipitación<br />
6<br />
_.<br />
..<br />
24<br />
48<br />
60<br />
40<br />
2<br />
—<br />
—<br />
7<br />
187<br />
14. Condición <strong>de</strong> humedad<br />
HÚMEDO SECO HÚMEDO<br />
Derechos reservado";: Centro Cientfficp Tropical,
ESTACIÓN LAJAS<br />
RELACIÓN DE BIOTEMPERATURA, PRECIPITACIÓN Y EVAPOTRANSPIRACION POTENCIAL<br />
Odn.<br />
Evapotronspiración Real<br />
Evapotranspiración Potencial<br />
Temperatura<br />
Zona <strong>de</strong> Vida : bosque seco - Premontano Tropical<br />
Altitud: 2,050 m.s.n.m.<br />
Latitud : 06° 32' S<br />
Longitud : 78° 44' O<br />
PROMEDIO ANUAL DE :<br />
1.- Biotemperatura 16.5 "C<br />
2.- Precipitación total 956 mm.<br />
3.- Potencial <strong>de</strong> evapotranspiración 978 mm.<br />
4.- Re<strong>la</strong>ción <strong>de</strong> evapotranspiración potencial 1.02<br />
150 —.<br />
5.- Evapotranspiración real estimada 834 mm.<br />
6.- Eseorrentia 122 mm.<br />
7.- Deficiencia <strong>de</strong> precipitación 187 mm.<br />
Temp<strong>la</strong>da<br />
Re<strong>la</strong>ción ETP<br />
UBICACIÓN CLIMÁTICA :
TABLA:<br />
CUADRO N° 5<br />
CALCULO DEL BALANCE HIDRICO DE SUELOS ZONALES CON VEGETACIÓN NATURAL MADURO PARA /BAMBAMAHCA'<br />
Periodo <strong>de</strong> registro<br />
precipitación 67 / 73 Temperatura 62 / 74<br />
Zona <strong>de</strong> vida bs-MBT<br />
P.ET./R 1.14<br />
LAT: 06° 41' S<br />
LONG. 78° 31* W<br />
ALT. 2,500m.s.n.m.<br />
CO<br />
1^<br />
Promedio <strong>de</strong> <strong>la</strong>rgo término<br />
en °C o mm.<br />
Ene.<br />
Feb.<br />
Mar,<br />
Abr.<br />
Meses<br />
May.<br />
<strong>de</strong> 1 Año<br />
i<br />
Jun, Jul., Ag9.<br />
Seu<br />
Oct,<br />
Nov.<br />
Die.<br />
Año<br />
1. Temperatura<br />
14.8<br />
14,9<br />
14,8<br />
14e9<br />
14^<br />
14.1<br />
13.7<br />
14o 3<br />
15 e 0<br />
15,2<br />
15 r 2<br />
14,, 8<br />
14.7<br />
2. Biotemperatura<br />
14.8<br />
14.9<br />
14.8<br />
14.9<br />
14.7<br />
14.1<br />
13.7<br />
14.3<br />
15.0<br />
15.2<br />
15.2<br />
14.8<br />
14.7<br />
3. Evapotranspiración potencial<br />
74<br />
68<br />
74<br />
72<br />
74<br />
68<br />
69<br />
72<br />
73<br />
76<br />
74<br />
74<br />
868<br />
4. Evapotranspiración límite en clima<br />
seco ( 0.8732 )<br />
64<br />
59<br />
65<br />
63<br />
65<br />
59<br />
60<br />
63<br />
64<br />
66<br />
65<br />
65<br />
758<br />
5. Precipitación<br />
61<br />
84<br />
101<br />
95<br />
40<br />
23<br />
26<br />
15<br />
64<br />
100<br />
85<br />
64<br />
758<br />
6, Evapotranspiración real<br />
64<br />
59<br />
65<br />
63<br />
65<br />
48<br />
39<br />
21<br />
36<br />
66<br />
65<br />
65<br />
656<br />
7. Exceso <strong>de</strong> precipitación<br />
--<br />
25<br />
36<br />
32<br />
--<br />
w •<br />
—<br />
• V<br />
28<br />
34<br />
20<br />
--<br />
8. Recarga <strong>de</strong> humedad <strong>de</strong>l suelo<br />
--<br />
4<br />
-'<br />
» •<br />
• m<br />
„.<br />
--<br />
--<br />
28<br />
34<br />
7<br />
..<br />
9. Agotamiento <strong>de</strong> humedad <strong>de</strong>l<br />
suelo<br />
10. Humedad almacenada en el suelo:<br />
fin <strong>de</strong> mes ( PF-34 mm.)<br />
11. Escorrentfa total<br />
12. Deficiencia <strong>de</strong> humedad en el<br />
suelo: fin <strong>de</strong> mes<br />
13. Deficiencia <strong>de</strong> precipitación<br />
14. Condición <strong>de</strong> humedad<br />
3<br />
72<br />
--<br />
--<br />
3<br />
-- -•<br />
76 76<br />
21 36<br />
-- --<br />
-- -•<br />
H Ul VI ED O<br />
--<br />
76<br />
32<br />
--<br />
--<br />
25<br />
51<br />
--<br />
--<br />
25<br />
25<br />
26<br />
--<br />
8<br />
36<br />
S<br />
13 6<br />
13 7<br />
-- --<br />
21 27<br />
34 48<br />
ECO<br />
--<br />
35<br />
--<br />
--<br />
--<br />
Derechos reservados: Centro Científico Tropical.<br />
--<br />
69 76<br />
-- 13<br />
.. --<br />
-- --<br />
HÚMEDO<br />
1<br />
75<br />
--<br />
--<br />
1<br />
102<br />
147<br />
N<br />
O<br />
Z<br />
><br />
z<br />
o<br />
ja<br />
H<br />
m<br />
a<br />
ra<br />
O<br />
><br />
><br />
><br />
O<br />
>
AT'^N<br />
Lai AC I ON SAMB AMARLA<br />
C 3'OTEMPERATURA, PRECIPITACIÓN Y tVAPOTRANSPiRACION POTENCIAL<br />
Gráfico N°4<br />
Zona <strong>de</strong> Viaa oosque seco - Montano Bajo Tropical<br />
Altitud 2,500 m.s.n.m.<br />
in p *n<br />
Latitud<br />
Longitud-<br />
06° 41' S<br />
78 s 31' O<br />
PROMEDIO ANUAL DE .<br />
U-<br />
2<br />
3.-<br />
Biotempeíaí'>a<br />
Precipirac 6^1 Tota?<br />
Potencial <strong>de</strong> evapotranspiración<br />
14 7 0 C<br />
758 mm<br />
868 mtn.<br />
4 -<br />
Reíactón <strong>de</strong> evap^transpuacion potencia! 1 * 14<br />
150 .—<br />
5 -<br />
6.-<br />
Evapotranspiración real estimada<br />
Escorrertia<br />
656 mm.<br />
102 mm.<br />
7.-<br />
Defictencia <strong>de</strong> precipitación<br />
147 mm.<br />
" ^<br />
n<br />
Temp <strong>la</strong>da<br />
— 12°<br />
Montano Bajo<br />
~-f. _L y W j u^ r<br />
E F M i< j j<br />
C, T-i D<br />
Rt'p i or. ETP<br />
¡r r rsON r l MATiCA
CUADRO N° 6<br />
TABÍA:<br />
CALCULO DE BALANCE HIDRICO DE SUELOS ZONALES CON VEGETACIÓN NATURAL MADURO PARA "CONTUMAZA'<br />
Periodo <strong>de</strong> registro : precipitación 65 / 74<br />
temperatura 65 / 74<br />
Zona <strong>de</strong> vida: bosque seco Montano Bajo Tropical<br />
P.ET./ 1,60<br />
LAT, 07°22'S<br />
LONG. 78° 49" W<br />
ALT. 2,300 m.s.n.m.<br />
OQ<br />
CO<br />
Promedio <strong>de</strong> <strong>la</strong>rgo término<br />
en ° C o mm.<br />
Fne.<br />
Feb.<br />
Mar.<br />
Meses <strong>de</strong>l Año<br />
Abr. May. Jun, Jul.<br />
Ago.<br />
Set.<br />
Oct.<br />
Nov.<br />
Die.<br />
Año<br />
1. Temperatura<br />
14,1<br />
13.9<br />
13.8<br />
14.4<br />
14.7<br />
14.7<br />
14.9<br />
15.0<br />
14.7<br />
14,5<br />
14.3<br />
14.4<br />
14.4<br />
2. Bíotem pera tura<br />
14.1<br />
13.9<br />
13,8<br />
14.4<br />
14.7<br />
14.7<br />
14.9<br />
15.0<br />
14.7<br />
14.5<br />
14.3<br />
14.4<br />
114.4<br />
3. Evapotranspíración potencial<br />
71<br />
63<br />
69<br />
70<br />
74<br />
71<br />
75<br />
75<br />
71<br />
73<br />
69<br />
72<br />
853<br />
4. Evapotranspíración limite en<br />
clima seco<br />
<strong>45</strong><br />
39<br />
43<br />
44<br />
46<br />
44<br />
47<br />
47<br />
44<br />
46<br />
43<br />
<strong>45</strong><br />
533<br />
5. Precipitación<br />
83<br />
99<br />
169<br />
56<br />
12<br />
4<br />
2<br />
1<br />
17<br />
37<br />
20<br />
33<br />
533<br />
6. Evapotranspíración real<br />
<strong>45</strong><br />
39<br />
43<br />
44<br />
46<br />
13<br />
7<br />
3<br />
10<br />
25<br />
21<br />
27<br />
323<br />
7, Exceso <strong>de</strong> precipitación<br />
38<br />
60<br />
126<br />
12<br />
--<br />
--<br />
--<br />
--<br />
7<br />
12<br />
--<br />
6<br />
8, Recarga <strong>de</strong> humedad <strong>de</strong>l suelo<br />
9. Agotamiento <strong>de</strong> humedad <strong>de</strong>l<br />
suelo<br />
10. Humedad almacenada en el suelo<br />
fin <strong>de</strong> mes PF-19mm.<br />
11- Escorrentfa total<br />
26<br />
--<br />
53<br />
12<br />
• -<br />
53<br />
60<br />
--<br />
- •<br />
53<br />
126<br />
--<br />
--<br />
53<br />
12<br />
--<br />
34<br />
19<br />
--<br />
--<br />
9<br />
10<br />
S B<br />
--<br />
5<br />
5<br />
--<br />
--<br />
2<br />
3<br />
--<br />
7<br />
--<br />
10<br />
--<br />
12<br />
--<br />
22<br />
--<br />
--<br />
1<br />
21<br />
..<br />
6<br />
--<br />
27<br />
tr w<br />
210<br />
N<br />
O<br />
Z<br />
><br />
z<br />
o<br />
73<br />
H<br />
tn<br />
a<br />
i 12, Deficiencia <strong>de</strong> humedad en el<br />
suelo; fin <strong>de</strong> mes<br />
13. Deficiencia <strong>de</strong> precipitación<br />
14. Condición <strong>de</strong> humedad<br />
--<br />
--<br />
HÚMEDO<br />
'-<br />
• '<br />
--<br />
= —<br />
e =<br />
= m<br />
= = 34<br />
MUY HÚMEDO HÚMEDO<br />
9<br />
40<br />
14<br />
<strong>45</strong><br />
16<br />
46<br />
9<br />
27<br />
..<br />
9<br />
--<br />
23<br />
••<br />
12 236 1<br />
S E C O<br />
HÚMEDO<br />
Derechos Reservados: Centro Cientffico Tropical<br />
n<br />
><br />
><br />
s<br />
><br />
TO<br />
n
ESTACIÓN CONTUMAZA<br />
RELACIÓN DE BIOTEMPERATURA, PRECIPITACIÓN Y EVAPOT RAN SP I RACIÓN POTENCIAL<br />
Gráfico<br />
Zona <strong>de</strong> Vida : bosque seco - Montano Bajo Tropical<br />
Altitud: 2,300 m.J.n.m.<br />
Latitud : 07' 22' S<br />
Evapotranspiración Real<br />
Longitud :<br />
78° 49' O<br />
Evapotranspiración Potencial<br />
PROMEDIO ANUAL DE :<br />
Temperatura<br />
1.-<br />
2.-<br />
Biotemperatura<br />
Precipitación total<br />
14.6 "C<br />
533 mm.<br />
3.-<br />
Potencial <strong>de</strong> evapotranspiración<br />
853 mm.<br />
4.-<br />
Re<strong>la</strong>ción <strong>de</strong> evapotranspiración potencial<br />
1.60<br />
-150 —<br />
e<br />
^<br />
5.-<br />
6.-<br />
7.-<br />
Evapotranspiración real estimada<br />
Escorrentía<br />
Deficiencia <strong>de</strong> precipitación<br />
323 mm.<br />
210 mm.<br />
236 mm.<br />
'5<br />
E<br />
:!<br />
o<br />
a<br />
Temp<strong>la</strong>da<br />
Re<strong>la</strong>ción ETP<br />
UBICACIÓN CLIMÁTICA :
CUADRO N° 7<br />
TABLA: CALCULO DEL BALANCE HIDRICO DE SUELOS ZONALES CON VEGETACIÓN NATURAL MADURO PARA: "SAN JUAN"<br />
Período <strong>de</strong> tegisteo: precipitación 64/74<br />
Zona <strong>de</strong> vida bosque seco - Montano Bajo Tropical<br />
temperatura 64 / 74<br />
P„ET./R 1.05<br />
LAT. 07° 17' S<br />
LONG, 78° 30' W<br />
ALT: 2224m„s.n.m,<br />
OQ<br />
Promedio <strong>de</strong> <strong>la</strong>rgo término<br />
en ° C o mm„<br />
Ene.<br />
Feb.<br />
Mar.<br />
Abr<br />
Meses<br />
May<br />
<strong>de</strong>l<br />
Jun.<br />
A ño<br />
Jul.<br />
Ago.<br />
Set.<br />
Oct,<br />
Nov.<br />
Die,<br />
Año<br />
1„ Temperatura<br />
15,3<br />
15.2<br />
15.0<br />
15,3<br />
15 7<br />
15 6<br />
16.2<br />
15,9<br />
16.1<br />
15.7<br />
15.9<br />
15.5<br />
15,6<br />
2. BiOtemperatura<br />
15.3<br />
15,2<br />
15,0<br />
15,3<br />
15.7<br />
15.6<br />
16.2<br />
15.9<br />
16.1<br />
15.7<br />
15.9<br />
15.5<br />
15.6<br />
3. Evapotraospjración potencial<br />
77<br />
69<br />
75<br />
74<br />
79<br />
76<br />
81<br />
80<br />
78<br />
79<br />
77<br />
78.<br />
923<br />
4. EvapotEanspiración límite en<br />
clima seco 0. 9512<br />
73<br />
66<br />
72<br />
71<br />
75<br />
72<br />
77<br />
76<br />
74<br />
75<br />
73<br />
74<br />
878<br />
5, Precipitación<br />
119<br />
156<br />
192<br />
115<br />
22<br />
12<br />
5<br />
10<br />
29<br />
77<br />
53<br />
88<br />
878<br />
6, E/apotranspíración real<br />
73<br />
66<br />
72<br />
71<br />
66<br />
34<br />
16<br />
15<br />
18<br />
47<br />
50<br />
69<br />
597<br />
7, Exceso <strong>de</strong> precipitación<br />
46<br />
90<br />
120<br />
44<br />
--<br />
..<br />
a s<br />
= .<br />
11<br />
30<br />
3<br />
19<br />
8 Recarga <strong>de</strong> humedad <strong>de</strong>l suelo<br />
19<br />
9 a<br />
B 9<br />
-.<br />
e ^<br />
..<br />
.,<br />
.-<br />
11<br />
30<br />
3<br />
19<br />
9» Agotamiento <strong>de</strong> humedad <strong>de</strong>l<br />
suelo<br />
10 Humedad almacenada en el<br />
suelo: fin <strong>de</strong> mes PF"44mm.<br />
11. Escorrentfa total<br />
12. Deficiencia <strong>de</strong> humedad en el<br />
suelo: fin <strong>de</strong> mes<br />
13. Deficiencia <strong>de</strong> precipitación<br />
14. Condición <strong>de</strong> humedad<br />
...<br />
88 88<br />
27 90<br />
.» ,. -^<br />
-- --<br />
S S<br />
HÚMEDO MUY HÚMEDO HÚMEDO<br />
„<br />
88 88<br />
120 44<br />
-- —<br />
-- --<br />
44<br />
44<br />
,.<br />
:.<br />
53<br />
22<br />
22<br />
--<br />
22<br />
60<br />
11<br />
11<br />
--<br />
33<br />
72<br />
5 -- .. -- -.<br />
6 17 47 50 69<br />
• •<br />
38<br />
66<br />
SECO<br />
-- --<br />
27 --_<br />
<strong>45</strong> --<br />
.. ..<br />
* w<br />
--<br />
20 ..<br />
HÚMEDO<br />
Derechos Reservados: Centro Científico Tropical<br />
281<br />
316<br />
N<br />
O<br />
Z<br />
><br />
z<br />
o<br />
jo<br />
H<br />
M<br />
O<br />
O<br />
><br />
><br />
><br />
O<br />
>
ESTACIÓN SAN JUAN<br />
RELACIÓN DE BIOTEMPERATURA, PRECIPITACIÓN Y EVAPOTRANSPIRACION POTENCIAL<br />
Gráfie<br />
Evapotranspiración Real<br />
Evapotranspiración Potencial<br />
Temperatura<br />
Zona <strong>de</strong> Vida : bosque seco - Montano Bajo Tropical<br />
Altitud: 2,224 m.s.n.m.<br />
Latitud :<br />
07° 17' S<br />
Longitud : 78° 30' O<br />
PROMEDIO ANUAL DE :<br />
1.- Biotemperatura 15.6 0 C<br />
2.- Precipitación total 878 mm.<br />
3.- Potencial <strong>de</strong> evapotranspiración 923 mm.<br />
4.- Re<strong>la</strong>ción <strong>de</strong> evapotranspiración potencial 1.05<br />
5.- Evapotranspiración real estimada 597 mm.<br />
6.- Escorrentia 281 mm.<br />
7.- Deficiencia <strong>de</strong> precipitación 316 mm.<br />
CUADRO N° 8<br />
TABLA: CALCULO DEL BALANCE HIPRTCO DE SUELOS ZONALES CON VF.CFTACTON NATURA!. MADURO PARA "CONCHAN"<br />
Periodo <strong>de</strong> registro •<br />
Zona <strong>de</strong> vida bs-MBT<br />
(Transicional)<br />
precipitación 64/74 temperatura 70/74<br />
P.ET./R 0.93<br />
LAT.Oe^?' S<br />
LONG.: 78" 40* W<br />
ALT. 2400m.s.n.m.<br />
S<br />
it".<br />
O<br />
Promedio <strong>de</strong> <strong>la</strong>rgo término<br />
en 0 C o mm.<br />
Ene.<br />
Feb.<br />
Mar,<br />
Meses <strong>de</strong>l Año<br />
Abr, May. Jun.<br />
Jul.<br />
Ago.<br />
Set.<br />
Oct.<br />
Nov,<br />
Die.<br />
Año<br />
1, Temperatura<br />
14.9<br />
15.1<br />
15.2<br />
15.4<br />
15.6<br />
15.2<br />
14.7<br />
15.2<br />
15.3<br />
15.4<br />
15,4<br />
15.2<br />
15.2<br />
2. Biotemperatura<br />
14.9<br />
15.1<br />
15.2<br />
15.4<br />
15.6<br />
15.2<br />
14.7<br />
15.2<br />
15.3<br />
15.4<br />
15.4<br />
15,2<br />
15,2<br />
3. Evapotranspirací6n potencial<br />
75<br />
69<br />
76<br />
75<br />
-78<br />
74<br />
74<br />
76<br />
74<br />
77<br />
75<br />
76<br />
899<br />
4, Evapotranspiraci5n limite en<br />
clima seco<br />
—<br />
--<br />
*<br />
= =<br />
* a<br />
st «<br />
-<br />
--<br />
--<br />
--<br />
—<br />
--<br />
-- *<br />
5. Precipitación<br />
115<br />
81<br />
129<br />
111<br />
51<br />
30<br />
22<br />
23<br />
86<br />
132<br />
120<br />
66<br />
966<br />
6. Evapotranspiracíón real<br />
75<br />
69<br />
76<br />
75<br />
78<br />
65<br />
39<br />
32<br />
48<br />
77<br />
75<br />
76<br />
785<br />
7, Exceso <strong>de</strong> precipitación<br />
40<br />
12<br />
53<br />
36<br />
--<br />
= -<br />
'-<br />
--<br />
38<br />
55<br />
<strong>45</strong><br />
--<br />
8. Recarga <strong>de</strong> humedad <strong>de</strong>l suelo 1°<br />
--<br />
W 9<br />
-•<br />
--<br />
--<br />
.,<br />
jr a<br />
38<br />
50<br />
— =<br />
--<br />
9. A gotamiento <strong>de</strong> humedad <strong>de</strong>l<br />
suelo<br />
10. Humedad almacenada en el<br />
suelo: fin <strong>de</strong> mes PF 49 mm.<br />
11. Escorrentfa total 30<br />
12. Deficiencia <strong>de</strong> humedad en el<br />
suelo: fin <strong>de</strong> mes<br />
13. Deficiencia <strong>de</strong> precipitación<br />
14. Condición <strong>de</strong> humedad<br />
97<br />
--<br />
--<br />
--<br />
97<br />
12<br />
--<br />
..<br />
.. --<br />
97 97<br />
53 36<br />
-. ..<br />
-• --<br />
H U M ED O<br />
27<br />
70<br />
--<br />
--<br />
27<br />
35<br />
35<br />
--<br />
14<br />
44<br />
17 9<br />
18 9<br />
--<br />
31 40<br />
52 53<br />
SECO<br />
47<br />
--<br />
8<br />
..<br />
•-<br />
97<br />
5<br />
*-<br />
--<br />
--<br />
97<br />
<strong>45</strong><br />
-<br />
--<br />
HÚMEDO<br />
10<br />
87<br />
--<br />
.,<br />
10<br />
181<br />
186<br />
N<br />
O<br />
><br />
Z<br />
O<br />
jo<br />
H<br />
a<br />
m<br />
n<br />
><br />
S<br />
><br />
n<br />
Derechos Reservados: Centro Cientfñco Tropical.
ESTACIÓN CONCHAN<br />
RELACIÓN DE BIOTEMPERATURA, PRECIPITACIÓN Y EVAPOTRANSPIRACION POTENCIAL Gréf¡coN 0 7<br />
Evapotranspiroción Real<br />
Evapotranspiroción Potencial<br />
Temperatura<br />
Zona <strong>de</strong> Vida : bosque seco -Montano Bajo Tropical<br />
Altitud : 2,400 m.s.n.m.<br />
Latitud :<br />
06° 27' S<br />
Longitud : 78° 40' O<br />
PROMEDIO ANUAL DE :<br />
1.- Biotemperatura 15.9 "C<br />
2.- Precipitación total 966 mm.<br />
3.- Potencial <strong>de</strong> evapotranspiroción 899 mm.<br />
4.- Re<strong>la</strong>ción <strong>de</strong> evapotranspiroción potencial 0.93<br />
5.- Evapotranspiroción real estimada 785 mm.<br />
6.- Escorrentia 181 mm.<br />
7.- Deficiencia <strong>de</strong> precipitación 186 mm.<br />
^<br />
8-<br />
c<br />
e<br />
l<br />
o<br />
o<br />
a<br />
Temp<strong>la</strong>da<br />
E F M A M J J A S O N D<br />
Re<strong>la</strong>ción ETP<br />
UBICACIÓN CLIMÁTICA :<br />
BU<br />
•<br />
M
CUADRO N" 9<br />
TABLA: CALCULO DEL BALANCE HIDRICO DE SUELOS ZONALES CON VEGETACIÓN NATURAL MADURO PARA ' LLAUCANO'YTororco)<br />
Periodo <strong>de</strong> registro : Preeípitaoón 6^/74<br />
Zona <strong>de</strong> vida bosque seco Montano B ajo Tropical<br />
Pi omedio <strong>de</strong> <strong>la</strong>rgo término<br />
en ° C o mm»<br />
I. Temperatura<br />
2, Bioremperatura<br />
3, Evapotranspiración potencial<br />
4. Evapotranspiración Ifmíte en<br />
clima seco 0,9110<br />
5. Precipitación<br />
6. Evapotranspiración real<br />
7. Exceso <strong>de</strong> precipitación<br />
8. Recarga <strong>de</strong> humedad <strong>de</strong>l suelo<br />
9. Agotamiento <strong>de</strong> humedad <strong>de</strong>l<br />
suelo<br />
10. Humedad almacenada en el<br />
suelo:fin <strong>de</strong> mes PF 38 mm.<br />
11. Escorrentfa total<br />
^2<br />
Deficiencia <strong>de</strong> humedad en el<br />
suelo: fin <strong>de</strong> mes<br />
13. Deficiencia <strong>de</strong> precipitación<br />
14» Condición <strong>de</strong> humedad<br />
Ene.<br />
13.6<br />
13.6<br />
68<br />
62<br />
61<br />
62<br />
--<br />
--<br />
1<br />
74<br />
--<br />
1<br />
Feb.<br />
14.1<br />
14.1<br />
64<br />
58<br />
78<br />
58<br />
20<br />
1<br />
--<br />
75<br />
19<br />
..<br />
--<br />
HUM<br />
Meses <strong>de</strong>l Año<br />
Jul.<br />
Mar, Abr. May, Jun<br />
1<br />
EDO<br />
14.1<br />
14.1<br />
71<br />
64<br />
111<br />
64<br />
47<br />
--<br />
--<br />
75<br />
14.3<br />
14.3<br />
69<br />
63<br />
92<br />
63<br />
29<br />
--<br />
.-<br />
75<br />
14.2<br />
14.2<br />
71<br />
65<br />
35<br />
65<br />
--<br />
--<br />
30<br />
<strong>45</strong><br />
13.8<br />
13,8<br />
67<br />
61<br />
23<br />
<strong>45</strong><br />
„<br />
.,<br />
22<br />
23<br />
13.1<br />
13.1<br />
66<br />
60<br />
20<br />
31<br />
..<br />
.-<br />
11<br />
12<br />
R B<br />
47 29<br />
.. .,<br />
K •<br />
--<br />
15<br />
..<br />
26<br />
-- -- 30 38 40<br />
Temperatura 67/73<br />
P.ET./R 1,09<br />
S E C O<br />
Ago.<br />
13.6<br />
13.6<br />
68<br />
62<br />
17<br />
23<br />
--<br />
..<br />
• •<br />
6<br />
6<br />
32<br />
<strong>45</strong><br />
Set.<br />
14.1<br />
14,1<br />
68<br />
62<br />
51<br />
29<br />
22<br />
22<br />
28<br />
--<br />
4<br />
11<br />
Oct.<br />
14.3<br />
14.3<br />
72<br />
66<br />
104<br />
Derechos Reservados: Centro Cientffico Tropical<br />
66<br />
38<br />
38<br />
•-<br />
66<br />
--<br />
..<br />
--<br />
Nov.<br />
14.0<br />
14.0<br />
68<br />
62<br />
90<br />
62<br />
28<br />
..<br />
9<br />
75<br />
19<br />
--<br />
--<br />
HÚMEDO<br />
LAT. 06° 44" S<br />
LONG. 78° 32' W<br />
ALT • 2,B20m.s„n.in.<br />
Die<br />
13.8<br />
13.8<br />
69<br />
63<br />
66<br />
63<br />
3<br />
•-<br />
•-<br />
75<br />
3<br />
--<br />
Año<br />
13.9<br />
13.9<br />
821<br />
748<br />
748<br />
631<br />
117<br />
165<br />
13<br />
N<br />
O<br />
z<br />
><br />
z<br />
o<br />
TO<br />
H<br />
m<br />
a<br />
n<br />
><br />
><br />
JO<br />
n
ESTACIÓN LLAUCANO<br />
TORORCO<br />
RELACIÓN DE BIOTEMPERATURA, PRECIPITACIÓN Y EVAPOTRANSPIRACION POTENCIAL<br />
Gráfico N<br />
Evapotransp!ración Real<br />
Evapotranspiración Potencial<br />
Temperatura<br />
Zona <strong>de</strong> Vida : bosque seco - Montano Bajo Tropical<br />
Altitud: 2,750 m.s.n.m.<br />
Latitud : 06° 44' S<br />
Longitud : 78° 32' O<br />
PROMEDIO ANUAL DE :<br />
1.- Biotemperatura 13.9 "C<br />
2.- Precipitación total 748 mm.<br />
3.- Potencial <strong>de</strong> evapotranspi ración 821 mm.<br />
4.- Re<strong>la</strong>ción <strong>de</strong> evapotranspiración potencial 1.09<br />
150 —<br />
5.- Evapotranspiración real estimada 631 mm.<br />
6. - Escorrentia 117 mm.<br />
7.- Deficiencia <strong>de</strong> precipitación 165 mm.<br />
" ^<br />
Temp<strong>la</strong>da<br />
Montano bajo<br />
Re<strong>la</strong>ción ETP<br />
UBICACIÓN CLIMÁTICA ¡<br />
"^
CUADRO N" 10<br />
TABLA: CALCULO DEL BALANCE HIDRICO DE SUELOS ZONALES CON VEGETACIÓN NATURAL MADURO PARA: "CUTERVO"<br />
Periodo <strong>de</strong> registro :<br />
Zona <strong>de</strong> vida bh" MBT (Transicional)<br />
Precipitación 64/73 temperatura 64/73<br />
P.ET./R 0:87<br />
LAr 06° 23' S<br />
LONG, 78° 52 : W<br />
ALT: 2<strong>45</strong>0 m.s.n.m.<br />
^<br />
^<br />
Promedio <strong>de</strong> <strong>la</strong>rgo término<br />
en °C o mm.<br />
Ene.<br />
Feb.<br />
Mar.<br />
Abr.<br />
Meses <strong>de</strong>l Año<br />
May. Jun. Jul.<br />
Ago.<br />
Set.<br />
Oct.<br />
Nov,<br />
Die.<br />
Afio<br />
1. Temperatura<br />
13.6<br />
13.9<br />
13.7<br />
13,9<br />
14.0<br />
13.5<br />
13.0<br />
13.5<br />
13.8<br />
13.8<br />
14.1<br />
13.9<br />
13.7<br />
2. Biotemperatura<br />
13.6<br />
13.9-<br />
13.7<br />
13.9<br />
14.0<br />
13.5<br />
13.0<br />
13.5<br />
13.8<br />
13.8<br />
14.1<br />
13.9<br />
13.7<br />
3. Evapotranspiración potencial<br />
68<br />
63<br />
69<br />
67<br />
70<br />
65<br />
65<br />
68<br />
67<br />
69<br />
68<br />
70<br />
809<br />
4. Evapotranspiración limite en<br />
clima seco<br />
--<br />
--<br />
--<br />
--<br />
--<br />
--<br />
--<br />
--<br />
--<br />
--<br />
--<br />
--<br />
--<br />
5. Precipitación<br />
78<br />
81<br />
130<br />
125<br />
62<br />
34<br />
27<br />
30<br />
70<br />
104<br />
100<br />
87<br />
928<br />
6. Evapotranspiración real<br />
68<br />
63<br />
69<br />
67<br />
70<br />
65<br />
54<br />
43<br />
42<br />
69<br />
68<br />
70<br />
748<br />
7, Exceso <strong>de</strong> precipitación<br />
10<br />
18<br />
61<br />
58<br />
m m<br />
--<br />
--<br />
--<br />
28<br />
35<br />
32<br />
17<br />
8, Recarga <strong>de</strong> humedad <strong>de</strong>l suelo<br />
--<br />
,.<br />
..<br />
v m<br />
••<br />
--<br />
•• *<br />
--<br />
28<br />
35<br />
16<br />
-.<br />
9. Agotamiento <strong>de</strong> humedad <strong>de</strong>l<br />
suelo<br />
10. Humedad almacenada en el<br />
suelo: fin <strong>de</strong> mes PF 51 mm.<br />
11. Escorrentia total<br />
12. Deficiencia <strong>de</strong> humedad en el<br />
suelo: fin <strong>de</strong> mes<br />
¡] 3. Deficiencia <strong>de</strong> precipitación<br />
14. Condición <strong>de</strong> humedad<br />
—<br />
93<br />
10<br />
- »<br />
*s m<br />
—<br />
93<br />
18<br />
--<br />
--<br />
.-<br />
93<br />
61<br />
--<br />
--<br />
93<br />
58<br />
--<br />
" •<br />
H Ú M E D O<br />
8<br />
85<br />
K C<br />
W -<br />
8<br />
31<br />
54<br />
--<br />
--<br />
31<br />
27<br />
27<br />
--<br />
24<br />
38<br />
13<br />
14 42<br />
--<br />
37 --<br />
38 --<br />
S E C O<br />
.,<br />
77<br />
--<br />
--<br />
--<br />
„<br />
93<br />
16<br />
—<br />
--<br />
HÚMEDO<br />
--<br />
93<br />
17<br />
-'<br />
--<br />
180<br />
: 115<br />
N<br />
O<br />
z<br />
><br />
z<br />
o<br />
jo<br />
H<br />
m<br />
a<br />
tn<br />
n<br />
><br />
><br />
S<br />
><br />
pa<br />
n<br />
Derechos Reservados: Centro Científico Tropical.
ESTACIÓN CUTERVO<br />
RELACIÓN DE BIOTEMPERATURA, PRECIPITACIÓN Y EVAPOT RAN SP I RACIÓN POTENCIAL<br />
Gráfico N<br />
Zona <strong>de</strong> Vida : bosque húmedo. Montano Bajo Tropical<br />
Altitud : 2/50 m.s.n.m.<br />
Latitud :<br />
06° 23' S<br />
Longitud : 78° 52' O<br />
Evapotranspiración Potencial<br />
Temperatura<br />
PROMEDIO ANUAL DE :<br />
1.- Biotemperatura 13.7 "C<br />
2.- Precipitación total 928 mm.<br />
3.- Potencial <strong>de</strong> evapotranspiración 809 mm.<br />
4.- Re<strong>la</strong>ción <strong>de</strong> evapotranspiración potencial 0.87<br />
5.- Evapotranspiración real estimada 748 mm.<br />
ó.- Escorrentia ' 180 mm.<br />
7.- Deficiencia <strong>de</strong> precipitación 115 mm.<br />
Temp<strong>la</strong>da<br />
E F M A M J J A S O N D<br />
1.00 0.50<br />
Re<strong>la</strong>ción ETP<br />
UBICACIÓN CLIMÁTICA :
CUADRO N° 11<br />
TABLA: CALCULO DEL BALANCE HIDRICO DE SUELOS ZONALES CON VEGETACIÓN NATURAL MADURO PARA "CHOTA"<br />
Período <strong>de</strong> registro : precipitación 64/74<br />
Zona <strong>de</strong> vida bosque húmedo Montano Bajo Tropical (Trransicional)<br />
temperatura 64/74<br />
P.ET./R 0-96<br />
LAT<br />
LONG<br />
ALT<br />
06° 33* S<br />
78° 39* W<br />
2410 m.s.n.m.<br />
Promedio <strong>de</strong> <strong>la</strong>rgo término<br />
en ° C o mm.<br />
Ene.<br />
Feb.<br />
Mar.<br />
Abr.<br />
Mes es <strong>de</strong>l Año<br />
May. Jun. Jul.<br />
Ago.<br />
Set.<br />
Oct.<br />
Nov.<br />
Die.<br />
Aflo<br />
1. Temperatura<br />
2. Biotemperatura<br />
15.8<br />
15.5<br />
15.7<br />
15.7<br />
15.7<br />
15.2<br />
15.1<br />
15.3<br />
15.7<br />
15.8<br />
15.9<br />
15.9<br />
15.6<br />
3. Evapotranspiración potencial<br />
79<br />
71<br />
79<br />
76<br />
79<br />
74<br />
76<br />
77<br />
76<br />
79<br />
77<br />
80<br />
923<br />
4. Evapotranspiración límite en<br />
clima seco<br />
--<br />
--<br />
--<br />
..<br />
--<br />
--<br />
--<br />
••<br />
..<br />
—<br />
..<br />
--<br />
—<br />
5. Precipitación<br />
87<br />
92<br />
118<br />
125<br />
60<br />
35<br />
27<br />
32<br />
78<br />
130<br />
108<br />
67<br />
959<br />
6. Evapotranspiración real<br />
79<br />
71<br />
79<br />
76<br />
79<br />
74<br />
46<br />
26<br />
52<br />
79<br />
77<br />
80<br />
818<br />
7. Exceso <strong>de</strong> precipitación<br />
8<br />
21<br />
39<br />
49<br />
--<br />
--<br />
--<br />
6<br />
26<br />
51<br />
31<br />
--<br />
8. Recarga <strong>de</strong> humedad <strong>de</strong>l suelo<br />
8<br />
5<br />
--<br />
—<br />
--<br />
--<br />
--<br />
6<br />
26<br />
<strong>45</strong><br />
--<br />
9» Agotamiento <strong>de</strong> humedad <strong>de</strong>l<br />
suelo<br />
10. Humedad almacenada en el suelo:<br />
fin <strong>de</strong> mes PF 48 mm.<br />
11. Escorrentfa total<br />
12. Deficiencia <strong>de</strong> humedad en el suelo:<br />
fin <strong>de</strong> mes<br />
13. Deficiencia <strong>de</strong> precipitación<br />
14. Condición <strong>de</strong> humedad<br />
5<br />
91<br />
--<br />
'-<br />
—<br />
96<br />
16<br />
--<br />
--<br />
-- -•<br />
96 96<br />
39 49<br />
-- --<br />
-- -"<br />
H Ú M E D O<br />
19<br />
77<br />
--<br />
--<br />
19<br />
39<br />
38<br />
--<br />
10<br />
39<br />
19<br />
19<br />
--<br />
29<br />
49<br />
13<br />
25<br />
--<br />
23<br />
42<br />
..<br />
51<br />
--<br />
--<br />
--<br />
S E C O<br />
-.<br />
96<br />
6<br />
--<br />
--<br />
-- 13<br />
96 83<br />
31 --<br />
-- --<br />
M —<br />
H Ú M E D O<br />
Derechos Reservados: Centro Científico Tropical<br />
13<br />
141<br />
162<br />
N<br />
O<br />
Z<br />
><br />
z<br />
o<br />
pa<br />
H<br />
m<br />
a<br />
tn<br />
O<br />
><br />
><br />
s<br />
><br />
SO<br />
O<br />
>
ESTACIÓN CHOTA<br />
RELACIÓN DE BIOTEMPERATURA, PRECIPITACIÓN Y EVAPOTRANSPIRACION POTENCIAL Gráfico N" 10<br />
Evapotranspiración Real<br />
Evapotranspiración Potencial<br />
Temperatura<br />
Zona <strong>de</strong> Vida : bosque húmedo Montano Bajo Tropical<br />
Altitud : 2,410<br />
Latitud :<br />
Longitud :<br />
Oó" 33' S<br />
78° 39' O<br />
PROMEDIO ANUAL DE :<br />
1.- Biotemperaíura<br />
Precipitación total<br />
Potencial <strong>de</strong> evapotranspiración<br />
15.6 "C<br />
959 mm.<br />
923 mm.<br />
Re<strong>la</strong>ción <strong>de</strong> evapotranspiración potencial 0.96<br />
-150 —<br />
Evapotranspiración real estimada<br />
818 mm.<br />
6.- Escorrentia 141 mm.<br />
n<br />
¡i i<br />
7.- Deficiencia <strong>de</strong> precipitación 162 mm.<br />
-100<br />
1<br />
IÜI! I !<br />
Í-Í i-r- T<br />
_=-. - -4« .-i-Ui<br />
I<br />
i'i: •<br />
' i i i ! 1<br />
i; i •' i<br />
: I<br />
n i<br />
>g<br />
Temp<strong>la</strong>da<br />
i<br />
l<br />
r—r<br />
r—T—T"<br />
E F M A M J J A S O " N D<br />
/ \ Húmedo 7 \<br />
2.00<br />
\<br />
1.00 0.50<br />
Re<strong>la</strong>ción ETP<br />
UBICACIÓN CLIMÁTICA :
CUADRO N° 12<br />
TABLA: CALCULO DEL BALANCE HIDRICO DE SUELOS ZONALES CON VEGETACIÓN NATURAL MADURO PARA "HUALGAYOC'<br />
Período <strong>de</strong> registro: Precipitación 67/74<br />
Zona <strong>de</strong> vida bosque muy húmedo - Montano Tropical<br />
Temperatura 72/74<br />
P.ET./R 0.30<br />
LAT: 06° 46' S<br />
LONG: 78° 36" W<br />
ALT: 3600 m.s.n.m.<br />
~0<br />
¡ft<br />
era<br />
oo<br />
Promedio <strong>de</strong> <strong>la</strong>rgo término<br />
en " C o mm.<br />
Ene.<br />
Feb.<br />
Mar.<br />
Meses <strong>de</strong>l Aflo<br />
Abr. May. Jun. Jul.<br />
Ago,<br />
Set.<br />
Oct.<br />
Nov.<br />
Die.<br />
Año<br />
1. T «mperatura<br />
7.2<br />
7.8<br />
7.6<br />
7.6<br />
7.7<br />
7.2<br />
6.8<br />
6.9<br />
7.0<br />
7.7<br />
8,1<br />
7.1<br />
7.4<br />
2. Biotemperatura<br />
7.2<br />
7.8<br />
7.6<br />
7.6<br />
7.7<br />
7.2<br />
6.8<br />
6.9<br />
7.0<br />
7.7<br />
8.1<br />
7.1<br />
7.4<br />
3. Evapotranspiración potencial<br />
36<br />
36<br />
38<br />
37<br />
39<br />
35<br />
34<br />
35<br />
34<br />
39<br />
39<br />
36<br />
438<br />
4. Evapotranspiración limite en<br />
clima seco<br />
--<br />
- •<br />
--<br />
--<br />
--<br />
--<br />
- •<br />
"<br />
--<br />
--<br />
---<br />
--<br />
""<br />
5. Precipitación<br />
141<br />
170<br />
209<br />
154<br />
60<br />
55<br />
36<br />
46<br />
99<br />
194<br />
146<br />
140<br />
1<strong>45</strong>0<br />
6. Evapotranspiración real<br />
36<br />
36<br />
38<br />
37<br />
39<br />
35<br />
34<br />
35<br />
34<br />
39<br />
39<br />
36<br />
438<br />
7. Exceso <strong>de</strong> precipitación<br />
105<br />
134<br />
171<br />
117<br />
21<br />
20<br />
2<br />
11<br />
65<br />
155<br />
107<br />
104<br />
8. Recarga <strong>de</strong> humedad <strong>de</strong>l suelo<br />
9. Agotamiento <strong>de</strong> humedad <strong>de</strong>l se<br />
suelo<br />
10. Humedad almacenada en el sue"<br />
lo: fin <strong>de</strong> mes PF 44 mm.<br />
1<strong>45</strong><br />
» »<br />
9 9<br />
1<strong>45</strong><br />
..<br />
•» •<br />
1<strong>45</strong><br />
--<br />
—<br />
1<strong>45</strong><br />
--<br />
--<br />
1<strong>45</strong><br />
- •<br />
--<br />
1<strong>45</strong><br />
—<br />
.,<br />
1<strong>45</strong><br />
•-<br />
-.<br />
1<strong>45</strong><br />
--<br />
.*<br />
1<strong>45</strong><br />
--<br />
--<br />
1<strong>45</strong><br />
--<br />
«-<br />
1<strong>45</strong><br />
• V<br />
1» -<br />
1<strong>45</strong><br />
N<br />
O<br />
Z<br />
><br />
Z<br />
O<br />
70<br />
H<br />
11. Escorrentia total<br />
12. Deficiencia <strong>de</strong> humedad en el<br />
suelo: fin <strong>de</strong> mes<br />
105<br />
..<br />
134<br />
•-<br />
171<br />
--<br />
117<br />
..<br />
21<br />
- •<br />
20<br />
--<br />
2<br />
--<br />
11<br />
--<br />
65<br />
•-<br />
155<br />
"<br />
107<br />
"<br />
104<br />
„<br />
1012<br />
a<br />
en<br />
n<br />
><br />
13, Deficiencia <strong>de</strong> precipitación<br />
1 14. Condición <strong>de</strong> humedad<br />
"<br />
""<br />
MUY<br />
--<br />
HÚMEDO<br />
--<br />
—<br />
--<br />
-- -- .. -- -- --<br />
H Ú M E D O MUY HÚMEDO<br />
><br />
TO<br />
n<br />
><br />
Derechos Reservados: Centro Científico Tropical.
ESTACIÓN HUALGAYOC<br />
RELACIÓN DE BIOTEMPERATURA, PRECIPITACIÓN Y EVAPOTRANSPIRACIÓN POTENCIAL<br />
GrtficoN"!!<br />
Evapotranspiración Potencial y Real<br />
Temperatura<br />
Zona <strong>de</strong> Vida : bosque muy húmedo Montano Tropical<br />
Altitud : 3,600 m.s.n.m.<br />
Latitud : 06° 46' S<br />
Longitud : 78° 36' O<br />
PROMEDIO ANUAL DE :<br />
1.- Biotemperahira 7.4 "C<br />
2.- Precipitación total 1,<strong>45</strong>0 mm.<br />
3.- Potencial <strong>de</strong> evapotranspiración 438 mm.<br />
4.- Re<strong>la</strong>ción <strong>de</strong> evapotranspiración potencial 0.30<br />
5.- Evapotranspiración real estimada 438 mm.<br />
ó.- Escorrentia 1,012 mm.<br />
7.- Deficiencia <strong>de</strong> precipitación 0 mm.<br />
^<br />
^S<br />
Q.<br />
E<br />
8-<br />
C<br />
S<br />
x<br />
u<br />
o<br />
'a<br />
Temp<strong>la</strong>da fría<br />
E F M A M J J A S O N D<br />
Re<strong>la</strong>ción ETP<br />
UBICACIÓN CLIMÁTICA . . ^
CUADRO N° 13<br />
TABLA: CALCULO DEL BALANCE HIDRICO DE SUELOS ZONALES CON VEGETACIÓN NATURAL MADURO PARA "RUPAHUASI"<br />
Período <strong>de</strong> registro Precipitación 66 / 71<br />
Zona <strong>de</strong> vida; bosque muy húmedo Montano Tropical (Transicional)<br />
Temperatura 66/72<br />
P.ET./R 0.51<br />
LAT. 06° 49'<br />
LONG. 78° 48'<br />
ALT. 2,850m.s.n.m.<br />
SU<br />
OÍ<br />
o<br />
Promedio <strong>de</strong> <strong>la</strong>rgo término<br />
en 0 C o mm. [<br />
1. Temperatura<br />
Ene.<br />
11.4<br />
Feb.<br />
11.4<br />
Mar.<br />
11.4<br />
Abr.<br />
11.6 1<br />
Meses <strong>de</strong>l A ño<br />
May.<br />
11.5<br />
Jun. Jul.<br />
11.1 11.0<br />
Ago.<br />
11.2<br />
Set. Oct.<br />
11.4 1 11.3<br />
Nov.<br />
11.4<br />
Die.<br />
11.5 1<br />
Año<br />
11.4 j<br />
2, Biotemperatura<br />
11.4<br />
11.4<br />
11.4<br />
11.6 1<br />
11.5<br />
11.1<br />
11.0<br />
11.2 1<br />
11.4 1<br />
11.3<br />
11.4<br />
11.5 |<br />
11.4 1<br />
3. Evapotranspiración potencial<br />
57<br />
52<br />
57<br />
56<br />
58<br />
54<br />
55<br />
56<br />
55<br />
57<br />
55<br />
58<br />
670 j<br />
4, Evapotranspiración limite en<br />
cuma seco<br />
»" w<br />
„.<br />
.-<br />
--<br />
--<br />
--<br />
..<br />
--<br />
"<br />
--<br />
--<br />
.-<br />
--<br />
5. Precipitación<br />
126<br />
146<br />
188<br />
135<br />
84<br />
41<br />
35<br />
47<br />
83<br />
191<br />
112<br />
110<br />
1.298<br />
6. Evapotranspiración<br />
57<br />
52<br />
57<br />
56<br />
58<br />
54<br />
55<br />
56<br />
55<br />
57<br />
55<br />
58<br />
670<br />
7. Exceso <strong>de</strong> precipitación<br />
69<br />
94<br />
131<br />
79<br />
26<br />
--<br />
--<br />
28-<br />
134<br />
57<br />
52<br />
8. Recarga <strong>de</strong> humedad <strong>de</strong>l suelo<br />
--<br />
--<br />
--<br />
--<br />
- •<br />
.,<br />
• -<br />
--<br />
28<br />
14<br />
--<br />
--<br />
9. Agotamiento <strong>de</strong> humedad <strong>de</strong>l<br />
suelo<br />
10, Humedad almacenada en el suelo;<br />
fin <strong>de</strong> mes F 91 mm.<br />
11. Escorrentía total<br />
--<br />
130<br />
69<br />
130<br />
94<br />
--<br />
130<br />
131<br />
130<br />
79<br />
..<br />
130<br />
26<br />
13<br />
117<br />
--<br />
20<br />
97<br />
--<br />
9<br />
88<br />
--<br />
116<br />
..<br />
130<br />
120<br />
--<br />
130<br />
57<br />
--<br />
130<br />
52<br />
""<br />
628 !<br />
N<br />
O<br />
Z<br />
><br />
z<br />
o<br />
H<br />
w<br />
a<br />
12. Deficiencia <strong>de</strong> humedad en el suelo:<br />
fin <strong>de</strong> mes<br />
--<br />
"<br />
•-<br />
"<br />
--<br />
""<br />
--<br />
3<br />
--<br />
"<br />
""<br />
n<br />
><br />
13. Deficiencia <strong>de</strong> precipitación<br />
14. Condición <strong>de</strong> humedad<br />
""<br />
H<br />
""<br />
"<br />
MH<br />
"<br />
--<br />
13<br />
20<br />
H<br />
9<br />
--<br />
'-<br />
--<br />
MH<br />
"<br />
H<br />
42<br />
TO<br />
n<br />
H* Húmedo - Húmedo<br />
MH* Muy húmedo<br />
Derechos Reservados: Centro Científico Tropical
ESTACIÓN RUPAHUASI<br />
RELACIÓN DE BIOTEMPERATURA, PRECIPITACIÓN Y EVAPOTRANSPIRACION POTENCIAL Gráfico N 0 12<br />
><br />
Z<br />
m<br />
X<br />
O<br />
Evapotranspiración Potencial y Real<br />
Temperatura<br />
Zona <strong>de</strong> Vida : bosque muy húmedo Montano Tropical<br />
Altitud : 2,750 m.s.n.m.<br />
Latitud :<br />
06° <strong>45</strong>' S<br />
Longitud : 79° 12' O<br />
PROMEDIO ANUAL DE :<br />
1.- Biotemperatura 11.3 "C<br />
2.- Precipitación total 1,414 mm.<br />
3.- Potencial <strong>de</strong> evapotranspiración 668 mm.<br />
4.- Re<strong>la</strong>ción <strong>de</strong> evapotranspiración potencial 0.47<br />
m<br />
o<br />
O<br />
O<br />
O<br />
150 --<br />
5.- Evapotranspiración real estimada 668 mm.<br />
6.- Escorrentía 746 mm.<br />
7.- Deficiencia <strong>de</strong> precipitación 33 mm.<br />
2<br />
E<br />
Temp<strong>la</strong>da frfa<br />
12° Montano<br />
F M A M J<br />
Re<strong>la</strong>ción ETP<br />
UBICACIÓN CLIMÁTICA ¡<br />
^
Pág. 52 ZONA NORTE DE CAJAMARCA<br />
ANEXO ,1V<br />
SUELOS<br />
Descripción <strong>de</strong> perfiles representativos <strong>de</strong> los<br />
sue<strong>la</strong>s.<br />
Análisis <strong>de</strong> <strong>la</strong>s características químicas y fFsi<br />
co - mecánicas <strong>de</strong> los suelos.<br />
0
.MUX O IV SUELOS PJ>J. 53<br />
1. Descripción <strong>de</strong> Perfiles Representativos <strong>de</strong> los Suelos<br />
UN PERFIL DEL SUELO FLUVISOL CALCARICO<br />
Zona<br />
Corre<strong>la</strong>ción con el<br />
Soil Taxonomy ( 1973 )<br />
Fisiografía<br />
Pendiente<br />
Altitud<br />
v_l ima<br />
Precipitación<br />
Temperatura<br />
Zona <strong>de</strong> vida<br />
Material madre<br />
Vegetación<br />
Fragmentos gruesos superficiales<br />
Cocha bamba<br />
Ustifluvent típico<br />
Terraza baja inundable<br />
P<strong>la</strong>no a casi a nivel ( 3% )<br />
1,650 m.s.n.m.<br />
Sub húmedo - Semi cálido<br />
815 mm.<br />
18.°<br />
0 C<br />
bs - PMT ( bosque seco Pre Montano Tropical )<br />
Aluvial - calizas<br />
Rastrojo <strong>de</strong> maíz<br />
No hay<br />
Horizonte<br />
Prof/cm.<br />
Descripción<br />
Ap<br />
AC<br />
0-20 Franco arcilloso a arcil<strong>la</strong>, <strong>de</strong> color pardo amarillento oscuro ( 1 ")<br />
YR 4/4 ) en húmedo. Estructura granu<strong>la</strong>r fina, débil; consistencia<br />
firme en húmedo. Abundante contenido <strong>de</strong> carbonatos libres en ía<br />
masa, con reacción fuerte al HCI diluido. El pH es 7.5 y 2,?¿ "o<br />
el contenido <strong>de</strong> materia orgánica. Límite <strong>de</strong> horizonte difuso o!<br />
20-40 Franco arcilloso, <strong>de</strong> color pardo amarillento oscuro, (10YR4/4),<br />
en húmedo. Masivo, consistencia firme en húmedo. Abundante con<br />
tenido <strong>de</strong> carbonatos libres en <strong>la</strong> masa, con reacción fuerte ai HC!<br />
diluido,, El pH es 7.ó y 2.41% el contenido <strong>de</strong> materia crgánícr*.<br />
Presencia <strong>de</strong> gravil<strong>la</strong> y grava redon<strong>de</strong>ada <strong>de</strong> 2 a 5 cm. <strong>de</strong> diáme -^<br />
tro en un 40%. Límite <strong>de</strong> horizonte c<strong>la</strong>ro al<br />
40 a más Arena gruesa, sin estructura, con abundantes carbonatos libres en<br />
<strong>la</strong> masa, con reacción fuerte al HCI diluido. Presencia <strong>de</strong> cantes<br />
rodados <strong>de</strong> calizas en un 80%.<br />
UN PERFIL DEL SUELO GLEISOL EUTRICO<br />
Zona<br />
Corre<strong>la</strong>ción con el<br />
Soil Taxonomy ( 1973 )<br />
Fisiografía<br />
Pendiente<br />
Carmen Pampa<br />
Tropacuept aérico<br />
L<strong>la</strong>nura aluvial y Lacustre<br />
a nivel o casi a nivel (2%)
Pág. 54 ZONA NORTE DE CAJAMARCA<br />
Altitud<br />
Clima<br />
Precipitación<br />
Temperatura<br />
Zona <strong>de</strong> vida .<br />
Material Madre<br />
Vegetación<br />
Fragmentos gruesos superficiales<br />
2, 540 m.s.n.m.<br />
Húmedo y semifrio<br />
928 mm.<br />
13 0 7 0 C<br />
bh-MBT(bosque húmedo-Montano Bajo Tropical )<br />
Aluvial - <strong>la</strong>custre<br />
Rye grass - totoril<strong>la</strong><br />
No hay<br />
Horizonte<br />
Prof/cm<br />
Descripción<br />
Al 0- 20 Franco arcilloso, <strong>de</strong> color pardo grisáceo oscuro ( 10 YR 4/2 ), en hú<br />
medo, Masivo, <strong>de</strong> consistencia firme en húmedo„ El pH es 5.5 y<br />
6 96% el contenido <strong>de</strong> materia orgánica„ Límite <strong>de</strong> horizonte gradual<br />
al<br />
A3 20- 50 Franco arcilloso, <strong>de</strong> color gris oscuro ( 10 YR 4/1 ) en húmedo. Masivo,<br />
<strong>de</strong> consistencia firme en húmedo» El pH es 5.7 y 3.17 % el<br />
contenido <strong>de</strong> materia orgánica. Límite <strong>de</strong> horizonte gradual al<br />
(B) g 50- 75 Franco arcilloso a arcil<strong>la</strong>, <strong>de</strong> color gris oscuro, ( 10 YR 4/1 ) en hú<br />
medo. Masivo, <strong>de</strong> consistencia muy friable en húmedo 1 . El pH es<br />
5 0 8 y 1 „79%el contenido <strong>de</strong> materia orgánica. Presencia <strong>de</strong> grava<br />
fina en un 30%„ Límite <strong>de</strong> horizonte gradual al<br />
Cl 75 +95 Presencia <strong>de</strong> grava <strong>de</strong> 2 D 5 cm, <strong>de</strong> diámetro, redon<strong>de</strong>ada en un 70%.<br />
UN PERFIL DEL SUELO GLEISOL CALCARICO<br />
Zona<br />
Corre<strong>la</strong>ción con el<br />
Sol! Taxonomy ( 1973 )<br />
Fisiografía<br />
Pendiente<br />
Altitud<br />
Clima<br />
Precipitación<br />
Temperatura<br />
Zona <strong>de</strong> vida<br />
Material madre<br />
Vegetación<br />
Fragmentos gruesos superficiales<br />
Chetrl<strong>la</strong>, Hda 0 La Viña<br />
Tropacuept típico<br />
Terraza medía<br />
A nivel o casi a nivel (2%)<br />
960 moS.n.m»<br />
Seco y Semicálido<br />
500- 1000 mm.<br />
17 - 20° C<br />
bs-PMT (bosque seco - Pre Montano Tropical )<br />
aluvial<br />
arroz<br />
No hay<br />
Horizonte<br />
Profo/cm.<br />
Descripción<br />
Ap 0- 15 Franco arcillo limoso, <strong>de</strong> color gris muy oscuro ( 10 YR 3/1 ) en<br />
húmedo, estructura migajosa, consistencia firme en húmedo. El
ANEXO IV<br />
- SUELOS<br />
Pág.55<br />
pH es 7.6 y 3.<strong>45</strong>% el contenido <strong>de</strong> materia orgánica. Muy alto<br />
contenido <strong>de</strong> carbonatas libres en <strong>la</strong> masa,<br />
c<strong>la</strong>ro al<br />
Limite <strong>de</strong> L - »zofte<br />
(B)<br />
Clg<br />
15-40 Franco arcillo limoso, <strong>de</strong> color gris muy oscuro ( 10 YR 3/1 ) en<br />
húmedo, estructura <strong>de</strong> bloques subangu<strong>la</strong>res medios, débiles; <strong>de</strong><br />
consistencia firme en húmedo. El pH es 7.7 y 2.76% el contení -<br />
do <strong>de</strong> materia orgánica„ Muy alto contenido <strong>de</strong> carbonates libres<br />
en <strong>la</strong> masa. Limite <strong>de</strong> horizonte c<strong>la</strong>ro al<br />
40 - 70 Franco, <strong>de</strong> color pardo grisáceo oscuro ( 2.5 Y 4/2 ) en húmedo .<br />
Masivo, <strong>de</strong> consistencia friable. El pH es 7,8 y 0.76% el contenido<br />
<strong>de</strong> materia orgánica. Muy alto contenido <strong>de</strong> carbonates I i -<br />
bres en <strong>la</strong> masa. Límite <strong>de</strong> horizonte c<strong>la</strong>ro al<br />
C2g 70 -110 Franco, <strong>de</strong> color pardo grisáceo oscuro ( 2,5 Y 4/2 ) en húmedo ,<br />
masivo, <strong>de</strong> consistencia friable. El pH es 80, con muy alto contenido<br />
<strong>de</strong> carbonatas libres en <strong>la</strong> masa» Límite <strong>de</strong> horizonte c<strong>la</strong>ro<br />
al<br />
C3g 110 +125 Franco, <strong>de</strong> color pardo grisáceo oscuro ( 2.5 Y 4/2 ) en húmedo.<br />
Masivo, <strong>de</strong> consistencia friable. El pH es 8,0 con muy alto contenido<br />
<strong>de</strong> carbonatas libres en <strong>la</strong> masa.<br />
120 Napa freática»<br />
UN PERFIL DEL SUELO GLEISOL MOLICO<br />
Zona<br />
Corre<strong>la</strong>ción con el<br />
Soil Taxonomy ( 1973 )<br />
Fisiografía<br />
Pendiente<br />
Altitud<br />
Clima<br />
Precipitación<br />
Temperatura<br />
Zona <strong>de</strong> vida<br />
Material madre<br />
Vegetación<br />
Fragmentos gruesos superficiales<br />
Conday ,<br />
Hap<strong>la</strong>cuol fRivosQuéjitico.<br />
Terraza aluvial<br />
casi a nivel o a nivd ( 0 - 4%)<br />
2,500 rrioS.n.m.<br />
Húmedo y semifrío<br />
928 mm. " '* 1^''&&i¡&$&¿*i'<br />
13.7 0 C<br />
bh-MBT (bosque húmedo - Montano feajo Tropl cal )<br />
aluvial <strong>la</strong>custre<br />
Pastos, totoril<strong>la</strong>, varita <strong>de</strong> San José<br />
No hay<br />
Horizonte<br />
Prof/cm<br />
Des c r ¡ pc i ó n<br />
Al 0-25 Arcil<strong>la</strong>, <strong>de</strong> color pardo oscuro ( 10 YR 3/3 ) en húmedo, Estructu<br />
ra granu<strong>la</strong>r fina, débil, <strong>de</strong> consistencia friable en húmedo. El pH
ZONA NORT L Dh C \ J \UA tlC \<br />
j^'n \ uM D -e 9" nú Te<br />
do. El pH es o.5 y \ .<strong>03</strong> v o e\ contenido <strong>de</strong> - c oria r< i-iíca. Li<br />
mite <strong>de</strong> horizonte difuso al<br />
100 Napa freática<br />
C2g<br />
110-140 Franco arcillo limoso, <strong>de</strong> coloi gris oscuro ( lOYR-V 1 x /parco<br />
amar'IIento ( 10 YR ^/4 ) en húmedo Masivo, <strong>de</strong> consistencia<br />
f rme. El pri es C.A / 0.69% el contenido <strong>de</strong> materia crjáníca.<br />
UN 'ERFIL DEL SUELO PEGOSOL EUTRICO<br />
Zona<br />
Coíreiación con el<br />
Soil Taxonomy ( 1 973 j<br />
Fisiografía<br />
Pendiente<br />
Altitud<br />
Cl irra<br />
i J iecipitación<br />
Temperatura<br />
Zona <strong>de</strong> vída<br />
* 'ajeria! madre<br />
x/ ~ ^étación<br />
F ^jnentos gruesos superficiales<br />
Chota<br />
Usror^ent típico<br />
Laaeta<br />
Fuertemenre inclinada ( 20 % )<br />
?, 220 m.s.n.m.<br />
ríúmedo y temp<strong>la</strong>do<br />
959 mm.<br />
15 6 0 C<br />
hh-M3T-trans (bosque húmedo-Montano Bajo - Tropica!<br />
- Transicional )<br />
Aluvial<br />
Chacana, pasaos, penca azul<br />
Giava ocasional<br />
• zente<br />
Prof/cm,<br />
Des c rip c i ón<br />
0-20 Franco arenoso, <strong>de</strong> color pardo amarillento oscuro ( 10 YR 4/4 )<br />
en húmedo. Estructura granu<strong>la</strong>r fina, débil, consistencia frHble<br />
en húmedo. El pH es 7.4 y 1.10% el contenido <strong>de</strong> materia orgánica.<br />
Límite <strong>de</strong> horizonte difuso al
ANEXO IV - SUELOS Pág. 57<br />
Cl 20 - 65 Franco arenoso, <strong>de</strong> color pardo a pardo oscuro ( 10 YR 4/3 ) en<br />
húmedo. Masivo, <strong>de</strong> consistencia friable en húmedo. El pH es<br />
7.3 y 0.69 % el contenido <strong>de</strong> materia orgánica. Límite <strong>de</strong> hori<br />
zonte difuso al<br />
C2 65 + 120 Franco arcillo arenoso, <strong>de</strong> color pardo a pardo oscuro ( 10 YR<br />
4/3 ) en húmedo. Masivo, <strong>de</strong> consistencia friable en húmedo.El<br />
pH es 7.2 y 0,62 el contenido <strong>de</strong> materia orgánica,<br />
UN PERFIL DEL SUELO REGOSOL CALCARICO<br />
Zona<br />
Corre<strong>la</strong>ción con el<br />
Soil Taxonomy ( 1973 )<br />
Fisiografía<br />
Pendiente<br />
Altitud<br />
Clima<br />
Precipitación<br />
Temperatura<br />
Zona <strong>de</strong> vida<br />
Material madre<br />
Vegetación<br />
Fragmentos gruesos superficiales<br />
Chota<br />
Ustortent típico<br />
Terraza alta<br />
Ligeramente inclinada a inclinada ( 7% )<br />
2, 210 m.s.n.m.<br />
Húmedo y Temp<strong>la</strong>do<br />
959 mm.<br />
15.6 0 C<br />
bh-MBT. trans„ (bosque húmedo- Montano Bajo<br />
Tropical transicíonal )<br />
Aluvio - coluvio<br />
Maíz, pastos.<br />
No hay<br />
Horizonte<br />
Prof/cm<br />
Descripción<br />
All 0- 30<br />
Franco, <strong>de</strong> color pardo amarillento oscuro ( 10 YR 4/4 ) en hume<br />
do. Estructura granu<strong>la</strong>r fina, débil; consistencia friable en hú —<br />
medo. El pH es 7.2 y 1 .17 el contenido <strong>de</strong> materia orgánica.<br />
Presencia <strong>de</strong> carbonatos libres en <strong>la</strong> masa. Límite <strong>de</strong> horizonte<br />
difuso al<br />
Al2 30-60 Franco, <strong>de</strong> color pardo a pardo oscuro ( 10 YR 4/3 ) en húmedo.<br />
Estructura granu<strong>la</strong>r fina, débil; consistencia friable en húmedo.<br />
El pH es 7.2 y 1.10% el contenido <strong>de</strong> materia orgánica. Presen<br />
cía <strong>de</strong> carbonatas libres en <strong>la</strong> masa. Límite <strong>de</strong> horizonte difuso<br />
al.<br />
C 60 a más Franco, <strong>de</strong> color pardo a pardo oscuro ( 10 YR 4/3 ) en húmedo ,<br />
Masivo, <strong>de</strong> consistencia friable en húmedo. El pH es 7.3 y0.89<br />
porciento el contenido <strong>de</strong> materia orgánica. Presencia <strong>de</strong> carbo<br />
natos libres en <strong>la</strong> masa.
Pág. 5£ ZONA NORTE DE CAJAMARCA<br />
UN PERFIL DEL SUELO LITOSOL EUTRICO<br />
Zona<br />
•^G'ie'acrón con el<br />
So., Tü^-^omy ( 1973 )<br />
Fisiografía<br />
Pendiente<br />
Altitud<br />
Cl ima<br />
Precipitación<br />
Temperatura<br />
Zona <strong>de</strong> vida<br />
Material Madre<br />
Vegetación<br />
Fragmentos gruesos superficiales<br />
Succe ( camino a Sócota )<br />
Ustocrept iFtico<br />
La<strong>de</strong>ra<br />
Muy empinada a extremadamente empinada (60%)<br />
1, 950 m.s .n m.<br />
Sub húmedo y temp<strong>la</strong>do<br />
600- 900 mm.<br />
17- 20 o C<br />
bs - PMT ( bosque seco - Pre Montano Tropical )<br />
Areniscas no calcáreas<br />
Eucalipto, zarza, tayanga, chamana<br />
Piedras sub angu<strong>la</strong>res <strong>de</strong> 20 - 30 cm. <strong>de</strong> diámetro en<br />
un 40%<br />
Horizonte<br />
Prof/cm,<br />
De s c r i pe i on<br />
Al 0-15<br />
Franco arenoso, <strong>de</strong> color pardo grisáceo muy oscuro ( 10YR 3/2 )<br />
en húmedo. Estructura granu<strong>la</strong>r fina, débil y <strong>de</strong> consistencia muy<br />
friable en húmedo. El pH es 6.4 y 4.75 el contenido <strong>de</strong> materia<br />
orgánica. Limite <strong>de</strong> horizonte abrupto al<br />
+ 15 Roca <strong>de</strong> arenisca<br />
UN PERFIL DEL SUELO LITOSOL CALCARICO<br />
Zona<br />
Corre<strong>la</strong>ción con el<br />
Soil Taxonomy ( 1973 )<br />
Fisiografía<br />
Pendiente<br />
Altitud<br />
Clima<br />
Precipitación<br />
Temperatura<br />
Zona <strong>de</strong> vida<br />
Material madre<br />
Vegetación<br />
Fragmentos gruesos superficiales<br />
Ga! locantaría ( Socota )<br />
Ustocrept ITtico<br />
La<strong>de</strong>ra<br />
Mo<strong>de</strong>radamente empinada a empinada ( <strong>45</strong>% )<br />
1,800 m.s,n.m.<br />
Sub húmedo y temp<strong>la</strong>do<br />
600- 900 mm.<br />
16- 20 0 C<br />
bs - PMT ( bosque seco - Pre Montano Tropical )<br />
Caliza<br />
MaTz, caña, yuca, café<br />
No hay<br />
Horizonte<br />
Prof/cm<br />
Descripción<br />
Al 0-20<br />
Franco arcilloso, <strong>de</strong> color pardo oscuro ( 7.5 YR 3/2 ) en húmedo<br />
o Estructura granu<strong>la</strong>r fina, débil y <strong>de</strong> consistencia friable en<br />
húmedo. El pH es 7„ 1 y 7c 10% el contenido <strong>de</strong> materia orgáni-
A NEXO IV " SUELOS Pág. 59<br />
ca. Muy alto contenido dé carbonates libres en <strong>la</strong> masa. Límite<br />
<strong>de</strong> horizonte abrupto al<br />
+ 20 Roca caliza con inclusión <strong>de</strong> areniscas calcáreas.<br />
UN PERFIL DEL SUELO LITOSOL DISTRICO<br />
Zona<br />
Corre<strong>la</strong>ción con e!<br />
Soil Taxonomy ( 1973 )<br />
Fisiografía<br />
Pendiente<br />
Altitud<br />
Clima<br />
Precipitación<br />
Temperatura<br />
Zona <strong>de</strong> vida<br />
Material madre<br />
Vegetación<br />
Fragmentos gruesos superficiales<br />
Granja SIPA<br />
Haplumbrept lítico<br />
La<strong>de</strong>ra<br />
Ligeramente inclinada a inclinada ( 8% )<br />
3,550 m.s.n.m. a más<br />
Húmedo y frío<br />
1, 300 mm.<br />
10.2 o C<br />
bmt - MT ( bosque muy húmedo - Montano Tropical )<br />
Residual volcánico<br />
Pasto natural - ca<strong>la</strong>magrostis<br />
Grava 10-20% angu<strong>la</strong>r y sub angu<strong>la</strong>r <strong>de</strong> hasta 8 cm.<br />
Horizonte<br />
Prof/cm.<br />
Descripción<br />
Al<br />
0-20 Franco limoso, <strong>de</strong> color gris muy oscuro a pardo grisáceo muy oscu<br />
ro ( 10 YR 3/15 ) en húmedo, <strong>de</strong> estructura en bloques sub angu<strong>la</strong>res<br />
finos, débiles; consistencia friable. El pH es 4.7 y 10.62% el<br />
contenido <strong>de</strong> materia orgánica. Límite <strong>de</strong> horizonte abrupto al<br />
20 Roca volcánica<br />
UN PERFIL DEL SUELO RENDZINA<br />
Zona<br />
Corre<strong>la</strong>ción con el<br />
Soil Taxonomy ( 1973 )<br />
Fisiografía<br />
Pendiente<br />
Altitud<br />
Clima<br />
Precipitación<br />
Temperatura<br />
Zona <strong>de</strong> vida<br />
Material madre<br />
Vegetación<br />
Fragmentos gruesos superficiales<br />
San Miguel <strong>de</strong> Asunción<br />
Calciustol típico<br />
La<strong>de</strong>ra<br />
Mo<strong>de</strong>radamente empinada e empinada ( 35 % )<br />
1, 780 m , s.n. m.<br />
Sub húmedo y temp<strong>la</strong>do<br />
600 - 900 mm.<br />
17- 20 0 C<br />
bs - PMT ( bosque seco - Pre Montano Tropical )<br />
Residual ( calizas ) ^<br />
Tonga, penca, bísnaga<br />
No hay
Pág. 60 ZONA NORTE DE CAJA MA RCA<br />
Horizonte<br />
Prof/cm,<br />
Descripción<br />
Al 0-25<br />
25-<strong>45</strong><br />
Cl <strong>45</strong>- 85<br />
Arcillo limoso, <strong>de</strong> color pardo oscuro ( 7.5 YR 3/2 ) en húmedo.<br />
Estructura granu<strong>la</strong>r media, débil; <strong>de</strong> consistencia dura en seco.<br />
El pH es 7.8 y 3.65% el contenido <strong>de</strong> materia orgánica.Muy a!<br />
to contenido <strong>de</strong> ccrbonatos libres en <strong>la</strong> masa. Límite <strong>de</strong> horí -<br />
zonte gradual al<br />
Arcillo limoso, <strong>de</strong> color pardo a pardo oscuro ( 7.5 YR 4/4 ) en<br />
húmedo. Estructura en bloques sub angu<strong>la</strong>res medios, débiles y<br />
<strong>de</strong> consistencia dura en seco. El pH es 8,1 y 1.79% elcontenído<br />
<strong>de</strong> materia orgánica. Muy alto contenido <strong>de</strong> carbonates libres<br />
en <strong>la</strong> masa. Limite <strong>de</strong> horizonte difuso al<br />
Franco arcilloso, <strong>de</strong> color pardo amarillento c<strong>la</strong>ro (10YR 6/4 )<br />
en húmedo. Masivo, <strong>de</strong> consistencia dura enseco. El pH es<br />
7.8 y 0.55% el contenido <strong>de</strong> materia orgánica. Muy alto contenido<br />
<strong>de</strong> carbonatas libres en <strong>la</strong> masa. Limite <strong>de</strong> horizonte da<br />
ro al<br />
C2 85 +140 Grava calcárea en un 80%<br />
UN PERFIL DEL SUELO ANDOSOL MOLICO<br />
Zona<br />
Corre<strong>la</strong>ción con el^<br />
Soil Taxonomy ( 1973 )<br />
Físiograffa<br />
Pendiente<br />
Altitud<br />
Clima<br />
Precipitación<br />
Temperatura<br />
Zona <strong>de</strong> vida<br />
Material madre<br />
Vegetación<br />
Fragmentos gruesos superficiales<br />
Quilcate<br />
Eutran<strong>de</strong>pt údico<br />
La<strong>de</strong>ra suave<br />
Ligeramente inclinada a inclinada ( 15% )<br />
3, 200 m .s.n.n.m.<br />
Húmedo y frió<br />
1000 - 2000 mm.<br />
8- 12 0 C<br />
bmh - MT ( bosque muy húmedo - Montano Tropical )<br />
Volcánico<br />
Chira, papa, pastos naturales<br />
No hay<br />
Horizonte<br />
Prof/cm<br />
Descripción<br />
Al 0-30<br />
Franco, <strong>de</strong> color pardo oscuro ( 7.5 YR 3/2)' en húmedo. Estructura<br />
granu<strong>la</strong>r fina, mo<strong>de</strong>rada, <strong>de</strong> consistencia friable en hume -<br />
do. El pH es 6.0 y 5.86% el contenido <strong>de</strong> materia orgánica. LP<br />
mite <strong>de</strong> horizonte difuso al<br />
Bl 30 - 55 Franco arcilloso, <strong>de</strong> color pardo rojizo oscuro ( 5 YR 2.5/2) en<br />
húmedo» Estructura en bloques sub angu<strong>la</strong>res, finos débiles.Con<br />
sistencia friable en húmedo.<br />
El pH es 6.4 y 3.86% el contenido
ANEXOIV "SUELOS Pág. 61<br />
<strong>de</strong> materia orgánica»<br />
Límite <strong>de</strong> horizonte difuso al<br />
B2<br />
B3<br />
CR<br />
55 - 85 Franco arcilloso, <strong>de</strong> color pardo oscuro ( 10 YR 3/3 ) en húmedo.<br />
Estructura en bloques sub angu<strong>la</strong>res finos, mo<strong>de</strong>rados, <strong>de</strong> consis -<br />
tencia firme en húmedo. El pH es 6.4 y 2.69% el contenido <strong>de</strong><br />
materia orgánica. Limite <strong>de</strong> horizonte c<strong>la</strong>ro al<br />
85 -110 Arcil<strong>la</strong>, <strong>de</strong> color pardo a pardo oscuro ( 7«,5 YR 4/4 ) en húmedo.<br />
Masivo, <strong>de</strong> consistencia firme en húmedo. El pH es 6.4 y 2o07%<br />
el contenido <strong>de</strong> materia orgánica. Limite <strong>de</strong> horizonte c<strong>la</strong>ro al<br />
110+160 Roca volcánica en <strong>de</strong>scomposición.<br />
UN PERFIL DEL SUELO ANDOSOL OCRICO<br />
Zona<br />
Corre<strong>la</strong>ción con el<br />
Soil Taxonomy ( 1973 )<br />
Fisiografía<br />
Pendiente<br />
Altitud<br />
Clima<br />
Precipitación<br />
Temperatura<br />
Zona <strong>de</strong> vida<br />
Material madre<br />
Vegetación<br />
Fragmentos gruesos superficiales<br />
San Miguel <strong>de</strong> Pal <strong>la</strong>ques<br />
Eutran<strong>de</strong>pt éntico<br />
La<strong>de</strong>ra<br />
Mo<strong>de</strong>radamente empinada a empinada ( 33% )<br />
2,600 m .s. n. m.<br />
Húmedo y semi frib<br />
1000- 1,500 mm.<br />
12- 15 0 C<br />
bh - MBT ( bosque húmedo - Montano Bajo Tropical )<br />
Volcánico<br />
Pasto, grama, aliso<br />
No hay<br />
Horizonte<br />
Prof/cm<br />
Descripción<br />
Al<br />
B21<br />
B22<br />
0-15 Franco arcillo arenoso, <strong>de</strong> color pardo rojizo oscuro (5YR 3/4 ) ,<br />
en húmedo. Estructura granu<strong>la</strong>r media, mo<strong>de</strong>rada; consistencia<br />
dura en seco. El pH es 6.4 y 5.93% el contenido <strong>de</strong> materia orgánica.<br />
Límite <strong>de</strong> horizonte gradual al<br />
15 - 30 Arcil<strong>la</strong>, <strong>de</strong> color pardo a pardo oscuro ( 7.5 YR 4/4 ) en húmedo.<br />
Estructura en bloques sub angu<strong>la</strong>res medios, débiles; consistencia<br />
dura en seco. El pH es 6.2 y 1.38% el contenido <strong>de</strong> materia orgánica.<br />
Límite <strong>de</strong> horizonte gradual al<br />
30 - 55 Arcil<strong>la</strong>, <strong>de</strong> color pardo rojizo ( 5 YR 4/4 ) en húmedo. Estructura<br />
en bloques sub angu<strong>la</strong>res medios, mo<strong>de</strong>rados; consistencia dura<br />
en seco. El pH es 6o3 y 0.76% el contenido <strong>de</strong> materia orgáni -<br />
ca. Límite <strong>de</strong> horizonte c<strong>la</strong>ro al<br />
CR 55 +120 Roca volcánica en <strong>de</strong>scomposición.
Pág. 62<br />
ZONA NORTE DE CAJAMARCA<br />
UN PERFIL DEL SUELO ANDOSOL VITRICO<br />
Zona<br />
Corre<strong>la</strong>ción con el<br />
Soil Taxonomy ( 1973 )<br />
Fisiografía<br />
Pendiente<br />
Altitud<br />
Clima<br />
Precipitación<br />
Temperatura<br />
Zona <strong>de</strong> vida<br />
Material madre<br />
Vegetación<br />
Fragmentos gruesos superficiales<br />
Cochán<br />
Vitran<strong>de</strong>pt mol ico<br />
La<strong>de</strong>ra<br />
Fuertemente inclinada ( 20 % )<br />
3,400 m.s.n.m.<br />
Húmedo y semi frib<br />
1000- 1500 mm.<br />
6- 10 0 C<br />
bmh-MT ( bosque muy húmedo - Montano Tropical )<br />
Volcánico<br />
Walte<br />
No hay<br />
Horizonte<br />
Prof/cm<br />
Descripción<br />
Al 0-30 Franco arenoso, <strong>de</strong> color pardo grisáceo muy oscuro (10 YR 3/20<br />
en húmedo. Estructura granu<strong>la</strong>r media, mo<strong>de</strong>rada; <strong>de</strong> consisten<br />
cia friable en húmedo. El pH es 6.1 y 5.<strong>45</strong> el contenido <strong>de</strong> ma<br />
teria orgánica'. LFmite <strong>de</strong> horizonte gradual al<br />
(B) 30 - 60 Franco arenoso, <strong>de</strong> color pardo oscuro ( 7.5 YR 3/2 ) en húmedo.<br />
Estructura en bloques subangu <strong>la</strong> res medios, débiles;<strong>de</strong> eon<br />
sistencia friable en húmedo. El pH es 6,3 y 2.55% el contenido<br />
<strong>de</strong> materia orgánica. Limite <strong>de</strong> horizonte gradual al<br />
Cl 60-85 Franco, <strong>de</strong> color pardo a pardo oscuro (7.5 YR 4/4 ) en húmedo.<br />
Masivo, <strong>de</strong> consistencia firme en húmedo. El pH es 6.6y<br />
1.24% el contenido <strong>de</strong> materia orgánica. LFmite <strong>de</strong>l horizon -<br />
te gradual al<br />
C2 85 +130 Franco arcilloso, <strong>de</strong> color pardo a pardo oscuro ( 7.5 YR 4/4 )<br />
en húmedo. Masivo, <strong>de</strong> consistencia firme en húmedo. El pH<br />
es 6.7 y 1.17 el contenido <strong>de</strong> materia orgánica.<br />
UN PERFIL DEL SUELO VERTISOL CRÓMICO<br />
Zona<br />
Corre<strong>la</strong>ción con el<br />
Soil Taxonomy ( 1973 )<br />
Fisiograffa<br />
Pendiente<br />
Altitud<br />
Clima<br />
Precipitación<br />
Asunción<br />
Cromustert éntico<br />
La<strong>de</strong>ra<br />
Mo<strong>de</strong>radamente empinada a empinada ( 35 %<br />
2, 200 m.s.n.m.<br />
Sub húmedo y temp<strong>la</strong>do<br />
900- 1100 mm.
ANEXO IV - SUELOS Pág. 63<br />
Temperatura<br />
Zona <strong>de</strong> vida<br />
Material madre<br />
Vegetación<br />
Fragmentos gruesos superficiales<br />
12- 17 0 C<br />
bh - MBT (bosque húmedo - Montano Bajo Tropical )<br />
Cuarcitas<br />
Bisnaga, penca, gramalote, carrizo<br />
No hay<br />
Horizonte<br />
Pr of/cm<br />
Descripción<br />
Al<br />
Cl<br />
C2<br />
C3<br />
0-15 Arcil<strong>la</strong>, <strong>de</strong> color pardo oscuro ( 10 YR 3/3 ) en húmedo. Estructura<br />
granu<strong>la</strong>r media, mo<strong>de</strong>rada; consistencia dura en seco. El pH<br />
es 7.2 y 3.10 el contenido <strong>de</strong> materia orgánica. Presencia <strong>de</strong> ra<br />
¡aduras <strong>de</strong> 1-2 cm. <strong>de</strong> ancho. Limite <strong>de</strong> horizonte c<strong>la</strong>ro al<br />
15-35 Arcil<strong>la</strong>, <strong>de</strong> color pardo amarillento ( 10 YR 5/4 ) en húmedo. Es<br />
tructura en bloques sub angu<strong>la</strong>res medios, mo<strong>de</strong>rados; <strong>de</strong> consis -<br />
tencia dura en seco. El pH es 7.9 y 0.76% el contenido <strong>de</strong> materia<br />
orgánica. Presencia <strong>de</strong> rajaduras <strong>de</strong> 1-2 cm„ <strong>de</strong> ancho. LF<br />
mi te <strong>de</strong> horizonte difuso al<br />
35 - Ó5 Arcil<strong>la</strong>, <strong>de</strong> color pardo amarillento ( 10 YR 5/4 ) en húmedo. Ma<br />
sivo, <strong>de</strong> consistencia dura en seco» El pH es 7.8 y 0,48% el con<br />
tenido <strong>de</strong> materia orgánica„ Limite <strong>de</strong> horizonte difuso al<br />
65 -120 Arcil<strong>la</strong>, <strong>de</strong> color pardo amarillento ( 10 YR 5/4 ) en húmedo. Ma<br />
sivo, <strong>de</strong> consistencia muy friable en húmedo. El pH es 7.8 y<br />
0.14% el contenido <strong>de</strong> materia orgánica.<br />
UN PERFIL DEL SUELO XEROSOL CALCICO<br />
Zona<br />
Corre<strong>la</strong>ción con el<br />
Soil Taxonomy ( 1973 )<br />
Fisiografía<br />
Pendiente<br />
Altitud<br />
Clima<br />
Precipitación<br />
Temperatura<br />
Zona <strong>de</strong> vida<br />
Material madre<br />
Vegetación<br />
Fragmentos gruesos superficiales<br />
ChMete hacia Contumazá<br />
Calciortid típico<br />
La<strong>de</strong>ra<br />
Ligeramente inclinada a inclinada<br />
930 m.s.n.m.<br />
Seco y Semicálido<br />
125-250 mm.<br />
17- 24 0 C<br />
md-PMT (matorral <strong>de</strong>sértico- Pre Montano Tropical)<br />
aluvial - coluvial<br />
Maíz, ma<strong>la</strong> hierba<br />
Grava y guijarros <strong>de</strong> 3 - 10 cm. <strong>de</strong> diámetro en un<br />
60%
Pág, 64 ZONA NORTE DE CAJAMARCA<br />
Horizonte<br />
Prof/cm.<br />
Descripción<br />
Ap 0-20<br />
Franco, <strong>de</strong> color pardo a pardo oscuro ( 10 YR 4/3 ) en húmedo .<br />
Estructura miga¡osa, <strong>de</strong> consistencia firme en húmedo y duro en<br />
seco. El pH es 7.6 y 1.17% el contenido <strong>de</strong> materia orgánica.<br />
Presencia <strong>de</strong> abundantes carbonatos libres en <strong>la</strong> masa. Presencia<br />
<strong>de</strong> gravil<strong>la</strong> sub angu<strong>la</strong>r <strong>de</strong> 1 a 2 cm. <strong>de</strong> diámetro en un 40%. Lf<br />
mite <strong>de</strong> horizonte c<strong>la</strong>ro al<br />
Bca<br />
20- 50<br />
Franco limoso, <strong>de</strong> color pardo a pardo oscuro ( 7.5 YR 4/2 ) en<br />
húmedo. Estructura en bloques sub angu<strong>la</strong>res, medios, mo<strong>de</strong>ra —<br />
dos; <strong>de</strong> consistencia friable en húmedo. El pH es 7.9 y 0.69%el<br />
contenido <strong>de</strong> materia orgánica. Presencia <strong>de</strong> abundantes corbona<br />
tos libres en <strong>la</strong> masa. Límite <strong>de</strong> horizonte c<strong>la</strong>ro al<br />
+ 50 Esquelético, presencia <strong>de</strong> grava y guijarros sub angu<strong>la</strong>res <strong>de</strong> hasta<br />
10 cm. <strong>de</strong> diámetro en un 90%<br />
UN PERFIL DEL SUELO XEROSOL HAPLICO<br />
Zona<br />
Corre<strong>la</strong>ción con el<br />
Soil Taxonomy ( 1973 )<br />
Fisiografía<br />
Pendiente<br />
Altitud<br />
Clima<br />
Precipitación<br />
Temperatura<br />
Zona <strong>de</strong> vida<br />
Matorral madre<br />
Vegetación<br />
Fragmentos gruesos superficiales<br />
Chilete a Contumazá<br />
Cambortid ustólico<br />
Terraza media<br />
Fuertemente inclinada ( 18 % )<br />
940 m. s. n. m.<br />
Seco y semicálido<br />
125- 250 mm.<br />
17 - 24° C<br />
md - PMT ( Matorral <strong>de</strong>sértico - Pre Montano Tropical)<br />
Calizas<br />
Pastos, ma<strong>la</strong>s hierbas ( pega - pega, cadillo )<br />
No hay<br />
Horizonte<br />
Prof/cm<br />
D e scrip c i ó n<br />
Al<br />
AB<br />
0-20 Franco arcilloso, <strong>de</strong> color pardo grisáceo oscuro ( 10 YR 4/2 ) en<br />
húmedo. Estructura miga¡osa, <strong>de</strong> consistencia friable en húmedo.<br />
El pH es 7.7 y 2.76% el contenido <strong>de</strong> materia orgánica. Presencia<br />
<strong>de</strong> abundantes carbonatos libres en <strong>la</strong> masa con reacción fuer<br />
te al HCI diluido. Presencia <strong>de</strong> gravil<strong>la</strong> sub angu<strong>la</strong>r <strong>de</strong> 1 - 3cm.<br />
<strong>de</strong> diámetro, en un 30%. Limite <strong>de</strong> horizonte difuso al<br />
20 - 60 Franco arcilloso, <strong>de</strong> color pardo grisáceo oscuro ( 10 YR 4/2 ) en<br />
húmedo. Estructura en bloques sub angu<strong>la</strong>res finos, débiles; <strong>de</strong><br />
consistencia friable en húmedo. El pH es 8.0 y 1.38% el contenido<br />
<strong>de</strong> materia orgánica. Presencia <strong>de</strong> abundantes carbonatos lí
ANEXO IV - SUELOS Pág. 65<br />
bres en <strong>la</strong> masa, con reacción fuerte al HCI diluTdo. Presencia <strong>de</strong><br />
gravil<strong>la</strong> sub angu<strong>la</strong>r <strong>de</strong> 1-3 cm. <strong>de</strong> diámetro, en un 20%. Límite<br />
<strong>de</strong> horizonte c<strong>la</strong>ro al<br />
(B) 60 + 120 Franco arcilloso, <strong>de</strong> color pardo a pardo oscuro ( 10 YR 4/3 )enhú<br />
medo. Estructura en bloques sub angu<strong>la</strong>res medios, mo<strong>de</strong>rados; <strong>de</strong><br />
consistencia friable en húmedo'. El pH es 8.0 y 1.<strong>03</strong>% el contenido<br />
<strong>de</strong> materia orgánica. Abundantes carbonatas libres en <strong>la</strong> masa,<br />
con reacción fuerte al HCI diluTdo. Presencia <strong>de</strong> gravil<strong>la</strong> sub angu<br />
<strong>la</strong>r <strong>de</strong> 1 - 3 cm. <strong>de</strong> diámetro, en un 10%<br />
UN PERFIL DEL SUELO KASTANOZEM HAPILICO<br />
Zona<br />
Corre<strong>la</strong>ción con el<br />
Soil Taxonomy ( 1973 )<br />
Fisiograffa<br />
Pendiente<br />
Altitud<br />
Clima<br />
Precipitación<br />
Temperatura<br />
Zona <strong>de</strong> vida<br />
Material madre<br />
Vegetación<br />
Fragmentos gruesos superficiales<br />
El Tingo ( Cochabamba )<br />
Haplustol típico<br />
La<strong>de</strong>ra<br />
Fuertemente inclinada ( 20% )<br />
2, 000 m.s.n.m.<br />
Sub húmedo y temp<strong>la</strong>do<br />
500 - 800 mm.<br />
17- 20 0 C<br />
bs PMT - (bosque seco-Pre Montano Tropical-Trahsicio-<br />
Calizas y lutitas calcáreas ' nal )<br />
Arveja, maTz<br />
Ocasionales<br />
Horizonte<br />
Prof/cm.<br />
Descr i pc i ón<br />
Al<br />
0-20<br />
Franco arcilloso, <strong>de</strong> color pardo oscuro ( 10 YR 3/3 ) en húmedo, es<br />
estructura granu<strong>la</strong>r fina, débil; <strong>de</strong> consistencia firme en húmedo.<br />
El pH es 7.2 y 3.79% <strong>de</strong>l contenido <strong>de</strong> materia orgánica. Límite<br />
<strong>de</strong> horizonte gradual al<br />
(B)2<br />
B3<br />
20- 35<br />
35- 55<br />
Franco arcilloso, <strong>de</strong> color pardo grisáceo muy oscuro ( 10 YR 3/2 )<br />
en húmedo. Estructura en bloques subangu<strong>la</strong>res medios, mo<strong>de</strong>rados<br />
y <strong>de</strong> consistencia firme en húmedo. El pH es 7.6 y 2.62% el contenido<br />
<strong>de</strong> materia orgánica. Presencia <strong>de</strong> carbonates pulverulento<br />
y suave. Límite <strong>de</strong> horizonte c<strong>la</strong>ro al<br />
Franco arcillo arenoso, <strong>de</strong> color pardo grisáceo (10YR 5/2) en húmedo»<br />
Estructura en bloques subangu<strong>la</strong>res medios, mo<strong>de</strong>rados y <strong>de</strong><br />
consistencia firme en húmedo. El pH es 7.7 y 1.<strong>03</strong> el contenido<br />
<strong>de</strong> materia orgánica. Presencia <strong>de</strong> carbonates pulverulento y suaves.<br />
LTmite <strong>de</strong> horizonte gradual al
Pág. 66 ZONA NORTE DECAJAMARCA<br />
C 1 , 55 - 85 Franco arcilloso, <strong>de</strong> color pardo amarillento (10 YR 5/8 ) en hó<br />
medo. Masivo, <strong>de</strong> consistencia firme en húmedo. El pH es 7,9<br />
y 1.<strong>03</strong>% el contenido <strong>de</strong> materia orgánica. Presencia <strong>de</strong> carbonates<br />
pulverulento y suaves. Límite <strong>de</strong> horizonte c<strong>la</strong>ro al<br />
C2 85 -120 Franco arcilloso, <strong>de</strong> color gris parduzco c<strong>la</strong>ro ( 10 YR 6/2) en hú<br />
medo. Masivo, <strong>de</strong> consistencia muy firme en húmedo. El pH es<br />
8 o 0 y 0.76% el contenido <strong>de</strong> materia orgánica. Presencia <strong>de</strong> car<br />
bona tos pulverulento y suaves.<br />
UN PERFIL DEL SUELO KASTANOZEM CALCICO<br />
Zona<br />
Corre<strong>la</strong>ción con el<br />
Soil Taxonomy ( 1973 )<br />
Fisiografía<br />
Pendiente<br />
Altitud<br />
Clima<br />
Precipitación<br />
Temperatura<br />
Zona <strong>de</strong> vida<br />
Material madre<br />
Vegetación<br />
Fragmentos gruesos superficiales<br />
Cerca a Bambamarca<br />
Calciustol típico<br />
Terraza media<br />
Ligeramente inclinada a inclinada ( 12 % )<br />
2,640 rms.n.m.<br />
Sub húmedo y Semifríb<br />
1000- 1200 mm.<br />
12- 15 0 C<br />
bh - MBT ( bosque húmedo - Montano Bajo Tropical )<br />
Calizas<br />
Mafz, cebada, penca, carrizo, cadillo<br />
No hay<br />
Horizonte<br />
Ap<br />
Bca<br />
Cl<br />
Prof/cm<br />
0-20<br />
20 - <strong>45</strong>A<br />
<strong>45</strong>- 80<br />
Descripción<br />
Arcil<strong>la</strong>, <strong>de</strong> color pardo a pardo oscuro ( 10 YR 3„5/3 ) en húmedo,<br />
estructura granu<strong>la</strong>r media, débil; <strong>de</strong> consistencia dura en se<br />
co„ El pH es 6.8 y 2.62% el contenido <strong>de</strong> materia orgánica,, U<br />
mite <strong>de</strong> horizonte c<strong>la</strong>ro ai<br />
Arcil<strong>la</strong>, <strong>de</strong> color amarillo pálido ( 2.5 Y 7/4 ) en húmedo. Es -<br />
tructura en bloques sub angu<strong>la</strong>res medios, débiles; <strong>de</strong> consistencía<br />
firme en húmedo. El pH es 7.2 y 1.24% el contenido <strong>de</strong> ma<br />
teria orgánica. Muy alto contenido <strong>de</strong> carbonates libres en <strong>la</strong><br />
masa» Limite <strong>de</strong> horizonte gradual al<br />
Arcil<strong>la</strong>, <strong>de</strong> color pardo amarillento c<strong>la</strong>ro ( 2.5 Y 6/4 ) en hume<br />
do. Estructura en bloques sub angu<strong>la</strong>res medios, débiles; <strong>de</strong> co"ñ<br />
sistencia firme en húmedo. El pH es 7.3 y 0.83% el contenido"<br />
<strong>de</strong> materia orgánica. Limite <strong>de</strong> horizonte gradual al<br />
C2ca 80 +135 Arcil<strong>la</strong>, <strong>de</strong> color apardo amarillento c<strong>la</strong>ro ( 2.5 Y 6/4 ) en hú -
ANEXO IV -SUELOS Pág. 67<br />
medo. Masivo, <strong>de</strong> consistencia firme en húmedo. El pH es 7„2<br />
y 0.83% <strong>de</strong> materia orgánica» Muy alto contenido <strong>de</strong> carbonatas<br />
libres en <strong>la</strong> masa.<br />
UN PERFIL DEL SUELO PHAEOZEM HAPLICO<br />
Zona<br />
Corre<strong>la</strong>ción con el<br />
Soil Taxonomy ( 1973 )<br />
Fisiograffa<br />
Pendiente<br />
Altitud<br />
Clima<br />
Precipitación<br />
Temperatura<br />
Zona <strong>de</strong> vida<br />
Material madre<br />
Vegetación<br />
Fragmentos gruesos superficiales<br />
Cutervo<br />
Haplustol<br />
La<strong>de</strong>ra<br />
Ligeramente inclinada a inclinada<br />
2,540 m. s. n o m.<br />
Húmedo y Semifrío<br />
800 - 1000 mm.<br />
12- 14° C<br />
bh - MBT (bosque húmedo - Montano Bajo Tropical )<br />
Aluvio - Coluvie ( I u ti tas no calcáreas )<br />
Papa, eucalipto, maguey<br />
No hay<br />
Horizonte<br />
Prof/cm<br />
Descripción<br />
Ap 0-20 Franco arcilloso, <strong>de</strong> color pardo roiízo oscuro ( 5 YR 3/3 ) en húmedo.<br />
Estructura en bloques sub angu<strong>la</strong>res, medios, débiles; con<br />
sistencia friable en húmedo. El pH es 6,0 y 5.65% el contenido<br />
<strong>de</strong> materia orgánica. Limite <strong>de</strong> horizonte c<strong>la</strong>ro al<br />
AB <strong>45</strong> - 65 Franco arcilloso, <strong>de</strong> color pardo ropzo oscuro ( 5 YR 2.5/2 )en hú<br />
medo. Estructura granu<strong>la</strong>r, fina,déb¡l; consistencia muy friable en<br />
húmedo» El pH es 5.7 y 3,,8% el contenido <strong>de</strong> materia orgánica.<br />
Límite <strong>de</strong> horizonte abrupto al<br />
(B2) 65 - 90 Arcil<strong>la</strong>, <strong>de</strong> color pardo fuerte (7.5 YR 5/6) en húmedo. Estructura<br />
en bloques sub angu<strong>la</strong>res medios,mo<strong>de</strong>rados; consistencia friable<br />
en húmedo. El pH es 5.6 y 2.27 % el contenido <strong>de</strong> materia or<br />
gánicao Límite <strong>de</strong> horizonte gradual al<br />
C 90 - 130 Arcil<strong>la</strong>; <strong>de</strong> color amarillo parduzco ( 10 YR 6/8 ) en húmedo. Ma<br />
sivo; consistencia friable en húmedo. El pH es 5.6 y <strong>la</strong> materia<br />
orgánica es 0.48%.<br />
UN PERFIL DEL SUELO PHAEOZEM CALCARICO<br />
Zona<br />
Corre<strong>la</strong>ción con el<br />
Soil Taxonomy ( 1973 )<br />
Fisiografía<br />
San Pablo<br />
Haplustol<br />
La<strong>de</strong>ra suave
Pág. 68<br />
ZONA NORTE DE CAJAMARCA<br />
Pendiente<br />
Altitud<br />
Clima<br />
Precipitación<br />
Temperatura<br />
Zona <strong>de</strong> vida<br />
Material madre<br />
Vegetación<br />
Fragmentos gruesos superficiales<br />
Fuertemente inclinada<br />
1, 740 m.s. n. m.<br />
Sub húmedo y temp<strong>la</strong>do<br />
500- 800 mm.<br />
17- 20° C<br />
bs - PMT ( bosque seco - Pre Montano Tropical )<br />
Coluvial ( cuarzítas y calizas )<br />
Mutuy, arbustos<br />
No hay<br />
Horizonte<br />
Prof/cm.<br />
D e scnpcion<br />
Al 0-25<br />
Franco arenoso, <strong>de</strong> color pardo oscuro ( 7.5 YR 3/2 ) en húmedo.<br />
Estructura granu<strong>la</strong>r media, mo<strong>de</strong>rada; consistencia friable en hú<br />
medo. El pH es 7.6 y 2.00% el contenido <strong>de</strong> materia orgánica.<br />
Contenido medio <strong>de</strong> carbonatas libres en <strong>la</strong> masa. Limite <strong>de</strong> horizonte<br />
gradual a!<br />
25 - 70 Arcil<strong>la</strong>, <strong>de</strong> color pardo rojizo oscuro ( 5 YR 3/3 ) en húmedo. Es<br />
tructura en bloques sub angu<strong>la</strong>res, medios , débiles; consistencia<br />
firme en húmedo» Ei pH es 7.8 y 0.83%el contenido <strong>de</strong> materia<br />
orgánica. Alto contenido <strong>de</strong> carbonatos libres en <strong>la</strong> masa. Limi<br />
te <strong>de</strong> horizonte gradual al<br />
BC<br />
70 - 110 Arcil<strong>la</strong>, <strong>de</strong> color pardo a pardo oscuro ( 10 YR 4/3 ) en húmedo.<br />
Masivo, consistencia muy firme. El pH es 8.1 y 0.76% el contenido<br />
<strong>de</strong> materia orgánica. Contenido medio <strong>de</strong> carbonatos libres<br />
en <strong>la</strong> masa.<br />
UN PERFIL DEL SUELO PHAEOZEM LUVICO<br />
Zona<br />
Corre<strong>la</strong>ción con el<br />
Soil Taxonomy ( 1973 )<br />
Fisiografía<br />
Pendiente<br />
Altitud<br />
Clima<br />
Precipitación<br />
Temperatura<br />
Zona <strong>de</strong> vida<br />
Material madre<br />
Vegetación<br />
Fragmentos gruesos superficiales<br />
Cutervo<br />
Argiustol<br />
La<strong>de</strong>ra<br />
Empinada ( 40% )<br />
2,470 m.s.n.m.<br />
Húmedo y Semifríb<br />
928 mm.<br />
13.7 0 C<br />
bh -MBT ( bosque húmedo - Montano Bajo Tropical )<br />
Aluvio - coluvie ( areniscas )<br />
Maíz, centeno, papa, nudillo, berbena, pino<br />
No hay
ANEXO IV -SUELOS Pág. 69<br />
Horizonte<br />
Al<br />
Prof/ cm<br />
0-20<br />
Descripción<br />
Franco arcilloso; <strong>de</strong> color gris muy oscuro ( 10 YR 3/1 ) en húmedo»<br />
Estructura granu<strong>la</strong>r media, débil; consistencia friable en húmedo,<br />
El pH es 6,1 y 5o<strong>03</strong>% el contenido <strong>de</strong> materia orgánica<br />
con 10% <strong>de</strong> grava <strong>de</strong> 1 a 2 cm., mezc<strong>la</strong>da con gravilloo Limite<br />
<strong>de</strong> horizonte difuso al<br />
A3 20 - 60 Franco arcilloso; <strong>de</strong> color negro ( 10 YR 2.5/1 ) en húmedo. Estructura<br />
en bloques sub angu<strong>la</strong>res medios, débiles; consistencia<br />
friable en húmedo. El pH es 6.3 y el contenido <strong>de</strong> materia orgánica<br />
con 5% <strong>de</strong> grava <strong>de</strong> 1 a 5 cm., mezc<strong>la</strong>da con gravil<strong>la</strong>. Li"<br />
mite <strong>de</strong> horizonte difuso al<br />
B2t 60 - 95 Franco arcilloso a arcilloso; <strong>de</strong> color negro ( 7.5 YR 2.5/0)enhú<br />
medo. Estructura en bloques sub angu<strong>la</strong>res, medios mo<strong>de</strong>rados;<br />
consistencia firme en húmedo» El pH es 6.3 y 3.00% el contenido<br />
<strong>de</strong> materia orgánica, con 15% <strong>de</strong> grava a 1 a 3 cm., mezc<strong>la</strong>do<br />
con gravil<strong>la</strong>. Limite <strong>de</strong> horizonte difuso al<br />
C 95-130 Franco arcilloso <strong>de</strong> color gris muy oscuro ( 10 YR 3/1 ) en húmedo;<br />
masivo; consistencia firme en húmedo. El pH es 6.4 y 2»63>ó<br />
el contenido <strong>de</strong> materia orgánica. Con 40% <strong>de</strong> grava <strong>de</strong> 1 aScm,<br />
mezc<strong>la</strong>do con gravil<strong>la</strong>.<br />
UN PERFIL DEL SUELO PHAEOZEM HAPLICO<br />
Zona<br />
Corre<strong>la</strong>ción con el<br />
Soil Taxonomy ( 1973 )<br />
Fisiog rafia<br />
Pendiente<br />
Altitud<br />
Clima<br />
Precipitación<br />
Temperatura<br />
Zona <strong>de</strong> vida<br />
Material Madre<br />
Vegetación<br />
Fragmentos gruesos superficiales<br />
Hualgayoc<br />
Hapludol típico<br />
La<strong>de</strong>ra<br />
Mo<strong>de</strong>radamente empinada a empinada ( <strong>45</strong>% )<br />
3, 200 m.s.n.m.<br />
Húmedo y frib<br />
1000- 2000 mm.<br />
8- 12 0 C<br />
bmh - MT (bosque muy húmedo - Montano Tropical )<br />
Coluvial ( Cuarcitas y Lutitas )<br />
Chilca, grama, eucalipto, zarza<br />
No hay<br />
Horizonte<br />
Prof/cm.<br />
Pese ri pe i ón<br />
Al 0-24 Franco arcilloso, <strong>de</strong> color pardo oscuro (7.5 YR 3/2 ) en húmedo.<br />
Estructura granu<strong>la</strong>jr, media, débil; consistencia friable en húmedo.<br />
El pH es 6.6 y 3.79% el contenido <strong>de</strong> materia orgánica. Límite<br />
<strong>de</strong> horizonte gradual al
Pág, 70 ZONA NORTE DE CAJAMARCA<br />
(B) 25 - 80 Franco arcilloso, <strong>de</strong> color pardo oscuro ( 7.5 YR 3/2 ) en húmedo.<br />
Estructura en bloques subangu<strong>la</strong>res, finos, débiles; consisten<br />
cia friable en húmedo. El pH es 7.2 y 2.14% el contenido <strong>de</strong> ma<br />
tena orgánica. Presencia <strong>de</strong> gravil<strong>la</strong> subangu<strong>la</strong>r <strong>de</strong> 1 cm. <strong>de</strong>diá<br />
metro en un 5%. Limite <strong>de</strong> horizonte c<strong>la</strong>ro al<br />
C 80-120 Arcil<strong>la</strong>, <strong>de</strong> color amarillo parduzco ( 10 YR 6/6 ) en húmedo.Ma<br />
sivo, <strong>de</strong> consistencia firme en húmedo. El pH es 7.5 y 0.21% el<br />
contenido <strong>de</strong> materia orgánica.<br />
UN PERFIL DEL SUELO CAMBISOL EUTRICO<br />
Zona<br />
Corre<strong>la</strong>ción con el<br />
Soil Taxonomy ( 1973 )<br />
Fisiografia<br />
Pendiente<br />
Altitud<br />
Clima<br />
Precipitación<br />
Temperatura<br />
Zona <strong>de</strong> vida<br />
Material madre<br />
Vegetación<br />
Fragmentos gruesos superficiales<br />
Cachacara<br />
Eutropept tipico<br />
La<strong>de</strong>ra<br />
Mo<strong>de</strong>radamente empinada a empinada (30% )<br />
2,565 m.s.n.m.<br />
Húmedo y Semifrib<br />
800- 100 mm.<br />
13- 15 0 C<br />
bh - MBT ( bosque húmedo - Montano Bajo Tropical )<br />
Lutitas, no calcáreas<br />
pastos, eucaliptos, ma<strong>la</strong>s hierbas<br />
No hay<br />
Horizonte<br />
Prof/cm<br />
Descripción<br />
Al 0-30<br />
Arcil<strong>la</strong>, <strong>de</strong> color pardo amarillento ( 10 YR 5/6 ) en húmedo, es<br />
tructura granu<strong>la</strong>r fina, débil; <strong>de</strong> consistencia friable en húmedo .<br />
El pH es 5.6 y 3.10% el contenido <strong>de</strong> materia orgánica. Limite<br />
<strong>de</strong> horizonte c<strong>la</strong>ro al<br />
(B) 30 - 40 Arcil<strong>la</strong>, <strong>de</strong> colores pardo pálido ( 10 YR 6/3 ) y amarillo parduzco<br />
( 10 YR 6/8 ) en húmedo. Estructura en bloques sub angu<strong>la</strong>res,<br />
medio^débiles; <strong>de</strong> consistencia firme en húmedo. El pH es 5.5 y<br />
2.55% el contenido <strong>de</strong> materia orgánica Limite <strong>de</strong> horizonte<br />
gradual al<br />
Cl 40 - 80 Franco arcilloso, <strong>de</strong> color amarillo ( 10 YR 7/8 ) en húmedo. Ma<br />
sivo, <strong>de</strong> consistencia firme en húmedo. El pH es 5.4 y 0.76%el<br />
contenido <strong>de</strong> materia orgánica. Limite <strong>de</strong> horizonte difuso al<br />
C2 80 + 140 Arcil<strong>la</strong>, <strong>de</strong> color pardo amarillento ( 10 YR 5/6 ) en húmedo. Ma<br />
sivo, <strong>de</strong> consistencia friable en húmedo El pH es 5.1 y 0.76 %<br />
el contenido <strong>de</strong> materia orgánica.
ANEXO IV - SUELOS Pág- 71<br />
UN PERFIL DEL SUELO CAMBISOL GLEICO<br />
Zona<br />
Corre<strong>la</strong>ción con el<br />
Soil Taxonomy ( 1973 )<br />
Fisiografía<br />
Pendiente<br />
Altitud<br />
Clima<br />
Precipitación<br />
Temperatura<br />
Zona <strong>de</strong> vida<br />
Material madre<br />
Vegetación<br />
Fragmentos gruesos superficiales<br />
Al <strong>la</strong>nga<br />
Eutrocrept ácuico<br />
La<strong>de</strong>ra suave<br />
Fuertemente inclinada ( 24 % )<br />
2, 560 m.s.n.m.<br />
Húmedo y semi frío<br />
800- 1200 mm.<br />
13- 15 0 C<br />
bh - MBT ( bosque húmedo - Montano Bajo Tropical )<br />
Aluvio - Coluvio<br />
Arveja, maíz, pastos<br />
20% grava sub angu<strong>la</strong>r <strong>de</strong> 3-5 cm. <strong>de</strong> diámetro<br />
Horizonte<br />
Al<br />
A3<br />
(B)<br />
Prof/cm,<br />
0-15<br />
15- 30<br />
30- 90<br />
Descripción<br />
Arcil<strong>la</strong>, <strong>de</strong> color pardo a pardo oscuro ( 10 YR 4/3 ), en húmedo<br />
Masivo, <strong>de</strong> consistencia friable en húmedo, el pH es 6.4 y3.24%<br />
el contenido <strong>de</strong> materia orgánica. Límite <strong>de</strong> horizonte difuso al<br />
Arcil<strong>la</strong>, <strong>de</strong> color pardo a pardo oscuro ( 10 YR 4/3 ) en húmedo, ma<br />
sivo, <strong>de</strong> consistencia firme en húmedo. El pH es 6.2 y 2.83% el<br />
contenido <strong>de</strong> materia orgánica. El límite <strong>de</strong> horizonte es c<strong>la</strong>ro al<br />
Arcil<strong>la</strong>, <strong>de</strong> color gris ( 10 YR 5/1 ) en húmedo, estructura en bloques<br />
sub angu<strong>la</strong>res medios débiles, <strong>de</strong> consistencia firme en húmedo.<br />
El pH es 6.4 y 2.89% el contenido <strong>de</strong> materia orgánica.E! lí<br />
míte <strong>de</strong> horizonte c<strong>la</strong>ro al<br />
Cg 90 +130 Arcil<strong>la</strong>, <strong>de</strong> color gris ( 10 YR 5/1 ) en húmedo con moteaduras <strong>de</strong><br />
color rojo amarillento ( 5YR 4/6 ) en húmedo. Masivo, <strong>de</strong> consistencia<br />
firme en húmedo.El pH'es 6.3 y"l;24% el contenido d? materia<br />
orgánica „<br />
UN PERFIL DEL SUELO CAMBISOL HÚMICO<br />
Zona<br />
Corre<strong>la</strong>ción con el<br />
Soil Taxonomy ( 1973 )<br />
Fisiografía<br />
Pendiente<br />
Altitud<br />
Clima<br />
Precipitación<br />
Conchan<br />
Haplumbrept típico<br />
La<strong>de</strong>ra<br />
Mo<strong>de</strong>radamente empinada a empinada ( 30% )<br />
2, 850 m.s.n.m.<br />
Húmedo y Temp<strong>la</strong>do<br />
966 mm.
Pag. 72 ZONA NORTE DE CAJAMARCA<br />
Temperatura<br />
Zona <strong>de</strong> vida<br />
Material madre<br />
Vegetación<br />
Fragmentos gruesos superficiales<br />
15.2 0 C<br />
bs - MBT ( bosque seco - Montano Bajo Tropical )<br />
Lutitas no calcáreas<br />
Chicoria, Roble, Iguerón<br />
No hay<br />
Horizonte<br />
Prof/cm.<br />
Des c r i peí ón<br />
Al 0-25<br />
Arcil<strong>la</strong>, <strong>de</strong> color pardo oscuro ( 10 YR 3/3 ) en húmedo, estruc -<br />
tura granu<strong>la</strong>r fina débil; <strong>de</strong> consistencia friable en húmedo. El<br />
pH es 5.4 y 5.52% el contenido <strong>de</strong> materia orgánica. Limite <strong>de</strong><br />
horizonte c<strong>la</strong>ro al<br />
(B) 25 - 80 Arcil<strong>la</strong>, <strong>de</strong> color pardo amarillento ( 10 YR 5/6 ) en húmedo, es<br />
tructura en bloques subangu<strong>la</strong>res medios débiles, <strong>de</strong> consistencia<br />
firme en húmedo. El pH es 5.2 y 1.93% el contenido <strong>de</strong> materia<br />
orgánica. Limite <strong>de</strong> horizonte abrupto al<br />
C 80 +130 Franco arenoso, <strong>de</strong> color gris muy oscuro ( 10 YR 3/1 ) en húmedo,más¡vo,<br />
<strong>de</strong> consistencia firme en húmedo. El pH es 5.1 y5.57<br />
% el contenido <strong>de</strong> materia orgánica.<br />
UN PERFIL DEL SUELO PARAMOSOL EUTRICO<br />
Zona<br />
Corre<strong>la</strong>ción con el<br />
Soil Taxonomy ( 1973 )<br />
Fisiografía<br />
Pendiente<br />
Altitud<br />
Clima<br />
Precipitación<br />
Temperatura<br />
Zona <strong>de</strong> vida<br />
Material madre<br />
Vegetación<br />
Fragmentos gruesos superficiales<br />
Choccl<strong>la</strong><br />
Criumbrept tFpico<br />
La<strong>de</strong>ra suave<br />
Ligeramente inclinada a inclinada ( 8% )<br />
3, 700 m.s.n.m.<br />
Muy húmedo y frfo<br />
600- 1000 mm.<br />
4- 6 0 C<br />
Pmh - SAT (páramo muy húmedo - Sub Alpino Tropi<br />
cal )<br />
Fluvio - g<strong>la</strong>cial<br />
Walte ( pastos naturales )<br />
No hay<br />
Horizonte<br />
Prof/cm.<br />
Descripción<br />
Al 0-35 Franco, <strong>de</strong> color pardo ropzo oscuro ( 5 YR 2.5/2 ) en húmedo .<br />
Estructura granu<strong>la</strong>r fina, mo<strong>de</strong>rada. Consistencia friable en hume<br />
do. El pH es 5.9 y 10.34% el contenido <strong>de</strong> materia orgánica.Lf<br />
mite <strong>de</strong> horizonte difuso al<br />
(B)2 55 -110 Franco arcillo arenoso, <strong>de</strong> color amarillo parduzco ( 10 YR 6/6 )
ANEXO IV -SUELOS Pág, 73<br />
en húmedo masivo, <strong>de</strong> consistencia firme en húmedoo El pHesó.4<br />
y 0.48% el contenido <strong>de</strong> materia orgánica. Hay presencia <strong>de</strong> grava<br />
subangu<strong>la</strong>r <strong>de</strong> 1 a 5 cm. <strong>de</strong> diámetro en un 30%.<br />
UN PERFIL DEL SUELO PARAMOSOL DISTRICO<br />
Zona<br />
Corre<strong>la</strong>ción con el<br />
Soil Taxonomy ( 1973 )<br />
Fisiografía<br />
Topografía<br />
Altitud<br />
Clima<br />
Precipitación<br />
Temperatura<br />
Zona <strong>de</strong> vida<br />
Material madre<br />
Vegetación<br />
Fragmentos gruesos superficiales<br />
Porcón, Huacrarvero<br />
Criumbrept típico<br />
La<strong>de</strong>ra<br />
Mo<strong>de</strong>radamente empinado ( 25 % )<br />
3, 800 m„s.n.m„<br />
Muy húmedo y frío<br />
600 - 1000 mm.<br />
4- 6 o C<br />
pmh - SAT ( páramo muy húmedo - Subalpino Tropical)<br />
Arenisca<br />
Pastos naturales<br />
Ocasional<br />
Horizonte<br />
All<br />
Prof/ cm<br />
0<br />
Descripción<br />
Franco arenoso, <strong>de</strong> color negro ( 5 YR 2.5/1 ) en húmedo. Sin estructura,<br />
consistencia muy friable en húmedo. El pH es 4.6 y 12.5<br />
% el contenido <strong>de</strong> materia orgánica. Límite <strong>de</strong> horizonte difuso<br />
A12 5-25 Franco arenoso, <strong>de</strong> color negro ( 5 YR 2.5/1 ) en húmedo. Estructura<br />
masiva que se rompe en granu<strong>la</strong>r muy fino, débil. De consis -<br />
tencia muy friable en húmedo. El pH 4.5 y 8.9% el contenido <strong>de</strong><br />
materia orgánica. Límite <strong>de</strong> horizonte difuso al<br />
(B) 25 - 55 Franco arenoso, <strong>de</strong> color negro ( 5 YR 2.5/1 ) en húmedo. Estructura<br />
masiva que se rompe en granu<strong>la</strong>r muy fino, débil. Consistencia<br />
muy friable. El pH es 4.2 y 5„2% el contenido <strong>de</strong> materia orgánica.<br />
Presencia <strong>de</strong> grava redon<strong>de</strong>ada <strong>de</strong> 3-6 cm. <strong>de</strong> diámetro .<br />
Límite <strong>de</strong>l horizonte gradual al<br />
C 55 +100 Franco arenoso, <strong>de</strong> color gris ( 10 YR 5/1 ) en húmedo. Estructura<br />
masiva <strong>de</strong> consistencia muy friable. Presencia <strong>de</strong> grava redon<strong>de</strong>ada<br />
<strong>de</strong> 3-6 cm. <strong>de</strong> diámetro.
Páe, 74 ZONA NORTE DE CAJAMARCA<br />
UN PERFIL DEL SUELO PARAMO ANDOSOL<br />
Zona<br />
Corre<strong>la</strong>ciónccon el<br />
Soil Taxonomy ( 1973 )<br />
Fisiograffa<br />
Pendiente<br />
Altitud<br />
Clima<br />
Precipitación<br />
Temperatura<br />
Zona <strong>de</strong> vida<br />
Material madre<br />
Vegetación<br />
Fragmentos gruesos superficiales<br />
El Cobro<br />
Crian<strong>de</strong>pt eutrandéptico<br />
La<strong>de</strong>ra<br />
Ligeramente inclinada a inclinada ( 15% )<br />
3,650 moS.n.m.<br />
Muy húmedo y frío<br />
600- 1000 mm.<br />
4-6 0 C<br />
pmh - SAT (páramo muy húmedo - Sub Alpino Tropi<br />
cal )<br />
Volcánico<br />
nudillo, Hualte<br />
No hay<br />
Horizonte<br />
Prof/cmo<br />
Descripción<br />
Al 0-50<br />
(B)l 50- 70<br />
Franco arenoso, <strong>de</strong> color negro ( 5 YR 2.5/1 ) en húmedo. Es -<br />
tructura granu<strong>la</strong>r fina, fuerte; consistencia friable en húmedo.El<br />
pH es 5 = 9 y 7.65% el contenido <strong>de</strong> materia orgánica. Límite <strong>de</strong><br />
horizonte gradual al<br />
Franco arenoso, <strong>de</strong> color pardo oscuro ( 10 YR 3/3 ) en húmedo.<br />
Estructura en bloques subangu<strong>la</strong>res medios, débiles; consistencia<br />
friable en húmedo. El pH es 6.5 y 3.38% el contenido <strong>de</strong> mate<br />
ria orgánica. Limite <strong>de</strong> horizonte c<strong>la</strong>ro al.<br />
(B)2<br />
70-110<br />
Franco arenoso, <strong>de</strong> color pardo amarillento ( 10 YR 5/8 ). Masi<br />
vo, <strong>de</strong> consistencia friable en húmedo. El pH es 6 = 7 y 0.69%el<br />
contenido <strong>de</strong> materia orgánica. Límite <strong>de</strong> horizonte c<strong>la</strong>ro al<br />
CR<br />
+110 Roca volcánica en <strong>de</strong>scomposición<br />
UN PERFIL DEL SUELO CHERNOZEM CALCICO<br />
Zona<br />
Corre<strong>la</strong>ción cohel<br />
Soil Taxonomy ( 1973 )<br />
Fisiografía<br />
Pendiente<br />
Altitud<br />
Clima<br />
Precipitación<br />
Temperatura<br />
Zona <strong>de</strong> vida<br />
: Camino a Succhubamba<br />
Crioborol típico<br />
La<strong>de</strong>ra<br />
Muy empinada a extremadamente empinada (70%)<br />
3,600 m.s.n.m.<br />
Muy húmedo y frío<br />
900 - 1300 mm.<br />
4- 7 o C<br />
bmh -MT-transic. ( bosque muy húmedo - Montano Tro<br />
pical transicional )
ANEXO IV - SUELOS Pág; 75<br />
Material madre<br />
Vegetación<br />
Fragmentos gruesos superficiales<br />
: Calizas<br />
: Paja, gramalote<br />
: No hay<br />
Horizonte Prof/cm Descripción<br />
Al 0-25 Franco arcilloso, <strong>de</strong> color pardo gris muy oscuro ( 10 YR 3/2 ) en<br />
húmedo» Estructura en bloques sub angu<strong>la</strong>res medios, débiles; <strong>de</strong><br />
consistencia friable en húmedo. El pH es 6.5 y 5.72% el contenido<br />
<strong>de</strong> materia orgánica. LTmite <strong>de</strong> horizonte gradual al<br />
B 25-55 Franco arcilloso, <strong>de</strong> color pardo grisáceo ( 10 YR 5/2 ) en húmedo.<br />
Estructura en bloques subangu<strong>la</strong>res gran<strong>de</strong>s, mo<strong>de</strong>rados; <strong>de</strong><br />
consistencia friable en húmedo. El pH es 7.5 y 2.89% el contenido<br />
<strong>de</strong> materia orgánica, muy alto contenido <strong>de</strong> carbonatas libres<br />
en <strong>la</strong> masa. Limite <strong>de</strong> horizonte gradual al<br />
Cica 55-110 Franco limoso, <strong>de</strong> color gris c<strong>la</strong>ro ( 10 YR 7/2 ) en húmedo. Masivo,<br />
<strong>de</strong> consistencia firme en húmedo. El pH es 7.7 y 0.34% el<br />
contenido <strong>de</strong> materia orgánica; extremadamente alto contenido <strong>de</strong><br />
carbonatas libres en <strong>la</strong> masa. Límite <strong>de</strong> horizonte c<strong>la</strong>ro al<br />
C2ca<br />
110 + 140 Franco, <strong>de</strong> color pardo amarillento ( 10 YR 5/4 ) en húmedo. Ma<br />
sivo, <strong>de</strong> consistencia firme en húnÍMo° El pH es 7.8 y 0.14% el<br />
contenido <strong>de</strong> materia orgánica. Extremadamente alto contenido<br />
<strong>de</strong> carbonatas libres en <strong>la</strong> masa.
ANÁLISIS DE LAS CARACTERIS, .A. QUÍMICAS Y FISICO-MECANICAS DE LOS SUELOS DE LA ZONA NORTE DE CAJAMARCA<br />
s<br />
CUSIFICACIOH NATURAL<br />
FAO U974) SOILTAXOHOMY (1973)<br />
Horiiortt<br />
PrahwftM pH<br />
CAP DE CAMBIO<br />
M i/IOOgn.<br />
CHj-COON^<br />
ÍM<br />
CATIONES CAMBIABLES<br />
n •flOOjtv<br />
Mi K N. H<br />
Al<br />
SAT D£ BASES<br />
1»<br />
CH3-C00NH4<br />
ANÁLISIS MECARIC0 MOWTCUUWL<br />
Arm<br />
UM<br />
AftDU<br />
G. tefe<br />
CUSE TEXTURAL<br />
Mibrii<br />
OqM»<br />
*<br />
NMf»<br />
1*1<br />
DffOWt<br />
bUctti COjC<br />
C/N ff» K|/Hi<br />
+<br />
a><br />
Fluvliol col eírico<br />
U,ttfluv»nt típico<br />
Ap<br />
AC<br />
0- 20<br />
20- 40<br />
7.5<br />
7.6<br />
20.80<br />
18.08<br />
16,37<br />
15.83<br />
1.37<br />
1.00<br />
0.76<br />
0.14<br />
0.12<br />
100<br />
100<br />
32<br />
44<br />
28<br />
26<br />
40<br />
30<br />
¡raneo ArcllWaArefl<br />
'raneo Arcillo»<br />
i 2.96<br />
2.41<br />
1.7<br />
1.4<br />
0.140<br />
0.114<br />
12<br />
12<br />
1».M<br />
21 .«9<br />
3.9<br />
2.6<br />
«20<br />
408<br />
GUlsol tnohco<br />
Glelsol mol.co<br />
Trepacuepf típico<br />
Al<br />
(Bife<br />
(B2l)fl<br />
(B22)9<br />
Cg<br />
All<br />
A12<br />
A13<br />
(B)g<br />
0- 25<br />
25- 50<br />
50- 85<br />
65-110<br />
110+140<br />
0- 10<br />
10- 30<br />
30- 50<br />
50+ 90<br />
5 9<br />
6.3<br />
6.3<br />
65<br />
6 4<br />
7.2<br />
6.6<br />
6 8<br />
7.0<br />
21.76<br />
22.24<br />
20.80<br />
23.04<br />
13.84<br />
36.32<br />
38.56<br />
32.16<br />
21.84<br />
13.85<br />
14.50<br />
15.89<br />
17 15<br />
8 95<br />
34 98<br />
36.80<br />
30 20<br />
20.90<br />
0.85<br />
0.58<br />
0.40<br />
0.92<br />
0 90<br />
0.91<br />
0.86<br />
0.79<br />
0.69<br />
0.70<br />
0.42<br />
0.28<br />
0.18<br />
0.80<br />
0.15<br />
0.11<br />
0.10<br />
0.07<br />
0.05<br />
0.05<br />
0.05<br />
0.08<br />
0.05<br />
0.28<br />
0.26<br />
0.24<br />
0.18<br />
71<br />
70<br />
80<br />
60<br />
77<br />
100<br />
98<br />
97<br />
100<br />
18<br />
18<br />
10<br />
6<br />
20<br />
42<br />
62<br />
42<br />
20<br />
36<br />
36<br />
36<br />
28<br />
42<br />
26<br />
24<br />
32<br />
24<br />
46<br />
46<br />
52<br />
64<br />
36<br />
32<br />
14<br />
26<br />
56<br />
krcllle<br />
treíl<strong>la</strong><br />
treíl<strong>la</strong><br />
trclllo<br />
ranee Anil<strong>la</strong> Límete<br />
ranee Ardí loto<br />
raneo Areno»<br />
ranee<br />
MI <strong>la</strong><br />
4.62<br />
2.00<br />
0.49<br />
1.<strong>03</strong><br />
0.69<br />
4.69<br />
7.79<br />
5.<strong>03</strong><br />
1.65<br />
2.7<br />
1.1<br />
0.4<br />
0.6<br />
0.4<br />
2.6<br />
4.5<br />
2.9<br />
0.9<br />
0.183<br />
0.110<br />
0.<strong>03</strong>6<br />
0.062<br />
0.012<br />
0.222<br />
0.365<br />
0.240<br />
0.080<br />
14<br />
10<br />
11<br />
9<br />
33<br />
13<br />
12<br />
12<br />
11<br />
~<br />
l<br />
24.4<br />
27.2<br />
32.8<br />
41.7<br />
36.1<br />
12.4<br />
16.9<br />
11.0<br />
11.4<br />
272<br />
272<br />
272<br />
340<br />
340<br />
544<br />
408<br />
408<br />
408<br />
GleiMl ¿utnco<br />
Tropacuepf aérlco<br />
Al<br />
(B)g<br />
C1B<br />
0- 20<br />
20- 50<br />
50- 75<br />
5 5<br />
5.7<br />
5.8<br />
20.56<br />
16.40<br />
20.80<br />
13 00<br />
11.00<br />
16 00<br />
0.74<br />
0 67<br />
0.58<br />
G.14<br />
0.16<br />
0.10<br />
0.15<br />
0.15<br />
0,15<br />
68<br />
73<br />
81<br />
28<br />
26<br />
40<br />
36<br />
32<br />
20<br />
34<br />
42<br />
40<br />
raneo Arcíl<strong>la</strong>te<br />
renco arcíllelo<br />
6.96<br />
3.17<br />
1.79<br />
4.0<br />
1.6<br />
1.0<br />
0.200<br />
0.114<br />
0.095<br />
20<br />
15<br />
10<br />
13.9<br />
22.2<br />
33.4<br />
272<br />
272<br />
272<br />
Glelwl col carleo<br />
Tropacuept típico<br />
Ap<br />
A12ca<br />
(6)19<br />
0- 15<br />
15- 40<br />
40- 70<br />
7.6<br />
7.7<br />
7.B<br />
13.52<br />
7.20<br />
7.84<br />
12.01<br />
5.62<br />
6.38<br />
1 18<br />
].29/<br />
1.18<br />
0.22<br />
0.23<br />
0.20<br />
0.11<br />
0.06<br />
0.06<br />
100<br />
100<br />
100<br />
20<br />
24<br />
40<br />
42<br />
42<br />
34<br />
38<br />
34<br />
26<br />
raneo arcillo limoo<br />
raneo orelllo llmoo<br />
ranee<br />
3.<strong>45</strong><br />
2.76<br />
0.76<br />
2.0<br />
1.6<br />
0.4<br />
0.166<br />
0.130<br />
0.<strong>03</strong>3<br />
12<br />
12<br />
12<br />
18.56<br />
21.84<br />
16.16<br />
5.6<br />
6.3<br />
1.0<br />
370<br />
370<br />
370<br />
Reg»el éutrlco<br />
Regeaol éuh-ico<br />
Uitortenl típico<br />
U»tort«ni típico<br />
Al<br />
Cl<br />
C2<br />
Ap<br />
AC<br />
C<br />
0- 20<br />
20- 05<br />
65+120<br />
0- 20<br />
20- 35<br />
35+ 70<br />
7.4<br />
73<br />
7 2<br />
6.0<br />
6.3<br />
6.5<br />
18.66<br />
18.00<br />
20.44<br />
22.48<br />
1936<br />
16 80<br />
17.09<br />
16.55<br />
18 88<br />
20.00<br />
18 00<br />
14.20<br />
1.21<br />
1.18<br />
1.18<br />
0.98<br />
1.05<br />
1 10<br />
0.20<br />
0.13<br />
0.22<br />
0.08<br />
0 06<br />
0.08<br />
0.16<br />
0.14<br />
0.16<br />
0.13<br />
0.15<br />
0.12<br />
100<br />
100<br />
100<br />
94<br />
97<br />
92<br />
60<br />
¿4<br />
56<br />
48<br />
52<br />
72<br />
22<br />
20<br />
20<br />
26<br />
28<br />
18<br />
16<br />
16<br />
24<br />
26<br />
20<br />
10<br />
ranee orermo<br />
raneo arencto<br />
raneo orcil 1 o areno»<br />
raneo arcillo areno»<br />
1.10<br />
0.69<br />
0.62<br />
1.17<br />
0.83<br />
0.76<br />
0.6<br />
0.4<br />
0.4<br />
0.7<br />
0.5<br />
0.4<br />
0.048<br />
0.<strong>03</strong>2<br />
0.<strong>03</strong>0<br />
0.055<br />
0.<strong>03</strong>7<br />
0.<strong>03</strong>3<br />
13<br />
13<br />
13<br />
13<br />
14<br />
12<br />
0.18<br />
0.16<br />
0.47<br />
"<br />
4.2<br />
1.9<br />
1.0<br />
2.6<br />
1.6<br />
1.0<br />
370<br />
370<br />
370<br />
370<br />
310<br />
370<br />
RogMol coleártco<br />
Ustertent típico<br />
All<br />
AI2<br />
C<br />
0- 30<br />
30-60<br />
60+125<br />
7 2<br />
7.3<br />
7.3<br />
22.48<br />
21.66<br />
23.24<br />
20.76<br />
20.17<br />
21.80<br />
1.13<br />
1.18<br />
1.16<br />
0.44<br />
0.18<br />
0 12<br />
0.15<br />
0.13<br />
0.16<br />
100<br />
100<br />
100<br />
42<br />
50<br />
50<br />
32<br />
28<br />
24<br />
26<br />
22<br />
26<br />
raneo<br />
ranee<br />
raneo-<br />
1.17<br />
1.10<br />
0.89<br />
0.7<br />
0.6<br />
0.5<br />
0.055<br />
0.050<br />
0,<strong>03</strong>8<br />
13<br />
12<br />
13<br />
3.33<br />
3.23<br />
4.18<br />
1.3<br />
4.9<br />
2.6<br />
544<br />
US<br />
Lltowl éurríco<br />
Lltatot eulríco<br />
Ustortwit típico<br />
Lhiocwpt líhco<br />
Uitocrept lírico<br />
Al<br />
Al<br />
All<br />
A12<br />
0- 15<br />
0- 15<br />
0- 10<br />
10- 25<br />
7.3<br />
6 4<br />
6.5<br />
6.8<br />
15 68<br />
13 84<br />
28.08<br />
28.96<br />
14.04<br />
12.40<br />
23.15<br />
26.00<br />
1.24<br />
1.13<br />
1.42<br />
1.64<br />
0.28<br />
0.26<br />
0.30<br />
0.28<br />
0.12<br />
0.05<br />
0.13<br />
0.15<br />
100<br />
100<br />
85<br />
97<br />
54<br />
56<br />
56<br />
66<br />
16<br />
30<br />
30<br />
24<br />
28<br />
14<br />
12<br />
10<br />
raneo fliellle areno»<br />
raneo eranoto<br />
raneo oronoto<br />
2.41<br />
4.75<br />
2.»<br />
2.21<br />
1.4<br />
2.6<br />
1.7<br />
1.3<br />
0.115<br />
0.149<br />
0.109<br />
0.094<br />
12<br />
16<br />
15<br />
13<br />
6.09<br />
-<br />
-<br />
1.4<br />
6.6<br />
5.2<br />
1.9<br />
370<br />
340<br />
340<br />
LltOMl éuir.co<br />
Lltmol eutrico<br />
Lítwol Sutrlco<br />
Ütotol éutrieo<br />
Ustocrept lírico<br />
Ustocrept If íleo<br />
Uslroerepf lítico<br />
Ustocrept lítlco<br />
Al<br />
AI<br />
AI<br />
Al<br />
0- 20<br />
0-25<br />
0- 15<br />
0- 15<br />
7.0<br />
5.9<br />
6.2<br />
6.2<br />
31.84<br />
27.76<br />
13.04<br />
30 16<br />
28.61<br />
16.20<br />
8.80<br />
28.20<br />
1.05 1 96<br />
0.69 0.31<br />
1.78 0.34<br />
0.79 | 0.15<br />
0.22)<br />
0.22 1<br />
o.»<br />
0.24<br />
100<br />
62<br />
64<br />
97<br />
36<br />
50<br />
46<br />
56<br />
28<br />
38<br />
24<br />
32<br />
36<br />
12<br />
30<br />
12<br />
ranea ore III «o<br />
raneo<br />
raneo arcillo arenóte<br />
rancoorem»<br />
7.51<br />
12.00<br />
1.17<br />
6.07<br />
4.4<br />
6.9<br />
0.7<br />
3.5<br />
0.316<br />
0.460<br />
0.057<br />
0.288<br />
14<br />
15<br />
12<br />
12<br />
0.47<br />
"<br />
-<br />
"<br />
17.3<br />
6.9<br />
3.8<br />
14.8<br />
544<br />
740<br />
54*<br />
408<br />
Litad éutrlco<br />
LItaol éutrico<br />
LItaol éutrlco<br />
tltasol ¿urrlco<br />
Uitocrept lírico<br />
Utioeropt lítico<br />
Ustocrept lítlco<br />
Utocrept lírico<br />
Al<br />
Al<br />
Al<br />
Al<br />
0- 25<br />
0- 2Q<br />
0- 20<br />
0- 20<br />
6 2<br />
6 3<br />
6.6<br />
7.4<br />
24.86<br />
18.80<br />
17.68<br />
17.44<br />
16.80<br />
14.60<br />
16.00<br />
15.66<br />
1.73 0.<strong>45</strong><br />
1.68 0.64<br />
0.77 0.31<br />
1.18 0.46<br />
0.14<br />
0.12<br />
0.14<br />
0.14<br />
77<br />
90<br />
97<br />
100<br />
72<br />
54<br />
20<br />
32<br />
18<br />
32<br />
36<br />
62<br />
10<br />
14<br />
42<br />
6<br />
ranee arenco<br />
raneo ora noto<br />
tral<strong>la</strong><br />
raneo llmotq<br />
4.82<br />
2.63<br />
5.52<br />
5.17<br />
2.8<br />
1.6<br />
3.2<br />
3.0<br />
0.216<br />
0.132<br />
0.265<br />
0.242<br />
1»-<br />
12<br />
12<br />
12<br />
-<br />
"<br />
"<br />
o.u<br />
1.3<br />
8.2<br />
32.0<br />
10.9<br />
620<br />
816<br />
408<br />
544<br />
Litojol ¿uh-ico<br />
Litraol colcónco<br />
LItaol colcáflco<br />
LItaol col corleo \<br />
LItaol col carleo<br />
LItaol calcáneo<br />
LItaol dfitrico<br />
RenJilna<br />
Rendzlno<br />
Rendí! m<br />
Andotol molleo<br />
Lbtocrept lítíco<br />
Uiecrept Utico<br />
Ustocrept lítlco<br />
Uttocrept lítlco<br />
Utlocrept lítlco<br />
Uttocrept lítico<br />
Haplumbreptlftico<br />
Caliuttol típico<br />
Calclustol típico<br />
Cokiuttol típico<br />
Ap<br />
AP<br />
Al<br />
Al<br />
Al<br />
AI<br />
Al<br />
Al<br />
B<br />
C<br />
Al<br />
AS<br />
B<br />
C<br />
Ap<br />
(B)<br />
Al<br />
Bl<br />
B2<br />
B3<br />
0- 20<br />
0- 20<br />
0- 20<br />
0- 25<br />
0- 20<br />
0- 10<br />
0- 20<br />
0- 25<br />
25- <strong>45</strong><br />
<strong>45</strong>- as<br />
O- 15<br />
15- 35<br />
35- 50<br />
50-120<br />
0- 15<br />
15-40<br />
0- 30<br />
30- 55<br />
55- 85<br />
85+110<br />
7.3<br />
7 1<br />
8.0<br />
7.B<br />
75<br />
7.4<br />
4 7<br />
7.8<br />
8.1<br />
7.8<br />
6.2<br />
7.4<br />
8 1<br />
8.1<br />
7.7<br />
8.1<br />
6 0<br />
6.4<br />
6 4<br />
17 20<br />
30.96<br />
5.92<br />
20.88<br />
26.88<br />
8.12<br />
36 00<br />
16 16<br />
10 80<br />
6.80<br />
38.40<br />
25.12<br />
8.00<br />
6.00<br />
14.08<br />
6 44<br />
22.64<br />
22.88<br />
21.68<br />
19.52<br />
15.23<br />
28 95<br />
5.34<br />
19.43<br />
24.74<br />
5.93<br />
5.60<br />
14 26<br />
9.12<br />
5.48<br />
22 80<br />
24.16<br />
7.44<br />
5-.47<br />
13.<strong>45</strong><br />
6.08<br />
14.60<br />
16.20<br />
16.20<br />
12 40<br />
1 29<br />
0 52<br />
0 99 0.78<br />
0.27 0.16<br />
0.65 0.ÓQ<br />
1.42 0 56<br />
1.39 0.70<br />
0.70 0.13<br />
1 18<br />
1.34<br />
1.18<br />
1 00<br />
0.54<br />
0.39<br />
0.37<br />
0.31<br />
0.18<br />
0.84<br />
1.41<br />
1.63<br />
1.85<br />
0.60<br />
0.26<br />
0.08<br />
0.40<br />
0.22<br />
0 07<br />
o.oa<br />
0.2(<br />
0.1C<br />
0 T.<br />
O.tí<br />
0.36<br />
0.2é<br />
0.16<br />
0.24<br />
0.15<br />
0.15<br />
0.20<br />
o.iol<br />
0.22<br />
0.12<br />
0.08<br />
0.06<br />
0.25<br />
0.20<br />
0.10<br />
0.10<br />
0.12<br />
0.08<br />
0.18<br />
0.16<br />
0.18<br />
0.16<br />
100<br />
100<br />
100<br />
100<br />
100<br />
100<br />
30<br />
100<br />
100<br />
100<br />
. 63<br />
100<br />
100<br />
100<br />
100<br />
100<br />
72<br />
79<br />
84<br />
75<br />
40<br />
46<br />
40<br />
30<br />
38<br />
16<br />
32<br />
18<br />
16<br />
32<br />
54<br />
26<br />
8<br />
8<br />
30<br />
52<br />
34<br />
36<br />
36<br />
28<br />
24<br />
22<br />
40<br />
36<br />
24<br />
50<br />
52<br />
40<br />
40<br />
34<br />
34<br />
26<br />
42<br />
46<br />
40<br />
32<br />
44<br />
30<br />
28<br />
30<br />
36<br />
32<br />
20<br />
34<br />
36<br />
34<br />
16<br />
42<br />
44<br />
34<br />
50<br />
46<br />
30<br />
16<br />
22<br />
32<br />
36<br />
42<br />
ranee orclltbio<br />
ranee<br />
raneo oreII lo.o<br />
ranee arcíllele<br />
raneo arcillo limo»<br />
¡raneo Umao<br />
trcillo limen<br />
Millo límete<br />
renco arcllte»<br />
.re¡lio<br />
arcillo llmao<br />
arcillo llrtiOM<br />
'raneo orcllloio<br />
raneo otcllle»<br />
ranee ere MI ato<br />
Arcil<strong>la</strong><br />
5.31<br />
7.10<br />
2.00<br />
5.<strong>45</strong><br />
1.52<br />
1.72<br />
10.62<br />
3.65<br />
1.79<br />
0.55<br />
11.10<br />
4.75<br />
1.17<br />
0.34<br />
1.79<br />
0.34<br />
5.86<br />
3.66<br />
2.69<br />
2.07<br />
3.1<br />
4.1<br />
1.2<br />
3.2<br />
0.8<br />
1.0<br />
6.1<br />
2.1<br />
1.0<br />
0.3<br />
6.4<br />
2.8<br />
0.7<br />
0.2<br />
1.0<br />
0.2<br />
3.4<br />
2.2<br />
1.6<br />
1.2<br />
0.234<br />
0.196<br />
0.134<br />
0.181<br />
0.074<br />
0.086<br />
0.<strong>45</strong>2<br />
0.166<br />
o.oee<br />
0.023<br />
0.493<br />
0.228<br />
0.058<br />
0.016<br />
0.067<br />
0.015<br />
0.240<br />
0.186<br />
0.123<br />
0.101<br />
12<br />
20<br />
8<br />
17<br />
10<br />
12<br />
14<br />
13<br />
11<br />
12<br />
13<br />
12<br />
12<br />
12<br />
11<br />
13<br />
:¡<br />
12<br />
0.12<br />
29.51<br />
32.36<br />
21.69<br />
5.23<br />
3Ó.5Ó'<br />
-<br />
39.<strong>03</strong><br />
50.93<br />
69.50<br />
4.28<br />
52.83<br />
48.35<br />
44.74<br />
44.74<br />
~<br />
1.4<br />
8.9<br />
9.1<br />
3.8<br />
2.1<br />
14.0<br />
2.9<br />
2.4<br />
1.4<br />
3.6<br />
22.4<br />
7.2<br />
2.0<br />
2.4<br />
4.0<br />
1.0<br />
8.2<br />
5.5<br />
2.7<br />
1.7<br />
408<br />
408<br />
340<br />
408<br />
408<br />
740<br />
544<br />
370<br />
370<br />
370<br />
«20<br />
544<br />
408<br />
544<br />
370<br />
408<br />
740<br />
680<br />
544<br />
620<br />
N<br />
O<br />
Z<br />
•<br />
5S<br />
O<br />
ja<br />
H<br />
tn<br />
O<br />
tn<br />
O<br />
><br />
><br />
An^osol mol ico<br />
f<br />
Eutran<strong>de</strong>pt Gdtco<br />
All<br />
A12<br />
AC<br />
Cl<br />
0- 10<br />
10- 35<br />
35-65<br />
65-110<br />
6 I<br />
6 3<br />
6 3<br />
6.2<br />
33.60<br />
29 20<br />
22.80<br />
22.72<br />
24.80<br />
18.60<br />
18.40<br />
18.80<br />
1.63<br />
1.48<br />
1.68<br />
1.63<br />
1 4C<br />
0 4Z<br />
0 ^<br />
0.34<br />
0.26<br />
0 26<br />
0.20<br />
0.18<br />
83<br />
71<br />
90 *<br />
87<br />
4<br />
52<br />
50<br />
56<br />
80<br />
30<br />
16<br />
20<br />
16<br />
18<br />
32<br />
22<br />
raneo llmae<br />
raneo<br />
Franco arcillo araño»<br />
9.93<br />
7.58<br />
2.62<br />
1.17<br />
5.8<br />
4.4<br />
1.5<br />
0.7<br />
0.411<br />
0.359<br />
0.122<br />
0.055<br />
14<br />
12<br />
12<br />
13<br />
"Z<br />
7.6<br />
4.4<br />
2.4<br />
2.7<br />
816<br />
620<br />
344<br />
408<br />
>
1 OASIHCACIO N<br />
FAO<br />
1 Andosol malice<br />
Andoiol mólteo<br />
('9741<br />
NATURAL<br />
SOU TAXONOMY (1973)<br />
Eulron<strong>de</strong>pt Odlco<br />
Horizonte<br />
A<br />
AB<br />
Ap<br />
AC<br />
C<br />
Pnlundñhd<br />
uní<br />
0- 10<br />
10- 35<br />
35- 60<br />
0- 10<br />
10- <strong>45</strong><br />
<strong>45</strong>-120<br />
pH<br />
6.2<br />
6.0<br />
6.0<br />
6.9<br />
6.9<br />
6.5<br />
CAP. DE CAMBIO<br />
m e/100 grs<br />
CH3-C00NH4<br />
22.24<br />
15.04<br />
19.76<br />
24.64<br />
21.60<br />
12.80<br />
Ce<br />
16.40<br />
12.00<br />
14.20<br />
18.80<br />
18.80<br />
9.80<br />
CATIONES CAMBIABLES<br />
m e/100 ¡n.<br />
Ma K<br />
1.63 0.64<br />
1.70 0.56<br />
1.83 0.65<br />
1.86 0.30<br />
1.77 0.30<br />
0.88 0.10<br />
N. ! H<br />
0.18<br />
0.12<br />
0.14<br />
0.20<br />
0.16<br />
0.09<br />
1 At<br />
SAT DE BASES<br />
lo<br />
CHj-COOfcH^<br />
B4<br />
95<br />
85<br />
85<br />
97<br />
84<br />
<strong>ANA</strong>USIS MECÁNICO<br />
Arene<br />
24<br />
24<br />
14<br />
22<br />
22<br />
12<br />
«lo<br />
limo<br />
36<br />
34<br />
28<br />
34<br />
26<br />
30<br />
Artil<strong>la</strong>, Grava<br />
40<br />
42<br />
58<br />
44<br />
52<br />
58<br />
M0DIF TEXTJRAI<br />
*<br />
hiedra<br />
CLASE TEXTURAL<br />
Matena<br />
Orgánica<br />
Francoarclllosooorcí ItJ 3.38<br />
Arcillo 2.07<br />
tai) <strong>la</strong><br />
ireltlo<br />
arcil<strong>la</strong><br />
3.<strong>03</strong><br />
2.14<br />
0.62<br />
Carbono<br />
Orgam»<br />
2.3<br />
2.0<br />
1.2<br />
i.a<br />
1.2<br />
0.4<br />
Nrtrígeno<br />
Total<br />
*<br />
0.192<br />
0.157<br />
0.1<strong>03</strong><br />
0.146<br />
0.105<br />
0.029<br />
R*au¿n<br />
12<br />
1 13<br />
¡<br />
,2<br />
12<br />
1<br />
14<br />
C<strong>03</strong>Ca<br />
"<br />
IDISPONIBLES<br />
1 p<br />
P(.m<br />
! 4.1<br />
' 2.7<br />
i 2.0<br />
5.5<br />
2.0<br />
5.1<br />
|Kg/Ha<br />
i 680<br />
816<br />
816<br />
544<br />
544<br />
408<br />
><br />
2<br />
w<br />
X<br />
O<br />
Andosot molleo<br />
Aneteol mélico<br />
Andoíol vfrrico<br />
Andosol vDrico<br />
Eutron<strong>de</strong>pf&dlco<br />
Eutron<strong>de</strong>pt údico<br />
Vitron<strong>de</strong>pt mol ico<br />
Al<br />
<br />
21.36<br />
19.04<br />
21.40<br />
18.65<br />
20.49<br />
22.75<br />
21.90<br />
19.77<br />
20. 8<br />
25.20<br />
20.40<br />
18.38<br />
0.87<br />
0.87<br />
0.87<br />
0.93<br />
1.01<br />
0.33<br />
0.22<br />
0.13<br />
0.56<br />
0.33<br />
0.31<br />
0.10<br />
0.08<br />
0.16<br />
0.52<br />
0.30<br />
O.40<br />
O.40<br />
0.20<br />
0.13<br />
0. 8<br />
0. 4<br />
0. 6<br />
0. 6<br />
0. 7<br />
0. 4<br />
0. 4<br />
0.35<br />
0.20<br />
0.20<br />
98<br />
100<br />
100<br />
100<br />
100<br />
100<br />
100<br />
100<br />
100<br />
100<br />
16<br />
14<br />
18<br />
20<br />
26<br />
36<br />
26<br />
24<br />
20<br />
,24<br />
28<br />
32<br />
26<br />
26<br />
30<br />
24<br />
26<br />
30<br />
40<br />
36<br />
56<br />
54<br />
56<br />
54<br />
44<br />
40<br />
48<br />
46<br />
40<br />
40<br />
50<br />
rcil<strong>la</strong><br />
arcil<strong>la</strong><br />
arcil<strong>la</strong><br />
arcil<strong>la</strong><br />
rcil<strong>la</strong><br />
rcil<strong>la</strong><br />
rcil<strong>la</strong><br />
rancoarcll<strong>la</strong>tsaarcl<br />
lo<br />
2.62<br />
1.24<br />
0.83<br />
0.83<br />
4.41<br />
1.65<br />
2.14<br />
2.62<br />
4.68<br />
3.79<br />
1.5<br />
0.7<br />
0.5<br />
o.4<br />
2.6<br />
1.0<br />
1.2<br />
1.5<br />
2.7<br />
2.2 |<br />
0.122<br />
0.062<br />
0.<strong>03</strong>7<br />
0.<strong>03</strong>5<br />
0.153<br />
0.113<br />
0.129<br />
0.131<br />
0.175<br />
0.134<br />
12<br />
11<br />
14<br />
14<br />
16<br />
a<br />
9<br />
ii<br />
21.89<br />
1.42<br />
25.70<br />
27.60<br />
29.51<br />
21.42<br />
19.04<br />
15 5.71<br />
16 ' 23.<br />
2.6<br />
0.7<br />
0.7<br />
1.3<br />
9.7<br />
3.3<br />
1.3<br />
1.9 '<br />
6.9 |<br />
4.<br />
408.1<br />
370<br />
370 |<br />
370<br />
272<br />
272 1<br />
200 1<br />
272 1<br />
340 1<br />
J40 1<br />
OQ<br />
-4<br />
-4
CLASIFICACIÓN NATURAL<br />
FAQ (1974)<br />
SOILTAXOMOMY (1973)<br />
CAP. DE CAMBIO<br />
Prolundidad<br />
Hwaonb<br />
pH •.e/100 an<br />
cm<br />
CH3-C00HH4<br />
C<br />
CATIONES CAMBIABLES<br />
•i.e/1 ¥1 «<br />
JUgn.<br />
Mg K Ni H<br />
1*1<br />
SAT. DE BASES<br />
-lo<br />
CH3-COONH4<br />
ANÁLISIS MECÁNICO<br />
lo<br />
Aran<br />
Un»<br />
AiüHa<br />
M0WF.TEXTURAL<br />
*<br />
Gnv.<br />
Piedra<br />
CUSE TEXTURAL<br />
Miteu<br />
Orgínk»<br />
"lo<br />
Utono<br />
Oqinic.<br />
I»<br />
NSPOWBLESl<br />
Nfedgen. Relwáq COjO<br />
Tetel<br />
P K20<br />
C/N<br />
pp. fíg/H..<br />
"O<br />
OQ<br />
Kostanozem calcico<br />
CalciuEtol típico<br />
Ap<br />
A12ca<br />
Bca<br />
C<br />
0- 30<br />
30- 00<br />
60- as<br />
B5+120<br />
7.8<br />
8.0<br />
8.2<br />
B.2<br />
24.68<br />
13.60<br />
9.52<br />
11.28<br />
13.21<br />
12.88<br />
9.00<br />
10.56<br />
0.76 0.52<br />
0.36 0.16<br />
0.27 0.06<br />
0.49 0.10<br />
0.17<br />
0.20<br />
0.10<br />
0.13<br />
59<br />
100<br />
100<br />
100<br />
26<br />
18<br />
20<br />
14<br />
36<br />
46<br />
46<br />
50<br />
38<br />
36<br />
34<br />
36<br />
70<br />
Franco arcilloso<br />
Franco artillo limoso<br />
Franco oreillo limoso<br />
Franco ercillo limoso<br />
5.24<br />
2.07<br />
0.89<br />
0.69<br />
3.0<br />
1.2<br />
0.5<br />
0.4<br />
0.136<br />
0.121<br />
0.093<br />
0.071<br />
22<br />
9<br />
5<br />
5<br />
3.80<br />
19.99<br />
27.60<br />
4.47<br />
7.5<br />
1.6<br />
4.1<br />
1.3<br />
340<br />
272<br />
272<br />
272<br />
Kusíanozem calcico<br />
Cdduítol ffplco<br />
Al<br />
IIAlCD<br />
iieco<br />
IIC<br />
0- 25<br />
25- 40<br />
40- 70<br />
7OH20<br />
7.4<br />
7.6<br />
7.6<br />
7.5<br />
17.76<br />
20.72<br />
20.00<br />
13.04<br />
16.56<br />
19.57<br />
19.07<br />
12.68<br />
0.68 0.38<br />
0.75 0.24<br />
0.67 0.10<br />
0.10 0.16<br />
o.u<br />
0.16<br />
0.16<br />
0.10<br />
100<br />
100<br />
100<br />
100<br />
28<br />
22<br />
20<br />
20<br />
38<br />
32<br />
32<br />
30<br />
34<br />
46<br />
48<br />
50<br />
60<br />
50<br />
70<br />
70<br />
Franco arcilloso<br />
Arcil<strong>la</strong><br />
Arcil<strong>la</strong><br />
Arcil<strong>la</strong><br />
4.82<br />
2.96<br />
2.76<br />
P.96<br />
2.8<br />
1.7<br />
1.6<br />
0.6<br />
0.220<br />
0.135<br />
0.130<br />
0.043<br />
13<br />
13<br />
12<br />
14<br />
43.79<br />
29.98<br />
29.98<br />
6.00<br />
4.5<br />
1.9<br />
2.6<br />
4.2<br />
370<br />
370<br />
310<br />
406<br />
Cdciustol típico<br />
Al<br />
Bca<br />
Cea<br />
0- 25<br />
25- <strong>45</strong><br />
<strong>45</strong>-120<br />
7.9<br />
7.9<br />
7.8<br />
19.60<br />
18.40<br />
14.16<br />
17.94<br />
16.81<br />
12.76<br />
1.16 0.36<br />
1.13 0.30<br />
1-18 0.10<br />
0.14<br />
0.16<br />
0.12<br />
100<br />
100<br />
100<br />
28<br />
30<br />
66<br />
32<br />
30<br />
20<br />
40<br />
40<br />
14<br />
Franco arcillcsoa ardil<br />
Franco arcilloso a ardil<br />
2.00<br />
1.38<br />
0,41<br />
1.1<br />
0.8<br />
0.2<br />
0.099<br />
0.065<br />
0.018<br />
11<br />
12<br />
11<br />
9.52<br />
15.70<br />
27.60<br />
1.7<br />
1.0<br />
3.5<br />
408<br />
408<br />
370<br />
Kostonozetn calcico<br />
Kastanozam calcico<br />
Cdciustol típico<br />
Caleiwlol ffpico<br />
Al<br />
A3<br />
Bca<br />
Cea<br />
Al<br />
6<br />
Cica<br />
C2Ca<br />
0- 25<br />
25- 50<br />
50- SO<br />
80-150<br />
0- 25<br />
25- <strong>45</strong><br />
<strong>45</strong>- 80<br />
80-135<br />
7.8<br />
7.9<br />
e.fl<br />
8.2<br />
6.0<br />
7.2<br />
7.5<br />
7.B<br />
19.36<br />
20.80<br />
15.68<br />
9.12<br />
16.00<br />
18.96<br />
18.32<br />
15.52<br />
17.86<br />
19.88<br />
15.12<br />
8.90<br />
12.80<br />
17.86<br />
17.17<br />
13.90<br />
0.87 0.47<br />
0.46 0.30<br />
0.23 0.19<br />
0.10 0.04<br />
0.77 0.55<br />
0.38 0.58<br />
0.49 0.52<br />
0.82 0.68<br />
0.16<br />
0.16<br />
0.14<br />
0.08<br />
0.12<br />
0.14<br />
0.14<br />
0.12<br />
100<br />
100<br />
100<br />
100<br />
89<br />
100<br />
100<br />
100<br />
36<br />
36<br />
28<br />
14<br />
34<br />
22<br />
28<br />
28<br />
26<br />
28<br />
32<br />
48<br />
30<br />
38<br />
30<br />
28<br />
38<br />
36<br />
40<br />
38<br />
36<br />
40<br />
42<br />
44<br />
: ranco arcilloso<br />
'raneo arcltloso<br />
: ranco arcillo limoso<br />
: ranco arcilloso<br />
: ranco arcÍlto»o a ardil<br />
: ran co ore i 11 OM a are i J1<br />
arcil<strong>la</strong><br />
3.79<br />
3.65<br />
1.93<br />
0.55<br />
2.41<br />
1.79<br />
1.52<br />
1.24<br />
2.2<br />
2.1<br />
1.1<br />
0.3<br />
1.4<br />
1.0<br />
0.9<br />
0.7<br />
0.170<br />
0.162<br />
0.095<br />
0.026<br />
0.116<br />
0,086<br />
0.074<br />
0.060<br />
13<br />
13<br />
11<br />
11<br />
12<br />
12<br />
12<br />
12<br />
12.37<br />
9.S2<br />
16.66<br />
59.50<br />
6.66<br />
_<br />
19.04<br />
15.70<br />
2.4<br />
2.4<br />
2.8<br />
1.0<br />
4.9<br />
1.0<br />
5.6<br />
0.7<br />
406<br />
370<br />
370<br />
310<br />
620<br />
408<br />
408<br />
544<br />
Phoeoiem hápltco<br />
Phaeozem háplíco<br />
PhaMzem hoplíco<br />
Pfxjeozem Upltco<br />
Phaoozan háplíco<br />
Cdciustol l'plco<br />
Haplmfd<br />
Hapl usfol<br />
Hoplustol<br />
Haplwtol<br />
Haplustol<br />
Haplustd<br />
Hapluttol<br />
Hapl w Id<br />
Haplustd<br />
Hopluitol<br />
Hoplustol<br />
Hapludol típico<br />
Alca<br />
Ap<br />
A12<br />
A3<br />
B2<br />
C<br />
Al<br />
A3<br />
W<br />
Cl<br />
C2<br />
Al<br />
(B)<br />
C<br />
Al<br />
IIA11<br />
IIA12<br />
11(B)<br />
IIC<br />
Al<br />
AC<br />
Cl<br />
C2<br />
All<br />
A12<br />
A3<br />
B<br />
Ap<br />
(B)<br />
C<br />
Al<br />
A3<br />
B<br />
Al<br />
(6)1<br />
(B)2<br />
C<br />
Al<br />
(B)l<br />
(B)2<br />
C<br />
A<br />
Al<br />
AC<br />
Ap<br />
A3<br />
B2<br />
Ap<br />
(B)<br />
C<br />
A<br />
B<br />
C<br />
0- 25 7.9<br />
0- 20 6.0<br />
20- <strong>45</strong> 5.9<br />
<strong>45</strong>- 65 5.7<br />
65- 90 5.6<br />
90-130 5.6<br />
0- 15 5.6<br />
15- 35 5.6<br />
35- 80 5.7<br />
80-115 5.6<br />
115+150 5.5<br />
0- 20 5.4<br />
20- 40 5.7<br />
40-100 5.3<br />
0- 30 5.7<br />
30-60 5.6<br />
60- 80 5.5<br />
80-120 5.3<br />
120+150 5.5<br />
0- 20 6.4<br />
20- 70 6.2<br />
70-100 6.0<br />
10(H-140 6.2<br />
0- 25 6.0<br />
25- 65 5.8<br />
65-100 5.7<br />
100+135 5.7<br />
0- 15 5.6<br />
15- 70 5.6<br />
70-130 5.<br />
0- 30 5.<br />
30- 60 6.'<br />
60+BD 6.6<br />
0- 30 5.<br />
30- 50 5.'<br />
50- 75 5.4<br />
75+140 5.4<br />
0- 20 6.7<br />
20- 40 7.1<br />
40- 55 7.0<br />
55-120 7.2<br />
0- 25 7.0<br />
25- 50 7.0<br />
0- 20 6.7<br />
20- 60 7.<br />
60+110 7.2<br />
0- 20 5.3<br />
20- 30 5.3<br />
30+110 5.3<br />
0- 20 6.5<br />
20- 40 6.1<br />
40-130 6.3<br />
19.36<br />
16.88<br />
14.72<br />
12.64<br />
9.60<br />
12.96<br />
17.44<br />
13.60<br />
12.56<br />
16.80<br />
13.68<br />
22.16<br />
9.92<br />
16.56<br />
16.40<br />
15.26<br />
17.20<br />
7.68<br />
12.48<br />
24.64<br />
18.64<br />
21.68<br />
23.04<br />
24.00<br />
24.56<br />
20.33<br />
17.36<br />
17.84<br />
10.96<br />
5.60<br />
28.96<br />
22.76<br />
30.96<br />
13.52<br />
18.32<br />
13.20<br />
12.44<br />
24.40<br />
29.60<br />
30.48<br />
19.60<br />
24.68<br />
26.80<br />
19.60<br />
26.56<br />
30.04<br />
15.76<br />
13.92<br />
13.60<br />
15.84<br />
12.80<br />
9.12<br />
17.75<br />
10.43<br />
11.61<br />
9.31<br />
6.00<br />
6.SÍ<br />
11.01<br />
7.51<br />
6.30<br />
11.20<br />
8.75<br />
13.20<br />
6.00<br />
10.20<br />
12.00<br />
9.90<br />
10.60<br />
4.90<br />
8.60<br />
17.11<br />
15.00<br />
16.80<br />
17.20<br />
21.90<br />
17.88<br />
12.13<br />
9.10<br />
12.40<br />
6.80<br />
2.60<br />
24.00<br />
18.80<br />
28.60<br />
6.80<br />
8.80<br />
8.40<br />
8.60<br />
20.80<br />
28.24<br />
29.65<br />
19.<strong>03</strong><br />
21.52<br />
23.69<br />
16.60<br />
24.44<br />
28.41<br />
8.00<br />
10.20<br />
8.00<br />
8.60<br />
8.00<br />
7.40<br />
1.26 0.21<br />
1.17 2.20<br />
0.54 0.52<br />
0.33 0.28<br />
0.22 0.20<br />
0.20 0.20<br />
1.<strong>03</strong> 0.84<br />
1.01 0.14<br />
0.72 0.12<br />
0.76 0.13<br />
0.67 0.19<br />
0.76 0.13<br />
0.99 0.22<br />
0.27 0.14<br />
0.27 0.12<br />
0.13 0.16<br />
0.40,0.16<br />
0.22 0.05<br />
0.36 0.08<br />
1.17 0.52<br />
0.99 0.42<br />
1.06 0.44<br />
1.10 0.42<br />
0.99 1.08<br />
0.33 0.32<br />
0.22 0.09<br />
0.09 0.14<br />
0.44 1.00<br />
0.33 0.16<br />
0.41 0.22<br />
1.08 0.68<br />
0.31 0.29<br />
0.28 0.78<br />
0.96 0.17<br />
1.13 0.14<br />
1.44 0.15<br />
1.40 0.10<br />
0.69 1.62<br />
0.62 0.56<br />
0.38 0.25<br />
0.33 o.oe<br />
1.70 1.30<br />
1.65 1.12<br />
1.16 1.00<br />
0.98 0.96<br />
0.93 0.50<br />
1,13 0.54<br />
0.96 O.??<br />
0.98 0.11<br />
1.21 0.60<br />
0.22 0.24<br />
0.32 0.15<br />
0.14<br />
0.08<br />
0.05<br />
0.<strong>03</strong><br />
0.<strong>03</strong><br />
0.05<br />
0.<strong>03</strong><br />
0.05<br />
0.<strong>03</strong><br />
0.<strong>03</strong><br />
0.<strong>03</strong><br />
0,5i<br />
0.06<br />
0.06<br />
0.05<br />
0.08<br />
0.051<br />
o.os:<br />
0.05|<br />
0.13<br />
0.13<br />
0.10<br />
0.13<br />
0.<strong>03</strong><br />
0.<strong>03</strong><br />
0.<strong>03</strong><br />
0.<strong>03</strong><br />
0.10<br />
o.ot<br />
0.05<br />
O.V<br />
0.1'<br />
0.16<br />
0.10<br />
0.12<br />
0.14<br />
0.12<br />
0.12<br />
0.18<br />
0.20<br />
0.16<br />
0.16<br />
0.14<br />
0.1!<br />
O.lí<br />
0.2C<br />
0.1C<br />
o.oe<br />
o.u<br />
0.14<br />
0.10<br />
o.oe<br />
-*.<br />
100<br />
82<br />
66<br />
79<br />
67<br />
69<br />
74<br />
64<br />
57<br />
72<br />
70<br />
64<br />
73<br />
65<br />
76<br />
67<br />
65<br />
66<br />
73<br />
77<br />
89<br />
85<br />
82<br />
100<br />
76<br />
61<br />
54<br />
78<br />
67<br />
59<br />
89<br />
86<br />
96<br />
59<br />
56<br />
77<br />
77<br />
95<br />
100<br />
100<br />
100<br />
100<br />
100<br />
96<br />
100<br />
100<br />
62<br />
63<br />
67<br />
66<br />
66<br />
87<br />
38<br />
30<br />
26<br />
26<br />
16<br />
14<br />
18<br />
30<br />
32<br />
38<br />
20<br />
38<br />
28<br />
40<br />
30<br />
32<br />
32<br />
26<br />
30<br />
20<br />
38<br />
12<br />
6<br />
52<br />
66<br />
56<br />
46<br />
40<br />
22<br />
24<br />
52<br />
56<br />
42<br />
58<br />
52<br />
54<br />
54<br />
24<br />
22<br />
20<br />
24<br />
46<br />
44<br />
28<br />
26<br />
18<br />
18<br />
24<br />
30<br />
60<br />
38<br />
42<br />
32<br />
36<br />
42<br />
32<br />
34<br />
32<br />
42<br />
38<br />
48<br />
44<br />
48<br />
38<br />
40<br />
26<br />
36<br />
30<br />
32<br />
42<br />
36<br />
22<br />
18<br />
24<br />
40<br />
36<br />
26<br />
26<br />
24<br />
42<br />
40<br />
30<br />
14<br />
18<br />
20<br />
22<br />
16<br />
20<br />
22<br />
30<br />
24<br />
24<br />
40<br />
28<br />
24<br />
22<br />
20<br />
22<br />
22<br />
18<br />
14<br />
30<br />
34<br />
28<br />
30<br />
34<br />
32<br />
42<br />
50<br />
54<br />
40<br />
32<br />
20<br />
28<br />
32<br />
24<br />
32<br />
32<br />
34<br />
38<br />
36<br />
32<br />
24<br />
58<br />
44<br />
64<br />
54<br />
12<br />
8<br />
18<br />
30<br />
18<br />
38<br />
46<br />
34<br />
26<br />
38<br />
20<br />
32<br />
26<br />
24<br />
46<br />
54<br />
56<br />
36<br />
26<br />
32<br />
50<br />
54<br />
60<br />
60<br />
58<br />
56<br />
10<br />
28<br />
30<br />
20<br />
20<br />
30<br />
15<br />
20<br />
50<br />
30<br />
50<br />
80<br />
50<br />
70<br />
: ror>co arcilloso<br />
Vaneo arcilloso<br />
: raneo arcilloso<br />
: rancoareil loso a arcil<strong>la</strong><br />
fcrdlk.<br />
arcillo<br />
«.rcillo limoso<br />
-ronco ardí toso<br />
: raneo<br />
: ronco<br />
-raneo arcillo Üincso<br />
'raneo<br />
=ranco arcillólo<br />
=ranco arall loso<br />
Franco arcilloso<br />
: ranco arcilloso<br />
: ranco orcilloso<br />
=ranco ardl<strong>la</strong>so<br />
: ranco arcilloso<br />
Arcillo<br />
treíl<strong>la</strong><br />
Arcil<strong>la</strong><br />
treil<strong>la</strong><br />
Franco arenóte<br />
Franco aranoso<br />
F raneo are íl 1 o arenoso<br />
Franco<br />
Franco arcilloso<br />
Arcil<strong>la</strong><br />
Franco arcillo aranoso<br />
Franco arcillo arenoso<br />
Franco arcilloso<br />
Franco aranoso<br />
Franco arcillo arenoso<br />
Franco arcillo arenoso<br />
Franco arcillo arenoso<br />
Arcil<strong>la</strong><br />
A rcil<strong>la</strong><br />
Arcil<strong>la</strong><br />
Franco arcilloso<br />
Franco<br />
Franco arcillo arenoso<br />
Arcillo<br />
Arcillo<br />
Arcillo<br />
Arcil<strong>la</strong><br />
Arcil<strong>la</strong><br />
Arcil<strong>la</strong><br />
Franco arcilloso<br />
Franco arcilloso<br />
4.14<br />
5.65<br />
5.31<br />
3.86<br />
2.27<br />
0.46<br />
5.17<br />
2.41<br />
0.69<br />
0.69<br />
0.69<br />
5.93<br />
1.52<br />
1.52<br />
1.58<br />
4.48<br />
4.62<br />
2.38<br />
1.24<br />
3.24<br />
0.89<br />
0.83<br />
0.48<br />
8.96<br />
7.7*<br />
4.62<br />
1.52<br />
4.89<br />
0.76<br />
0.76<br />
2.41<br />
1.65<br />
1.<strong>03</strong><br />
3.72<br />
1.24<br />
0.62<br />
0.34<br />
3.24<br />
1.31<br />
1.31<br />
0.41<br />
3.<strong>45</strong><br />
2.62<br />
1.86<br />
1.72<br />
0.83<br />
3.10<br />
2.00<br />
0.89<br />
6.27<br />
3.86<br />
1.65<br />
2.4<br />
3.3<br />
3.1<br />
2.2<br />
1.3<br />
0.3<br />
3.0<br />
1.4<br />
0.4<br />
0.4<br />
0.4<br />
3.4<br />
0.9<br />
0.9<br />
0.9<br />
2.6<br />
2.7<br />
0.8<br />
0.7<br />
1.9<br />
0.5<br />
0.5<br />
0.3<br />
5.2<br />
4.5<br />
2.7<br />
0.9<br />
2.8<br />
0.4<br />
0.4<br />
1.4<br />
1.0<br />
0.6<br />
2.2<br />
0.7<br />
0.3<br />
0.2<br />
1.9<br />
0.8<br />
0.8<br />
0.2<br />
2.0<br />
1.5<br />
1.1<br />
1.0<br />
0.5<br />
1.8<br />
1.2<br />
0.5<br />
4.8<br />
2.2<br />
0.9<br />
0.193<br />
0.185<br />
0.130<br />
0.100<br />
0.070<br />
0.010<br />
0.154<br />
0.112<br />
0.090<br />
0.075<br />
0.009<br />
0.194<br />
0.075<br />
O.OBO<br />
0.1O0<br />
0.161<br />
0.174<br />
0.084<br />
0.073<br />
0.181<br />
0.090<br />
0.074<br />
0.065<br />
0.214<br />
0.179<br />
0.163<br />
0.100<br />
,0.219<br />
0.<strong>03</strong>4<br />
0.<strong>03</strong>5<br />
0.113<br />
0.080<br />
0.047<br />
0.170<br />
0.060<br />
0.029<br />
0.015<br />
0.144<br />
0.062<br />
0.060<br />
0.018<br />
0.158<br />
0.125<br />
0.090<br />
0.082<br />
0.<strong>03</strong>6<br />
0.140<br />
0.095<br />
0.<strong>03</strong>8<br />
0.366<br />
0.180<br />
o.oeo<br />
13<br />
17<br />
23<br />
22<br />
18<br />
30*<br />
19<br />
12<br />
4<br />
5<br />
44<br />
17<br />
12<br />
11<br />
9<br />
14<br />
15<br />
9<br />
9<br />
10<br />
5<br />
6<br />
4<br />
24<br />
25<br />
16<br />
9<br />
13<br />
12<br />
11<br />
12<br />
13<br />
13<br />
13<br />
12<br />
14<br />
13<br />
13<br />
13<br />
13<br />
11<br />
13<br />
12<br />
12<br />
12<br />
14<br />
13<br />
13<br />
13<br />
13<br />
12<br />
11<br />
30.00<br />
..<br />
—<br />
-<br />
—<br />
—<br />
-<br />
"<br />
--<br />
—<br />
-<br />
._<br />
—<br />
-<br />
_<br />
—<br />
"<br />
_<br />
—<br />
-<br />
—<br />
"<br />
—<br />
-<br />
_<br />
1.33<br />
0.12<br />
0.12<br />
0.28<br />
0.12<br />
„<br />
0.47<br />
1.42<br />
_<br />
~<br />
—<br />
_<br />
—<br />
1.7<br />
14.1<br />
1.6<br />
1.9<br />
1.1<br />
0.2<br />
2.2<br />
0.2<br />
5.5<br />
2.5<br />
3.6<br />
86.3<br />
89.0<br />
9.18<br />
54.5<br />
¿1.2<br />
66.8<br />
64.0<br />
86.3<br />
21.1<br />
16.7<br />
20.3<br />
21.4<br />
9.4<br />
6.6<br />
4.1<br />
6.4<br />
5.5<br />
5.2<br />
7.8<br />
2.6<br />
1.9<br />
2.6<br />
0.7<br />
1.3<br />
1.6<br />
1.3<br />
2.6<br />
1.9<br />
2.6<br />
10.5<br />
4.5<br />
2.6<br />
2.3<br />
1.0<br />
0.7<br />
1.9<br />
1.6<br />
1.6<br />
3.8<br />
13.1<br />
18.6<br />
310<br />
816<br />
480<br />
408<br />
340<br />
200<br />
480<br />
406<br />
340<br />
272<br />
272<br />
544<br />
272<br />
272<br />
200<br />
200<br />
200<br />
200<br />
272<br />
340<br />
272<br />
272<br />
340<br />
544<br />
408<br />
272<br />
272<br />
406<br />
370<br />
310<br />
370<br />
370<br />
408<br />
370<br />
310<br />
370<br />
370<br />
680<br />
408<br />
544<br />
370<br />
620<br />
620<br />
620<br />
544<br />
620<br />
406<br />
370<br />
310<br />
B50<br />
680<br />
544<br />
N<br />
O<br />
Z<br />
><br />
Z<br />
O<br />
po<br />
H<br />
m<br />
a<br />
w<br />
><br />
><br />
><br />
O<br />
>
1 OASIFIUaON NATURAL<br />
FAO<br />
ÍI974)<br />
Phoeozem háplico<br />
Phaeozem háplico<br />
Phaeozem Mpl ico<br />
Phaeoiem háplico<br />
Rweoiem<br />
Phaeozem lúvíco<br />
Phaeozem lúvíco<br />
Phaeo^m lúv.co<br />
Phoeozem luvico<br />
PtacozM. lúvíco<br />
Phaeozem lúv.co<br />
PhaoOzem lúvíco<br />
Phaeozem col carie o<br />
Phoeozern cal cari co<br />
Cgnbhol<br />
éutnco<br />
Cambisol éutrico<br />
Cambiiol Autrico<br />
ComMtol éuirico<br />
SOIL TAXONOMY (1973)<br />
Hapludol<br />
Ho<br />
Wol<br />
Haplustol<br />
tipleo<br />
Hapludol trpico<br />
Hoplustol<br />
Argiuitol<br />
Argiustol<br />
Arg.ustol<br />
Argiuslol<br />
Arglustol<br />
Arg uitol<br />
Ar^iustol<br />
H- plustol<br />
Hapluslol<br />
Haplustol<br />
Eutropept túpico<br />
Eutrapopt<br />
típica<br />
._..<br />
Horizonte<br />
Al<br />
(B)<br />
C<br />
All<br />
A"<br />
(B)<br />
C<br />
All<br />
AI2<br />
<br />
83<br />
Al<br />
B2<br />
Al<br />
Bl<br />
B2r<br />
c<br />
Al<br />
A3<br />
B2l<br />
Al<br />
(B)<br />
C<br />
Al<br />
11 Al<br />
11(B)<br />
11 CR<br />
Ap<br />
A12<br />
B<br />
C<br />
Ap<br />
AC<br />
C<br />
Al<br />
(B)<br />
CI<br />
C2<br />
Ap<br />
(B)<br />
CI<br />
C2<br />
Al<br />
(B)l<br />
(B)2<br />
CI<br />
C2<br />
Ap<br />
A3<br />
S?<br />
mí.<br />
0- 25<br />
25- BO<br />
80-120<br />
0- 20<br />
20- <strong>45</strong><br />
<strong>45</strong>- 95<br />
95-140<br />
0- 25<br />
25- 40<br />
40-100<br />
100-135<br />
0- 35<br />
35- 75<br />
75-1»<br />
120-160<br />
0-30<br />
30-50<br />
0- 20<br />
20- 60<br />
60- 95<br />
95+130<br />
0--15<br />
15- <strong>45</strong><br />
-5- 75<br />
75- 85<br />
85-140<br />
0- 35<br />
35- 50<br />
50- 95<br />
95-110<br />
0- 20<br />
20- 50<br />
50- 80<br />
80+130<br />
0-30<br />
30- 60<br />
0- 15<br />
15- 35<br />
35- 60<br />
60-120<br />
0- 20<br />
20- 50<br />
50- 65<br />
0- 25<br />
25- 70<br />
70+110<br />
0- 20<br />
20-<strong>45</strong><br />
<strong>45</strong>- 60<br />
60- 80<br />
0- 15<br />
15- <strong>45</strong><br />
A5- 75<br />
75+110<br />
0- 20<br />
20- 40<br />
40- 55<br />
0- 30<br />
30- 40<br />
40- 80<br />
80*140<br />
OASIFKACK IN tuiutu<br />
FAO 0974]<br />
SOU lAXOHOMi<br />
Camblsol éutrtco<br />
i„TO.pt rtplto<br />
Cambhol iuhico<br />
Eufrafwpr ripies<br />
Comboo) «utrfco<br />
Euirapapr Ifpkp<br />
Cambtsol «ulrico<br />
culropept rffnco<br />
ComUiol «utrteo<br />
(H/3)<br />
HdriMll<br />
Ap<br />
B<br />
Cl<br />
Al<br />
AC<br />
CI<br />
Al<br />
(B)<br />
C<br />
Ap<br />
MA<br />
H w<br />
II BC<br />
Al<br />
mi<br />
<br />
Al<br />
(8)1<br />
(B)2g<br />
Al<br />
(6)<br />
C<br />
Ap<br />
A12<br />
B<br />
Al<br />
(B)1<br />
(B)2<br />
All<br />
A12<br />
m<br />
Al<br />
(B)1<br />
(B)2<br />
All<br />
A12<br />
(B)<br />
Al<br />
(B)<br />
C<br />
All<br />
A12<br />
(B)<br />
C<br />
Al<br />
B<br />
Cica<br />
C2CO<br />
AT<br />
II A<br />
IIBca<br />
0- 10 7.5 13.68<br />
10- 40 7.9 14.88<br />
40- 75 7.9 17.52<br />
75+110 7.8 13.52<br />
0- 15 6.4 25.20<br />
15- 30 6.2 22.96<br />
30- 90 6.4 25.04<br />
90+130 6.3 25.04<br />
0- 20 7.3 16.96<br />
20- 50 7.4 13.44<br />
50-110 7.5 13.68<br />
0- 25 5.4 32.72<br />
25- B0 5.2 21.60<br />
60+130 5.1 • 18.44<br />
0- 20 4.9 22.52<br />
20- 35 4.9 20 20<br />
35- 60 5.0 22.64<br />
O- 35 5.9 19 52<br />
35- 55 6-0 14.56<br />
55-110 6.4 8.80<br />
0- 40 4.4 33.20<br />
40- 50 4.9 25.68<br />
50- 70 5.5 13.68<br />
0- 50 5.9 36.28<br />
50- 70 6 5 24.40<br />
70-110 6.7 16.3?<br />
0- 10 5.9 26.64<br />
10- 30 6.0 23.84<br />
30- 60 6.2 14.32<br />
0- 30 6 3 .2.16<br />
30- <strong>45</strong> 6.5 20. Be<br />
<strong>45</strong>+110 6.5 12.26<br />
0- 15 5.i 41.20<br />
15- 30 6.0 36.40<br />
30- 55 6 2 30.48<br />
55+ rfO ó 3 21.20<br />
0- 25 6.5 19.60<br />
25- 55 7.5 17.84<br />
55-110 7 7 6 64<br />
110+140 7.8 10.80<br />
0- 10<br />
15.44<br />
10- 65<br />
33.28<br />
65+130 e!i 8.96<br />
12.00<br />
12.88<br />
15.88<br />
13.95<br />
22.50<br />
21.20<br />
22 40<br />
20.40<br />
15.39<br />
12.05<br />
12.38<br />
12.40<br />
8.60<br />
8.00<br />
8.00<br />
6.80<br />
6.00<br />
8.40<br />
9.80<br />
8.10<br />
12.60<br />
3.80<br />
6.80<br />
14.80<br />
18.60<br />
14.00<br />
18.40<br />
16.60<br />
io eo<br />
22.00<br />
16.40<br />
9.80<br />
22.40<br />
20.40<br />
16.80<br />
16.20<br />
16.SO<br />
16.80<br />
6.4t<br />
10.21<br />
14.13<br />
32.12<br />
B.19<br />
1.33 0.22<br />
1.63 0.21<br />
1.26 0.22<br />
1.28 0.17<br />
1.26 0.14<br />
1.37 0.58<br />
1.42 0.67<br />
1.26 0.6 4<br />
1.14 0.29<br />
1.06 0.23<br />
0.96 0.22<br />
1.<strong>03</strong> 1.72<br />
0.46 0.64<br />
0.44 1.24<br />
0.46 0.22<br />
0.33 0.13<br />
0.21 0.10<br />
0.59 0.30<br />
0.27 0.07<br />
0.19 0.06<br />
0.76 0.70<br />
0.20 0.16<br />
0.14 0.08<br />
0.44 0.29<br />
0.39 0.70<br />
0 69 0.67<br />
0.79 0.36<br />
0.49 0.14<br />
0.27 0.10<br />
0.39 0.05<br />
0.29 0.09<br />
1.18 0.15<br />
1.33 0.84<br />
0.76 0.33<br />
0.49 0.33<br />
1.60 0.66<br />
1.10 0.74<br />
0.56 0.38<br />
0.05 0.10<br />
0.21 0.20<br />
0.84 0.35<br />
0.79 0.13<br />
0.59 0.08<br />
0.13<br />
0.16 1<br />
0.14 '<br />
0.12<br />
0.08<br />
0.10<br />
0.15<br />
0.15,<br />
0.14<br />
0.10<br />
0.12<br />
0.18<br />
0.14<br />
0.16<br />
0.14<br />
0.16<br />
0.16<br />
0.14<br />
0.12<br />
0.08<br />
0.34<br />
0.36<br />
0.10<br />
0.22<br />
0.20<br />
0.12<br />
0.22<br />
0.22<br />
0.11<br />
0.22<br />
0,18<br />
0.10<br />
0.26<br />
0.26<br />
0.26<br />
0.22<br />
0.12<br />
0.10<br />
0.08<br />
0.08<br />
0.12<br />
0.24<br />
0.10<br />
'<br />
100<br />
too<br />
100<br />
100<br />
95<br />
100 '<br />
98<br />
89<br />
100<br />
100<br />
100<br />
47<br />
46<br />
53<br />
39<br />
37<br />
37<br />
48<br />
70<br />
95<br />
37<br />
14<br />
52<br />
43<br />
7f<br />
94<br />
74<br />
73<br />
78<br />
70<br />
74<br />
91<br />
60<br />
59<br />
65<br />
SB<br />
95<br />
too<br />
100<br />
100<br />
100<br />
10O<br />
100<br />
30<br />
24<br />
20<br />
26<br />
24<br />
24<br />
24<br />
22<br />
30<br />
34<br />
36<br />
32<br />
36<br />
68<br />
44<br />
54<br />
56<br />
48<br />
52<br />
48<br />
32<br />
26<br />
28<br />
62<br />
64<br />
64<br />
68<br />
60<br />
24<br />
64<br />
68<br />
82<br />
76<br />
72<br />
76<br />
3B<br />
30<br />
22<br />
16<br />
26<br />
40<br />
48<br />
54<br />
42<br />
44<br />
36<br />
48<br />
30<br />
5<br />
26<br />
26<br />
26<br />
30<br />
24<br />
20<br />
14<br />
36<br />
32<br />
22<br />
40<br />
28<br />
22<br />
56<br />
50<br />
42<br />
28<br />
18<br />
20<br />
20<br />
24<br />
36<br />
30<br />
28<br />
12<br />
16<br />
22<br />
14<br />
30<br />
38<br />
40<br />
50<br />
48<br />
42<br />
36<br />
26<br />
28<br />
32<br />
44<br />
26<br />
46 !<br />
44<br />
48<br />
52<br />
44<br />
40<br />
« Í<br />
44<br />
42<br />
18<br />
IB<br />
14<br />
22<br />
12<br />
20<br />
30<br />
12<br />
24<br />
30<br />
10<br />
18<br />
16<br />
12<br />
16<br />
40<br />
6<br />
4<br />
6<br />
8<br />
6<br />
10<br />
32<br />
32<br />
38<br />
34<br />
26<br />
18<br />
16<br />
20<br />
5<br />
Franco orcillwo<br />
2.00<br />
Franco a re ill «o<br />
2.00<br />
Arcil<strong>la</strong><br />
1.72<br />
Franco<br />
1.56<br />
Arcil<strong>la</strong><br />
3.24<br />
Arcil<strong>la</strong><br />
2.83<br />
Arcil<strong>la</strong><br />
2.89<br />
Arcillo<br />
1.24<br />
Afcll<strong>la</strong> f 3.<strong>45</strong><br />
Franeo anillólo 0.21<br />
Arcillo<br />
5.52<br />
Arcil<strong>la</strong><br />
1.93<br />
Franco aranoso<br />
5.57<br />
Franco<br />
7.<strong>03</strong><br />
Franca aranoso<br />
6.76<br />
Franco arcillo arenoso 0.89<br />
Franco<br />
10.34<br />
Franco<br />
4.W<br />
Franco ore Uto arenoto 0.48<br />
Franca Ihnoso<br />
10.06<br />
Franco II moto<br />
5.58<br />
1.<strong>03</strong><br />
Franca areitMO<br />
7.65<br />
Franco arenoso<br />
3.38<br />
Franco arenoso<br />
0.69<br />
Franco aranoso 6.41<br />
Franco arenoso 5.58<br />
Franco arenco<br />
13.10<br />
6.55<br />
0 21<br />
É<br />
Franco ore!lioso<br />
Franco arcilloso<br />
Franco limoso<br />
Franco<br />
Franca<br />
Franco<br />
Franco are 11 lo arenoso<br />
15.51<br />
12.00<br />
7.<strong>45</strong><br />
0.55<br />
5.72<br />
2.89<br />
0.34<br />
0.14<br />
5.79<br />
8.00<br />
0.28<br />
1.2<br />
1.2<br />
1.0<br />
0.9<br />
1.9<br />
1.6<br />
1.7<br />
0.7<br />
2.0<br />
0.3<br />
0.1<br />
3.2<br />
1.1<br />
3.2<br />
4.1<br />
3í9<br />
0.5<br />
6.0<br />
2.9<br />
0.3<br />
5.9<br />
3.2<br />
06<br />
4.4<br />
2.7<br />
0.4<br />
4.9<br />
3.2<br />
1.6<br />
7.6<br />
3.8<br />
0.1<br />
9.0<br />
7.0<br />
4.3<br />
0.3<br />
3.3<br />
1.7<br />
0.2<br />
0.1<br />
3.4<br />
4.6<br />
0.2<br />
0.098<br />
0.095<br />
0.064<br />
0.076<br />
0.142<br />
0.110<br />
0.090<br />
0.100<br />
0.158<br />
0.026<br />
0.010<br />
0.240<br />
0.093<br />
0.2<strong>45</strong><br />
0.317<br />
0.308<br />
0.<strong>03</strong>9<br />
0.448<br />
0.231<br />
0.023<br />
0.462<br />
0.244<br />
0.047<br />
0.352<br />
0.149<br />
0.<strong>03</strong>2<br />
0.407<br />
0.258<br />
0.130<br />
0.480<br />
0.314<br />
0.008<br />
0.510<br />
0.493<br />
0.344<br />
0.025<br />
0.270<br />
0.135<br />
0.016<br />
0.012<br />
0.234<br />
0.388<br />
0.012<br />
t2<br />
13<br />
12<br />
12<br />
13<br />
14<br />
16<br />
7<br />
13<br />
11<br />
10<br />
13<br />
12<br />
13<br />
13<br />
13<br />
13<br />
13<br />
12<br />
13<br />
12<br />
13<br />
13<br />
12<br />
13<br />
12<br />
12<br />
12<br />
12<br />
16<br />
12<br />
12<br />
18<br />
14<br />
12<br />
12<br />
12<br />
12<br />
12<br />
8<br />
14<br />
12<br />
17<br />
4.76<br />
9.04<br />
8.56<br />
0.19<br />
jj<br />
0.06<br />
0.09<br />
0.06<br />
""<br />
-<br />
jj<br />
"-'<br />
• : :<br />
E<br />
-<br />
19.13<br />
52.83<br />
38.10<br />
34.27<br />
0.09<br />
52.36<br />
5.5<br />
4.4<br />
7.9<br />
11.0<br />
6.6<br />
6.6<br />
13.6<br />
36.1<br />
4.8<br />
1.0<br />
11.7<br />
3.9<br />
1.0<br />
2.6<br />
1.3<br />
1.3<br />
1.9<br />
11.0<br />
14.3<br />
2.7<br />
92.0<br />
92.0<br />
90.0<br />
3.1<br />
2.7<br />
4.4<br />
55.0<br />
60.2<br />
48.4<br />
7.6<br />
6.2<br />
7.2<br />
44.2<br />
8.6<br />
3.4<br />
2.4<br />
1 0<br />
1.7<br />
3.8<br />
22,6<br />
6.2<br />
4.4<br />
544<br />
370<br />
370<br />
408<br />
544<br />
408<br />
340<br />
340<br />
620<br />
680<br />
740<br />
680<br />
406<br />
370<br />
310<br />
408<br />
408<br />
370<br />
370<br />
408<br />
544<br />
370<br />
310<br />
620<br />
408<br />
816<br />
680<br />
408<br />
408<br />
544<br />
408<br />
370<br />
620<br />
544<br />
408<br />
Slfr<br />
680<br />
170<br />
376<br />
620<br />
408<br />
37ri<br />
N<br />
O<br />
Z<br />
><br />
z<br />
o<br />
¡a<br />
H<br />
m<br />
O<br />
w<br />
O<br />
><br />
«•H<br />
><br />
><br />
>
ANKXO V " RCCUUSOS UIDRICOS i'á;;. 11<br />
ANEXO<br />
V<br />
RECURSOS<br />
HIDRICOS<br />
Descargas Medias Mensuales <strong>de</strong> los ríos L<strong>la</strong>ucano, Pomagón, Hualgayoc,<br />
Maygasbamba, Conchano y <strong>de</strong> <strong>la</strong> quebrada Shugar.<br />
Re<strong>la</strong>ción Precipitación - Altitud en <strong>la</strong> cuenca <strong>de</strong> los ríos L<strong>la</strong>ucano,<br />
y Chota no.<br />
Curvas <strong>de</strong> Duración <strong>de</strong> <strong>la</strong> Precipitación Mensual <strong>de</strong> <strong>la</strong>s Estaciones<br />
Hacienda L<strong>la</strong>ucán, Bambamarca, San Juan <strong>de</strong> Lacamaca, Conchan<br />
y Cutervo.<br />
Curvas <strong>de</strong> los Caudales Diarios y <strong>de</strong> Duración Mensual <strong>de</strong> los Cau -<br />
dales Diarios <strong>de</strong>l río L<strong>la</strong>ucano.<br />
C<strong>la</strong>sificación <strong>de</strong> <strong>la</strong>s aguas según el Laboratorio <strong>de</strong> Salinidad<br />
EE. UU. N.A.<br />
<strong>de</strong><br />
Análisis <strong>de</strong> agua <strong>de</strong> <strong>la</strong> cuenca <strong>de</strong> los ríos L<strong>la</strong>ucano y Chotano.<br />
Descargas Medias Mensuales <strong>de</strong>l río Chotano y <strong>de</strong> <strong>la</strong> quebrada Ton<br />
dora.<br />
Curvas <strong>de</strong> Duración <strong>de</strong> <strong>la</strong> Precipitación Mensual <strong>de</strong> <strong>la</strong>s Estaciones<br />
<strong>de</strong> Chota y Cochabamba.<br />
Curvas <strong>de</strong> los Caudales Diarios y <strong>de</strong> Duración M3nsual <strong>de</strong> los Caudales<br />
Diarios <strong>de</strong>l río Chotano.<br />
Manantiales Inventariados en los sectores Hualgayoc, Chota y Cu -<br />
tervo.<br />
Evapotranspiración potencial estimada ( Fórmu<strong>la</strong> B<strong>la</strong>nney & Criddie)<br />
Para <strong>la</strong>s estaciones <strong>de</strong> Bambamarca, Chota, Cochabaml"! y Cutervo.<br />
— 0 —
CUADRO N 0 1<br />
DESCARGA MEDIA MENSUAL DEL RIO LLAUCANO EN LLAUCANO-DERIVACION<br />
(m3/seg.)<br />
Año<br />
Oct,<br />
Nov,<br />
Die,<br />
Ene.<br />
Feb.<br />
Mar.<br />
Abr.<br />
May.<br />
Jun.<br />
Jul.<br />
Ago.<br />
Set,<br />
Anual<br />
1963-64<br />
1964-65<br />
1965-66<br />
1966-67<br />
1967-68<br />
1968-69<br />
1969-70<br />
1970-71<br />
1971 -72<br />
1972-73<br />
1.50<br />
3.43<br />
6.55<br />
5.86<br />
3,50<br />
5,69<br />
2.<strong>45</strong><br />
4.79<br />
5.59<br />
1.82<br />
5.61<br />
8,64<br />
10.35<br />
5.00<br />
4,28<br />
3.46<br />
10.54<br />
14.17<br />
8J1<br />
3.21<br />
12.32<br />
4 0 81<br />
6.68<br />
2.42<br />
4.12<br />
2.11<br />
12.98<br />
13,74<br />
10,61<br />
5.79<br />
7.71<br />
4.<strong>45</strong><br />
11.56<br />
5.89<br />
3.72<br />
4.08<br />
8 0 44<br />
8,88<br />
6.67<br />
6.92<br />
7.09<br />
4.54<br />
5.13<br />
19.68<br />
6,87<br />
7.07<br />
7.06<br />
12.99<br />
5 e 66<br />
6.70<br />
6.07<br />
15.74<br />
4.25<br />
16.13<br />
13.21<br />
5.27<br />
9,73<br />
28.20<br />
18.58<br />
10.18<br />
7.26<br />
11.99<br />
4.43<br />
9,06<br />
2.72<br />
12.80<br />
8,93<br />
23.36<br />
17.72<br />
25.98<br />
3.28<br />
6,74<br />
3.79<br />
4.23<br />
2.24<br />
2,07<br />
7.70<br />
7.10<br />
8.88<br />
5.53<br />
2.09<br />
1.95<br />
1.51<br />
1.93<br />
1.25<br />
1.59<br />
2.80<br />
5.05<br />
3.84<br />
2.47<br />
1.30<br />
1.34<br />
1.09<br />
1.33<br />
0.74<br />
0.78<br />
1.49<br />
1.77<br />
1.93<br />
2.57<br />
1.48<br />
0.80<br />
0.74<br />
0.95<br />
0.70<br />
0.54<br />
0.98<br />
1.25<br />
1.14<br />
2,76<br />
1.07<br />
1.09<br />
0.88<br />
1.04<br />
1.71<br />
0,50<br />
0.97<br />
1.10<br />
1.25<br />
7.14<br />
4.73<br />
5,46<br />
4.75<br />
6<strong>03</strong><br />
3.75<br />
3,80<br />
6.17<br />
10.17<br />
7.50<br />
6.72
CUADRO N 0 2<br />
DESCARGA \4EDIA MENSUAL DEL PJO POM'.GCN FN' POMAGCN<br />
(mS/seg/<br />
Año Oct, Nov,<br />
i<br />
Die, J Ene. Feb,<br />
1<br />
Mar.<br />
Abr.<br />
1<br />
J May.<br />
!<br />
Jun.<br />
1<br />
Jul.<br />
Ago- | Set.<br />
Anual<br />
1963-64<br />
1964-65<br />
1965-66<br />
1966-67<br />
1967-68<br />
1968-69<br />
1969-70<br />
1970-71<br />
1971 -72<br />
1972-73<br />
0-21<br />
0,65<br />
1.28<br />
0.96<br />
0,55<br />
1.42<br />
0.19<br />
0 16<br />
2,44<br />
0,57<br />
0.91<br />
1 75<br />
2,37<br />
1 .34<br />
0.72<br />
0.71<br />
0,57<br />
4,37<br />
3.56<br />
0.97<br />
3.52<br />
1.32<br />
2.7C<br />
0.77<br />
0,60<br />
0 58<br />
0 76<br />
5.27<br />
5,35<br />
2.54<br />
2.46<br />
1.77<br />
3.74<br />
1 .56<br />
0 97<br />
1,18<br />
1,73<br />
3 08<br />
1.80<br />
2.55<br />
2.36<br />
1,46<br />
K66<br />
6.94<br />
2.64<br />
2 94<br />
1,98<br />
4 16<br />
1 23<br />
2,25<br />
1 .93<br />
6.<strong>03</strong><br />
1 .26<br />
4 47<br />
4.30<br />
1.49<br />
2.-;5<br />
9.06<br />
10.27<br />
3.42<br />
2.04<br />
3.70<br />
0.57<br />
2,50<br />
0,72<br />
3.64<br />
2.24<br />
4 47<br />
4.77<br />
6.01<br />
0.91<br />
1.14<br />
0.68<br />
1,78<br />
0.64<br />
0.40<br />
1.57<br />
1.44<br />
2.67<br />
0.88<br />
0.30<br />
0,21<br />
0.14<br />
0.53<br />
0.28<br />
0.25<br />
0.88<br />
1.04<br />
0.73<br />
0,40<br />
0.01<br />
0 06<br />
0,06<br />
0,22<br />
0.02<br />
0.33<br />
0.29<br />
0.18<br />
0,14<br />
0,26<br />
OJO<br />
0.00<br />
0.02<br />
0.09<br />
0.<strong>03</strong><br />
0 13<br />
0.<strong>03</strong><br />
0.06<br />
0,06<br />
0,46<br />
0.12<br />
0.07<br />
0.02<br />
0.02<br />
0,27<br />
0.02<br />
0.02<br />
0.06<br />
0,22<br />
0,74<br />
1.24<br />
1.51<br />
1 .21<br />
1.73<br />
0.98<br />
1 ,C8<br />
1.05<br />
2.77<br />
2,73<br />
1.75
CUADRO N 0 3<br />
DESCARGA MEDIA MENSUAL DEL RIO HUALGAYOC EN HUALGAYOC<br />
(m3/seg,)<br />
Año<br />
Oct,<br />
Nov.<br />
Die.<br />
Ene,<br />
Feb.<br />
Mar,<br />
Abr,<br />
May,<br />
Jun,<br />
Jul,<br />
Ago,<br />
Set,<br />
Anuall<br />
1965-66<br />
1966-67<br />
1967-68<br />
1968-69<br />
1969-70<br />
1970-71<br />
1971-72<br />
1972-73<br />
0,81<br />
0,64<br />
0.49<br />
0,86<br />
0,28<br />
0,83<br />
0.62<br />
0.31<br />
1,48<br />
0,43<br />
0,67<br />
0.56<br />
0,65<br />
1,14<br />
1 ,10<br />
0,53<br />
0,71<br />
0,26<br />
0,63<br />
0,30<br />
0,86<br />
2.24<br />
0,93<br />
1.09<br />
1.19<br />
0,62<br />
0 o 46<br />
0,65<br />
0.90<br />
U3<br />
0„80<br />
1,07<br />
0,69<br />
1,52<br />
0,76<br />
l e 00<br />
0,71<br />
1.59<br />
0,68<br />
1.01<br />
0,72<br />
K62<br />
1,34<br />
0,80<br />
1.23<br />
3,92<br />
2.29<br />
1,24<br />
0,57<br />
1.15<br />
0.55<br />
1.43<br />
1,14<br />
3,16<br />
1,68<br />
3.18<br />
0,56<br />
0,74<br />
0,43<br />
0.43<br />
1,28<br />
1.07<br />
0,98<br />
0.70<br />
0,28<br />
0,42<br />
0 o 31<br />
0.28<br />
0,47<br />
0.66<br />
0.41<br />
0,37<br />
0.17<br />
0,35<br />
0,14<br />
0.14<br />
0,34<br />
0.31<br />
0,24<br />
0.32<br />
0.16<br />
0,29<br />
0,15<br />
OJO<br />
0,16<br />
0,20<br />
0,20<br />
0.38<br />
0.17<br />
0,30<br />
0,42<br />
0,08<br />
0.20<br />
0.16<br />
0.27<br />
0.76<br />
0,63<br />
0,69<br />
0,53<br />
0,55<br />
0,69<br />
1.37<br />
0,85<br />
0.91<br />
N<br />
O<br />
Z<br />
><br />
z<br />
o<br />
a<br />
n<br />
><br />
><br />
>
CUADRO N 0 4<br />
DESCARGA MEDIA MENSUAL DEL RIO LLAUCANO EN CORELLAMA<br />
(m3/seg.)<br />
Año<br />
1963-64<br />
1964-65<br />
1965-66<br />
1966-67<br />
, 1967-68<br />
1968-69<br />
| 1969-70<br />
1970-71<br />
1971-72<br />
' 1972-73<br />
Oct.<br />
2,07<br />
4.11<br />
10,87<br />
8.78<br />
4.72<br />
8.44<br />
2.82<br />
6,44<br />
6 82<br />
3,04<br />
Nov,<br />
6,19<br />
11 ,01<br />
15,83<br />
8.87<br />
4.78<br />
5,11<br />
12,06<br />
19,72<br />
10,82<br />
5*30<br />
Die<br />
17,46<br />
6 25<br />
10 71<br />
4,88<br />
4,39<br />
2 92<br />
14.81<br />
22.39<br />
18,37<br />
10,78<br />
Ene.<br />
10.91<br />
6,68<br />
17.31<br />
8.80<br />
5,37<br />
5,80<br />
11.12<br />
13.86<br />
9.29<br />
11 ,97<br />
¡<br />
Feb.<br />
10.36<br />
bM<br />
8 96<br />
25 2?<br />
11 ,53<br />
11 56<br />
9 76<br />
!9.50<br />
8,14<br />
11,10<br />
Mar.<br />
9,57<br />
24 04<br />
7.39<br />
23 83<br />
20,29<br />
7 78<br />
12.30<br />
43 71<br />
37.15<br />
16,38<br />
Abr.<br />
li .56<br />
17,26<br />
7,14<br />
13.77<br />
3.48<br />
17,60<br />
10,93<br />
31 .48<br />
26,87<br />
34.-9<br />
I —<br />
May , Jun .<br />
—i<br />
5,31<br />
8.42<br />
6,54<br />
7.32<br />
3,49<br />
3.12<br />
9,44<br />
10.39<br />
12,62<br />
7,20<br />
3.11<br />
2 12<br />
1 96<br />
2.71<br />
1 .38<br />
2.08<br />
3.74<br />
7,50<br />
4.17<br />
3.60<br />
Jul. i Ago,<br />
1.69 1,84<br />
1,41 1,10<br />
1.31 1 13<br />
2.01 \ 1 .27<br />
1.02 i 0.91<br />
1,08 ! 0.78<br />
1.91 i 1,04<br />
2,67 ' 1 .47<br />
2.29 I 1.48<br />
3,35 1 3 94
CUADRO N 0 5<br />
DESCARGA MEDIA MENSUAL DEL RIO MAYGASBAMBA EN MAYGASBAMBA PUENTE<br />
(m3/seg.)<br />
Año<br />
1963-64<br />
1964-65<br />
1965-66<br />
1966-67<br />
1967-68<br />
1968-69<br />
1969-70<br />
1970-71<br />
1971-72<br />
1972-73<br />
Oct.<br />
0.58<br />
0.62<br />
1.69<br />
2.44<br />
1.04<br />
1.57<br />
1.01<br />
1.60<br />
1.16<br />
0.98<br />
Nov.<br />
1.75<br />
1.46<br />
3.23<br />
1.64<br />
1,09<br />
0.86<br />
2.31<br />
2.81<br />
2.76<br />
1.68<br />
Die.<br />
3.73<br />
0 o 76<br />
1.30<br />
0.31<br />
0.85<br />
0.33<br />
3.82<br />
5.07<br />
3.13<br />
2.34<br />
Ene.<br />
2.75<br />
0.91<br />
2.91<br />
1.98<br />
0.84<br />
0.57<br />
4.49<br />
3.44<br />
2.09<br />
1.85<br />
Feb.<br />
3.35<br />
1.46<br />
1.51<br />
5.60<br />
1.27<br />
1.30<br />
4.00<br />
3.84<br />
1.36<br />
1.89<br />
Mar.<br />
2.43<br />
5.17<br />
1.57<br />
4.87<br />
3.53<br />
1.70<br />
4.48<br />
10.81<br />
4.23<br />
2.91<br />
Abr.<br />
2,70<br />
3.70<br />
1.02<br />
2.41<br />
0.79<br />
4.47<br />
4.<strong>45</strong><br />
6.08<br />
3.28<br />
8.23<br />
May.<br />
1.25<br />
1.39<br />
1.16<br />
1.14<br />
0.67<br />
0.71<br />
3.69<br />
2.38<br />
2.20<br />
1.42<br />
Jun.<br />
0.57<br />
0,51<br />
0.43<br />
0,78<br />
0,35<br />
0,<strong>45</strong><br />
0.86<br />
1.50<br />
1.02<br />
0.93<br />
Jul.<br />
0.39<br />
0.42<br />
0.24<br />
0.48<br />
0.21<br />
0.21<br />
0.62<br />
0.67<br />
0.54<br />
0,83<br />
Ago.<br />
0,51<br />
0.24<br />
0.15<br />
0.25<br />
0.19<br />
0.19<br />
0.34<br />
0.44<br />
0.39<br />
0.85<br />
Set.<br />
0.38<br />
0.38<br />
0.16<br />
0.27<br />
0,37<br />
0.18<br />
0.34<br />
0.34<br />
0.69<br />
1.74<br />
Anual<br />
1.70<br />
1.42<br />
1.28<br />
1.82<br />
0,91<br />
1.04<br />
2.53<br />
3.25<br />
1.91<br />
2.13<br />
N<br />
O<br />
Z<br />
><br />
z<br />
o<br />
7a<br />
H<br />
tu<br />
a<br />
ro<br />
O<br />
>
CUADRO N 0 6<br />
DESCARGA MEDIA MENSUAL DE LA QUEBRADA SHUGAR EN QUEBRADA SHUGAR<br />
(m3/seg,)<br />
Año<br />
Oct,<br />
Nov<br />
Die.<br />
Ene,<br />
Feb.<br />
Mar,<br />
Abr.<br />
May.<br />
Jun<br />
Jul,<br />
Ago.<br />
Set.<br />
Anual<br />
1<br />
1963-64<br />
1964-65<br />
1965-66<br />
1966-67<br />
1967-68<br />
1968-69<br />
1969=70<br />
1970-71<br />
1971-72<br />
1972-73<br />
0.24<br />
1.35<br />
1.35<br />
2.19<br />
lo49<br />
2,93<br />
0.22<br />
0 S 71<br />
1,25<br />
1,48<br />
099<br />
2,24<br />
3,52<br />
1,88<br />
1.66<br />
0,99<br />
2,13<br />
2.19<br />
1,70<br />
2 39<br />
1.95<br />
1.30<br />
1.40<br />
0.48<br />
1.65<br />
0,28<br />
4-08<br />
2.17<br />
119<br />
3.83<br />
UO<br />
1.11<br />
2.18<br />
3,<strong>03</strong><br />
1.06<br />
1 10<br />
2,61<br />
2.14<br />
0,96<br />
3,13<br />
2,09<br />
2.80<br />
1 72<br />
2,89<br />
1 36<br />
2 17<br />
1,71<br />
181<br />
0,95<br />
2 20<br />
1.78<br />
6.04<br />
0,75<br />
4 t 60<br />
302<br />
1 73<br />
2,<strong>45</strong><br />
5.91<br />
4.93<br />
3.42<br />
1,88<br />
3 54<br />
0,61<br />
2.80<br />
0,46<br />
2,8^<br />
4.29<br />
3.68<br />
3.69<br />
4,66<br />
0 74<br />
0,67<br />
0.96<br />
0.70<br />
0 54<br />
0.30<br />
2 90<br />
1 .30<br />
1.58<br />
0.75<br />
0 18<br />
0.14<br />
0 13<br />
0.22<br />
0 10<br />
0.14<br />
0 50<br />
0.86<br />
0,42<br />
0.44<br />
0 14<br />
0.06<br />
0.04<br />
oao<br />
002<br />
0.08<br />
0 30<br />
0.24<br />
0.13<br />
024<br />
0 25<br />
0.00<br />
0.02<br />
0.06<br />
0.02<br />
0<strong>03</strong><br />
002<br />
0,07<br />
0.06<br />
0.43<br />
0 55<br />
OJO<br />
0.<strong>03</strong><br />
0.08<br />
0.07<br />
0.02<br />
002<br />
005<br />
0.77<br />
0.60<br />
0 98<br />
1 .60<br />
1 05<br />
1.58<br />
0.96<br />
1 .04 i<br />
1.77<br />
1.76 ¡<br />
1.47 ¡<br />
1,96 |
CUADRO N 0 7<br />
DESCARGA MEDIA MENSUAL DEL RIO CCNCHANO EN CONCHANO-DERIVACION<br />
(m3/seg,)<br />
Año Oct, Nov, Die, Éneo Feb, Mar, Abr. May. Jun.<br />
.. _<br />
1963-64<br />
1964-65<br />
1965-66<br />
1966-67<br />
1 967-68<br />
1968-69<br />
1969-70<br />
1970-71<br />
1971-72<br />
1972-73<br />
1.02<br />
3.55<br />
3.72<br />
2,21<br />
2.49<br />
4,89<br />
1.94<br />
2,48<br />
3.44<br />
0,96<br />
1.60<br />
5.89<br />
4.82<br />
2,20<br />
2,72<br />
3,46<br />
3.63<br />
4.00<br />
3.32<br />
2,38<br />
5.18<br />
2,08<br />
2,28<br />
2,42<br />
1.16<br />
1,07<br />
5.69<br />
4.82<br />
2,78<br />
4,23<br />
5.37<br />
1,26<br />
5,69<br />
2,93<br />
1,53<br />
2.04<br />
3,49<br />
4,20<br />
3.11<br />
3.19<br />
5.36<br />
2,59<br />
2,99<br />
6.07<br />
2,18<br />
2,40<br />
2,42<br />
8,52<br />
3.19<br />
2.01<br />
4.15<br />
6,69<br />
3,59<br />
6.42<br />
5.50<br />
4.<strong>03</strong><br />
4,56<br />
18,32<br />
7,22<br />
3.48<br />
6.18<br />
5,70<br />
?.81<br />
3.12<br />
1.41<br />
8J1<br />
4.50<br />
12,23<br />
5.55<br />
7.28<br />
3.17<br />
3.42<br />
4.10<br />
1.97<br />
1 .17<br />
2.11<br />
4.75<br />
6.44<br />
3.09<br />
2.57<br />
1.66<br />
1.29<br />
1.41<br />
1.56<br />
0.60<br />
0.92<br />
2.04<br />
4.95<br />
1,59<br />
1,57<br />
Jul, Ago, Set, Anual<br />
1.38<br />
1,29<br />
1.11<br />
1.05<br />
0,42<br />
0.58<br />
1.29<br />
1,69<br />
0.81<br />
1.79<br />
2.14<br />
1.00<br />
0,94<br />
0.88<br />
0,39<br />
0.36<br />
0,70<br />
1.00<br />
0.38<br />
1.82<br />
1.78<br />
1,53<br />
0,86<br />
0,81<br />
1.47<br />
0,41<br />
0.68<br />
0.73<br />
1.24<br />
2.57<br />
3.24<br />
3.02<br />
2.86<br />
2.62<br />
1.75<br />
2.52<br />
2,98<br />
5.76<br />
2.98<br />
2.82
CUADRO N 0 8<br />
DESCARGA MEDIA MENSUAL DEL RIO CONCHANO EN CONCHANO-PUENTE<br />
(m3/seg.)<br />
Año<br />
1958-59<br />
1959-60<br />
1960-61<br />
1961-62<br />
1962-63<br />
1963-64<br />
1964-65<br />
1965-66<br />
1966-67<br />
1967-68<br />
1968-69<br />
1969-70<br />
1970-71<br />
1971-72<br />
! 1972-73<br />
Oct.<br />
2,18<br />
2.07<br />
1.12<br />
1,43<br />
0,65<br />
0.91<br />
3,30<br />
3.66<br />
3.96<br />
2.62<br />
5.07<br />
2.14<br />
2.84<br />
3,81<br />
1.08<br />
Nov.<br />
1.74<br />
2,71<br />
2.65<br />
U50<br />
S,D,<br />
2,68<br />
6,63<br />
5.82<br />
3,18<br />
2.<strong>03</strong><br />
3.58<br />
3,83<br />
4.25<br />
3,<strong>45</strong><br />
2.63<br />
Die,<br />
0,73<br />
3,39<br />
2,04<br />
2 81<br />
S.D<br />
4.40<br />
2.64<br />
2,26<br />
1,91<br />
1.46<br />
1,30<br />
5,42<br />
5.02<br />
3,11<br />
5.29<br />
Ene.<br />
1,00<br />
3.54<br />
3.52<br />
4,81<br />
1.36<br />
3,86<br />
2,02<br />
4.. 97<br />
3.<strong>45</strong><br />
2.11<br />
2.20<br />
3.57<br />
4.59<br />
3.56<br />
4.22<br />
Feb,<br />
3.44<br />
5.02<br />
3,31<br />
7.73<br />
1,86<br />
4.83<br />
3 26<br />
2,90<br />
6.<strong>45</strong><br />
2,64<br />
2,71<br />
2.48<br />
8.87<br />
3„63<br />
2.72<br />
Mar,<br />
5.70<br />
5.01<br />
4.85<br />
5,84<br />
5,58<br />
4.34<br />
7,13<br />
3,35<br />
6,76<br />
5.18<br />
4,53<br />
4,66<br />
18.67<br />
7.81<br />
4.17<br />
Abr,<br />
6.77<br />
7.02<br />
4,77<br />
5.95<br />
5,14<br />
6,38<br />
6.83<br />
2.65<br />
2.84<br />
2.11<br />
8.43<br />
4,87<br />
13,87<br />
6.09<br />
10,64<br />
May,<br />
4,<strong>45</strong><br />
5„32<br />
3.89<br />
2,73<br />
3,32<br />
3,13<br />
3,29<br />
4,14<br />
1,82<br />
1.54<br />
2,26<br />
5,88<br />
6.76<br />
3.63<br />
3.33<br />
Jun,<br />
2.46<br />
2,16<br />
2.19<br />
1,58<br />
1.42<br />
1,83<br />
1.33<br />
1.61<br />
1.56<br />
1 ,16<br />
1 ,53<br />
2,50<br />
5.40<br />
1.87<br />
2,24<br />
Jul,<br />
1,60<br />
1,22<br />
1,34<br />
1,12<br />
0.76<br />
1.30<br />
1,12<br />
0,98<br />
1,18<br />
0,68<br />
0,97<br />
1.68<br />
2.43<br />
1.14<br />
2.42<br />
Ago,<br />
1 .08<br />
0.95<br />
1.00<br />
0,89<br />
0.53<br />
2.<strong>03</strong><br />
0.81<br />
0.72<br />
0.70<br />
0,62<br />
0,70<br />
1.04<br />
1.26<br />
0.78<br />
2.41<br />
Set.<br />
0 83<br />
0,82<br />
0,89<br />
0,71<br />
0.44<br />
1 .81<br />
1.46<br />
0.60<br />
0.56<br />
1 .97<br />
0,79<br />
0,90<br />
0,90<br />
1.54<br />
3.40<br />
Anua!<br />
2,66<br />
3,26<br />
2,63<br />
3.06<br />
3,08<br />
3.31<br />
2,81<br />
2,84<br />
2,01<br />
2,83<br />
3.26<br />
6,22<br />
3.37<br />
3,71
1500<br />
CUENCA DE LOS RÍOS LLAUCANO Y CHOTANO<br />
RELACIÓN PRECIPITACIÓN - ALTITUD<br />
Gráfico N o 1<br />
s<br />
«o<br />
o<br />
1000<br />
Chotano<br />
CUENCA<br />
ESTACIÓN<br />
PRECIPITA<br />
CION ( mm.)<br />
Chotano<br />
1.-<br />
Cochabamba<br />
815<br />
Chotano<br />
2.-<br />
Lajas<br />
983<br />
500<br />
Chotano<br />
L<strong>la</strong>ucano<br />
L<strong>la</strong>ucano<br />
L<strong>la</strong>ucano<br />
L<strong>la</strong>ucano<br />
L<strong>la</strong>ucano<br />
L<strong>la</strong>ucano<br />
L<strong>la</strong>ucano<br />
L<strong>la</strong>ucano<br />
Chotano<br />
L<strong>la</strong>ucana<br />
L<strong>la</strong>ucano<br />
3.-<br />
4.-<br />
5.-<br />
6.-<br />
7.-<br />
8.-<br />
9.-<br />
10.-<br />
II.-<br />
12.-<br />
13.-<br />
14.-<br />
Cho<strong>la</strong><br />
Conchan<br />
Bamba marca<br />
L<strong>la</strong>ucán<br />
L<strong>la</strong>ucano - Tororco<br />
La Llica<br />
San Juan <strong>de</strong> Lacamara<br />
Cutervo<br />
Oda. Shugar<br />
Zamangay<br />
Hualgayoc<br />
Negritos<br />
958<br />
965<br />
756<br />
681<br />
748<br />
891<br />
899<br />
929<br />
1069<br />
10<strong>03</strong><br />
1449<br />
1075<br />
N<br />
O<br />
z<br />
><br />
z<br />
o<br />
;o<br />
H<br />
tn<br />
a<br />
tu<br />
O<br />
><br />
><br />
><br />
1500 2000 ?50n<br />
>
CURVA DE DURACIÓN DE LA PRECIPITACIÓN MENSUAL<br />
><br />
5S<br />
pn<br />
x<br />
o<br />
ESTACIÓN " LLAUCAN "<br />
50<br />
m<br />
Ci<br />
G<br />
po<br />
en<br />
O<br />
en<br />
Gráfico N 0 2<br />
2(0<br />
240 -<br />
220-<br />
Enero<br />
Setiembre<br />
Marzo<br />
Julio<br />
Noviembre<br />
O<br />
jo<br />
n<br />
o<br />
en<br />
200-<br />
Febrero<br />
Jumo<br />
Octubre<br />
Abril<br />
Agosto<br />
Diciembre<br />
c<br />
c<br />
\2<br />
'G<br />
o<br />
4-<br />
'5<br />
0)<br />
a.<br />
180-<br />
160-<br />
140-<br />
120-<br />
100-<br />
80-<br />
60-<br />
40-<br />
20 4<br />
Probabi lida<strong>de</strong>s %<br />
|4<br />
y<br />
era
\<br />
M *U 'I<br />
\K<br />
ESTACIÓN " BAMBAMARGA "<br />
Gráfico N" 3<br />
Enero<br />
Marzo<br />
Jgllp . -<br />
Setlmbre<br />
Noviembre '<br />
Febrera<br />
Jumo<br />
Octubre<br />
Abril<br />
Agorto<br />
Diciembre<br />
J L U^-<br />
10 2 0 3 0 4 O 5 0 6 O 7 0 8 0 9 O 1 0 O 1 0 2 0 3 0 4 0 3 0 í 0 7 0 8 0 9 O 1 0 O l O 2 0 3 0 « J 5 0 6 O 7 O B 0 9 O ) 0 0<br />
Probabilida<strong>de</strong>s %
CURVA DEDURACION DE LA PRECIPITACIÓN MENSUAL<br />
ESTACIÓN<br />
"SAN JUAN DE LACAMACA"<br />
280<br />
Gráfico N 0 4<br />
260<br />
240<br />
220<br />
200<br />
180<br />
Enero<br />
Setiembre<br />
Febrero<br />
Jim in<br />
Octubre<br />
Marzo<br />
Julio<br />
Noviembre<br />
Abril<br />
Diciembre<br />
140<br />
100<br />
80<br />
40<br />
20 -<br />
0 H 1 i 1 1-<br />
O 1 0 2 O 3 0 4 O 5 O 6 O 7 O 8 0 9 0 100 10 2 0 3 O 4 0 5 0 Ó 0 7 0 8 O 9 0 1O0 10 2 O 3 O 4 O 3 0 6 0 7 O 8 0 9 O 1 0 0<br />
Probabilida<strong>de</strong>s %
CURVA DE DURACIÓN DE LA PRECIPITACIÓN MENSUAL<br />
te<br />
OQ<br />
£<br />
ESTACIÓN " CONCHAN "<br />
320<br />
Gráfico NOS<br />
300<br />
280<br />
260<br />
240 -<br />
220<br />
Enero<br />
Wnyn<br />
Setiembre<br />
Febrero<br />
Jumo<br />
Octubre<br />
Marzo<br />
Julio<br />
Noviembre<br />
Abril<br />
Diciembre<br />
200 -<br />
<br />
z<br />
o<br />
H<br />
m<br />
O<br />
tn<br />
O<br />
><br />
(—i<br />
>•<br />
><br />
JO<br />
O<br />
>
CURVA DE DURACIÓN DE LA PRECIPITACIÓN MENSUAL<br />
><br />
Z<br />
m<br />
X<br />
O<br />
280-<br />
ESTACIÓN " CUTERVO "<br />
Gráfico N" 6<br />
7)<br />
m<br />
n<br />
c<br />
TO<br />
U)<br />
O<br />
Vi<br />
?«<br />
240<br />
220<br />
Enero<br />
Setiembre<br />
Marzo<br />
Julio<br />
Noviembre<br />
O<br />
i—i<br />
n<br />
o<br />
Febrero<br />
Abril<br />
200-<br />
Jumo<br />
Agosto<br />
180<br />
Octubre<br />
Diciembre<br />
c<br />
9)<br />
J<br />
O<br />
2.<br />
'a.<br />
'o<br />
C<br />
00 -<br />
40 -<br />
160<br />
140-<br />
120<br />
100 -<br />
80-<br />
20-<br />
9-<br />
—i 1 1 1 1 1 1 } 1 1 1 1 n 1 1 1 1 ; 1 1 1 i • 1 i 1—'—r<br />
10 20 30 4 0 5 0 6 0 7 0 8 0 5 0 100 10 2 0 3 0 4 0 5 0 6 0 7 0 8 0 9 0 100 10 2 0 3 0 4 0 5 0 6 0 70 8 0 9 0 100<br />
Probabilida<strong>de</strong>s %<br />
13<br />
00<br />
en
CURVAS DE LOS CAUDALES DIARIOS<br />
RIO LLAUCANO EN CORELLAMA<br />
Gráfico N 0 7<br />
N<br />
O<br />
Z<br />
><br />
60 -<br />
Q.Máx.= 129.05 m 3 /seg.<br />
Q. Mm. = 0.69m 3 /seg.<br />
Q.Prom.» 9.15tn 3 /seg.<br />
40<br />
o<br />
-o<br />
o<br />
30<br />
ja<br />
"5<br />
-o<br />
3 x<br />
20<br />
v x<br />
i' "¡-st<br />
0 _<br />
^<br />
^<br />
-<br />
20 30<br />
Duración en %<br />
40<br />
Viüa.<br />
10 15<br />
Frecuencia en %
CURVAS DE DURACIÓN MENSUAL DE LOS CAUDALES DIARIOS<br />
RIO LLAUCANO EN CORELLAMA Gráfico N» 8<br />
ENIBO<br />
FEBRERO<br />
MARZO<br />
ABRIL<br />
MAYO<br />
JUNJO<br />
100 % Tm = 310 dios<br />
100%Tm=283dras<br />
100%Tm=310dras<br />
100%Tm=300dras<br />
100%Tm=310dras<br />
100%Tm = 300dras<br />
Max. = 56.00 m 3 /seg.<br />
Mix. = 129.05 m 3/seg.<br />
Mix. = 107.27 m 3/seg.<br />
Mix. = 104.12 m 3/seg.<br />
Max. = 35.00 m3/seg.<br />
Max.» 16.35<br />
m 3 /¡eg.<br />
Mlh. = 1.13m3/se8.<br />
Mrn. = 2.28m3/ieg.<br />
Mrn. =3.75 m 3/seg.<br />
Mm. = 2.27 m 3/seg.<br />
Mrn.= 1.53m 3 /seg.<br />
Mlh. =0.98m 3 /seg.<br />
\<br />
p<br />
•<br />
^<br />
\<br />
\ Q= 20.24 m 3/seg.<br />
\ Q= 17.48 m 3/seg.<br />
•<br />
\ 5=12.301713/^.<br />
\ ^ ^ 5 = 10.11 in 3 /ie9.<br />
\^^^^ Q = 7.3» m 3 /seg.<br />
^ \ _ ^ ^ ^ ^<br />
.... F ! ! r<br />
\ ^ ^ ^ Q=3.24m 3 /seg.<br />
1 I •••1 1 1 •••••i T 1 1—H 1 1 1 1 1 1 1 1 1 '<br />
0 2 0 4 0 6 0 8 0 0 2 O 4 O 6 0 8 0 0 2 0 4 O 6 0 8 0 0 2 0 4 O é O 8 0 0 2 O 4 O 6 O 8 0 0 20 4 0 6 0 8 0 100<br />
Duración en %<br />
JULIO AGOSTO SETIEMBRE OCTUBRE NOVIEMBRE DICIEMBRE<br />
100 % Tm = 310 Mas<br />
100%Tm=310dra5<br />
100%Tm=300dras<br />
100%Tm = 310dras<br />
100 % Tm = 300 dTos<br />
100%Tm = J10dras<br />
Mix. = 11.18 m 3 /seg.<br />
Mix. = 11.74 m 3 /seg.<br />
M6x. = 40.47 m 3 /seg.<br />
Max. = 55.00 m 3 /seg.<br />
Mix. = 55.58 m 3 /seg.<br />
Max. = 77.05 m 3 /seg.<br />
Mrn. = 0.80rn 3 /seg.<br />
Mrn.=0.79m 3 /seg.<br />
Mm. = 0.69 m 3 /seg.<br />
Mih. = 0.78m 3 /seg.<br />
Mlh. = 1.09m 3 /seg.<br />
Mlh. = 1.75
Pág, 98 ZONA NORTE DE CAJAMARCA<br />
CUADRO N° 9<br />
CLASIFICACIÓN DE LAS AGUAS SEGÚN EL LABORATORIO DE SALINIDAD DE LOS EE. UU- N. A,<br />
A . SEGÚN EL CONTENIDO DE SA LES;<br />
CI<br />
Salinidad baja (0.00-0.25 mmhos)<br />
C2 Salinidad mo<strong>de</strong>rada (0,25-0.75<br />
mmhos )<br />
C3 Salinidad entre media y alta (0 75 -<br />
2,25 mmhos )<br />
C4 Salinidad alta (2.25 - 4.00 mmhos )<br />
C5<br />
Salinidad muy alta (4.00-6.00mmhos)<br />
C6 Salinidad excesiva(más <strong>de</strong> 6.00mmhos)<br />
B. SEGÚN EL CONTENIDO DE SODIO;<br />
51 Poco sódica<br />
52 Media sódica<br />
S3<br />
S4<br />
Muy sódica<br />
Excesivamente sódica<br />
Buenas para riego <strong>de</strong> diferentes cultivos. Solo peligro <strong>de</strong><br />
salinízación <strong>de</strong> suelos muy permeables <strong>de</strong> difícil drenaje in<br />
temo.<br />
De calidad buena paca cultivos que se adaptan o toleranmo<br />
<strong>de</strong>radamente <strong>la</strong> sal. Peligro para p<strong>la</strong>ntas muy sensibles y<br />
suelos impermeables,<br />
El cultivo selec<br />
El suelo <strong>de</strong>be tener buena permeabilidad.<br />
cionado <strong>de</strong>be ser tolerante a <strong>la</strong> sal.<br />
Sólo para p<strong>la</strong>ntas tolerantes y suelos permeables y don<strong>de</strong><br />
pue<strong>de</strong>n ser necesarios <strong>la</strong>vados especiales para remover <strong>la</strong>s<br />
sales.<br />
Sólo para p<strong>la</strong>nras muy tolerantes, suelos muy permeables<br />
y don<strong>de</strong> se puedan aplicar <strong>la</strong>vados frecuentes para remo.<br />
ver el exceso <strong>de</strong> sales.<br />
Nunca <strong>de</strong>be utilizarse para riego.<br />
Sin peligto<br />
Peligro en suelos <strong>de</strong> Textura fina o arcillosa con alta capacl<br />
dad <strong>de</strong> cambio, especialmente si <strong>la</strong> permeabilidad es baja<br />
a menos que el suelo contenga yeso. Pue<strong>de</strong> usarse en suelos<br />
<strong>de</strong> textura gruesa entre <strong>la</strong> arenosa y franca u orgánica, con<br />
permeabilidad a<strong>de</strong>cuada.<br />
Peligro en suelos sin yeso, requieren estos suelos buen dre "<br />
naje, adición <strong>de</strong> materia orgánica y eventuales enmiendas<br />
químicas, tales como yeso o azuñe, que no son efectivos si<br />
<strong>la</strong>s aguas son <strong>de</strong> salinidad alta C4.<br />
No sirve generalmente para riego. Sólo cuando <strong>la</strong> salini *<br />
dad es baja o medía don<strong>de</strong> <strong>la</strong> solución <strong>de</strong>l calcio <strong>de</strong>l suelo<br />
o el yeso u otras enmiendas puedan hacer factibles el uso<br />
<strong>de</strong> estas aguas.<br />
C, SEGÚN EL CONTENIDO DE BORO Y CARBONATOS DE SODIO RESIDUAL<br />
Boro<br />
p.p. in ,<br />
Na 2C<strong>03</strong> Residual<br />
Calidad <strong>de</strong>l Agua<br />
No Tolerantes<br />
0.6 - 1.3<br />
1.3 - 2.0<br />
2.0 - 2.5<br />
Más <strong>de</strong> 2.5<br />
Tolerantes<br />
1.0 - 2.0<br />
2.0 - 3.0<br />
3.0 - 3.7<br />
Más <strong>de</strong> 3.7<br />
Menos <strong>de</strong> 1.2<br />
Menos <strong>de</strong> 1. 2<br />
1,2 a 2,5<br />
Más <strong>de</strong> 2.5<br />
Excelente a buena<br />
Buena a aceptable<br />
Dudosa a ina<strong>de</strong>cuada<br />
Ina<strong>de</strong>cuada
CUADRO N 0 10<br />
ANÁLISIS DE AGUA DE LAS CUENCA DE LOS RÍOS LLAUCANO Y CHOTANO<br />
><br />
z<br />
rn<br />
X<br />
O<br />
Muestra<br />
N*<br />
1<br />
2<br />
Ubicación<br />
Puente Carretera Colquirrume-<br />
Bambamarca ( Rio Hualgayoc )<br />
Toma <strong>de</strong>l Canal Chaqui! (Río<br />
l<strong>la</strong>ucano)<br />
CE.<br />
(mmhos/cm.)<br />
0.47<br />
0.21<br />
pH<br />
8.3<br />
8.0<br />
Ca<br />
4.1<br />
1.7<br />
Cationes<br />
(meq. x It.)<br />
Mg<br />
0.3<br />
0.2<br />
Na<br />
0.1<br />
0.1<br />
K<br />
0.<strong>03</strong><br />
0.<strong>03</strong><br />
Suma<br />
<strong>de</strong><br />
Cationes<br />
4.43<br />
2.<strong>03</strong><br />
COS<br />
0.0<br />
0.0<br />
Aniones<br />
(meq* x It.)<br />
HC<strong>03</strong><br />
2.9<br />
1.2<br />
NOS<br />
0.0<br />
0.0<br />
S04<br />
1.1<br />
0.5<br />
CI<br />
0.4<br />
0.3<br />
Suma<br />
<strong>de</strong><br />
Aniones<br />
4.4<br />
2.0<br />
SAR<br />
0.1<br />
0.1<br />
Boro<br />
(p.p.m.)<br />
0.0<br />
0.0<br />
r———~-<br />
C<strong>la</strong>sificacién<br />
C2S1<br />
C1S1<br />
73<br />
Pl<br />
n<br />
c<br />
jo<br />
CO<br />
O<br />
O<br />
70<br />
I—I<br />
O<br />
O<br />
3<br />
Tpma <strong>de</strong>l Canal Tayamayo (Rfo<br />
Rbmagón)<br />
0.30<br />
8.1<br />
2.5<br />
0.3<br />
0.1<br />
0.04<br />
2.94<br />
0.0<br />
1.6<br />
0.0<br />
0.9<br />
0.4<br />
2.9<br />
0.1<br />
0.0<br />
C2S1<br />
4<br />
Toma <strong>de</strong>l Canal N 0<br />
f<strong>la</strong>ca les)<br />
1 (RTo Cu<br />
0.15<br />
8.0<br />
1.0<br />
0.2<br />
0.2<br />
0.04<br />
1.44<br />
0.0<br />
0.7<br />
0.0<br />
0.3<br />
0.4<br />
1.4<br />
0.2<br />
0.0<br />
C1S1<br />
5 .<br />
Toma <strong>de</strong>l Canal Maygasbamba<br />
(Rfo Maygasbamba)<br />
0.31<br />
8.1<br />
2.6<br />
0.3<br />
0.1<br />
0.02<br />
3.02<br />
0.0<br />
2.0<br />
0.0<br />
0.7<br />
0.3<br />
3.0<br />
0.1<br />
0.0<br />
C2S1<br />
6,<br />
Manantial Tres Chorros (Sector<br />
Bambamarca).<br />
0.35<br />
8.4<br />
2.9<br />
0.4<br />
0.1<br />
0.<strong>03</strong><br />
3.43<br />
0.0<br />
2.5<br />
0.0<br />
0.7<br />
0.2<br />
3.4<br />
0.1<br />
0.0<br />
C2S1<br />
7 ,<br />
Toma <strong>de</strong>l Canal Penca loma (RTo<br />
Conchano)<br />
0.29<br />
8.3<br />
2.6<br />
0.3<br />
0.1<br />
0.<strong>03</strong><br />
3.<strong>03</strong><br />
0.0<br />
2.0<br />
0.0<br />
0.6<br />
0.4<br />
3.0<br />
0.1<br />
0.0<br />
C2S1<br />
8<br />
Toma <strong>de</strong>l Canal Barbarán (Río<br />
Chotano)<br />
0.31<br />
8.3<br />
2.5<br />
0.4<br />
0.2<br />
0.04<br />
3.14<br />
0.0<br />
2.0<br />
0.0<br />
0.8<br />
0.3<br />
3.1<br />
1.6<br />
0.0<br />
C2S1<br />
9<br />
Toma <strong>de</strong>l Canal El Molino (Rfo<br />
Chotano)<br />
0.35<br />
8.3<br />
2.7<br />
0.6<br />
0.1<br />
0.<strong>03</strong><br />
3,43<br />
0.0<br />
2.5<br />
0.0<br />
0.6<br />
0.3<br />
\<br />
3.4<br />
0.1<br />
0.0<br />
C2S1<br />
"O<br />
OQ<br />
CO<br />
CO
CD<br />
, «ISP<br />
^"i<br />
oí<br />
!<br />
^ s* 1 *<br />
O'O ¡ C32J<br />
I<br />
0 !<br />
joiao '«<br />
{ "-,<br />
¡•9 0 0<br />
cm<br />
—i<br />
i e - ^ '«•<br />
"i Í^ÍT í<br />
gou. o ^T<br />
y^a^Ti. i N» i<br />
CUADRO N 0 ! 1<br />
"O<br />
DESCARGA MEDTA MENSUAL DEL RIO CHOTANO EN LAJAS<br />
(m3/seg.)<br />
'/•i<br />
O'l<br />
C32!<br />
C52Í<br />
—-I<br />
,!í Arid<br />
Ocf.<br />
Nov.<br />
Die.<br />
Ene,<br />
feb.<br />
Mar.<br />
Abr,<br />
May.<br />
Jun,<br />
» i<br />
Jul,<br />
f Ago.<br />
$et.'<br />
Anual Sü<br />
Vio<br />
.1962-6.3.<br />
1963 1 64<br />
P $¿Ar&<br />
J 965-66<br />
1966-67<br />
mu<br />
1968-69<br />
1969-70<br />
m-n:<br />
0,60<br />
0^3<br />
0.94<br />
2,74<br />
4.01<br />
9,40<br />
2,97-<br />
6.72<br />
3,38<br />
1.70<br />
Q.60<br />
1.01<br />
3.<strong>03</strong><br />
11,57<br />
12.93<br />
6,33<br />
a,18<br />
4.08<br />
9 V 23<br />
. 5'JQ<br />
2.28<br />
2.58<br />
0.73<br />
7,80<br />
3 06<br />
3,29<br />
2,18<br />
2,30<br />
K35<br />
12.76<br />
10.92<br />
8.94<br />
5.19<br />
1,00<br />
9.51<br />
2.7?<br />
6.96<br />
5,49<br />
2,02<br />
4.00<br />
4,58<br />
8.52<br />
4 63<br />
17,19<br />
1.16<br />
8.90<br />
3,83<br />
3,68<br />
19,69<br />
3,26<br />
6.61<br />
2.62<br />
13.62<br />
5,01<br />
ltí.63<br />
8,62<br />
5,15<br />
lf,25<br />
3.74<br />
12.82<br />
7.78<br />
7.74<br />
6.96<br />
35.35<br />
9,24<br />
14.18<br />
8.09<br />
12.29<br />
10.47<br />
2.70<br />
2.82<br />
2 71<br />
19.84<br />
4.49<br />
18.51<br />
4,92<br />
2,10<br />
3.70<br />
3*63<br />
4,25<br />
4,71<br />
2.60<br />
í/59<br />
2.40<br />
9.97<br />
8^2<br />
rl^l<br />
0,82<br />
0;87<br />
2,16<br />
1.27<br />
1,52<br />
,1.54<br />
0,50<br />
4,54<br />
2,50<br />
* r 5.3Í<br />
1_J<br />
9.61<br />
0.33<br />
t>.38<br />
9-76<br />
0.69<br />
"0A$<br />
9.70<br />
0,37<br />
1.19<br />
V.J4<br />
Q.3?,-<br />
0,22<br />
0.26<br />
,1,22<br />
0,34<br />
9,34<br />
0.<strong>45</strong><br />
0.38<br />
0.71<br />
'f.Oó<br />
y"\w<br />
^.36'<br />
0 11<br />
0,21<br />
,1.22,<br />
0.80<br />
0.42<br />
0.43-<br />
1.28<br />
0.86<br />
0.95<br />
^0.74<br />
3<br />
8,304<br />
4.44<br />
tan<br />
4. 6§3^<br />
4.36<br />
-3"77r<br />
5.2?<br />
2,37<br />
4:64<br />
4,91<br />
9.5t<br />
?i D<br />
„_J<br />
5 ¿i<br />
¡OíiuCrs.,<br />
b<br />
'Í'&S í 'i ' vi 1<br />
C'ICLVMO<br />
s
CUADRO N 0 12<br />
DESCARGA MEDIA MENSUAL DEL RIO CHOTANO EN CHOTANO TÚNEL<br />
(m3/seg.)<br />
Año<br />
1958-59<br />
1959-60<br />
1960-61<br />
1961-62<br />
1962-63<br />
1963-64<br />
1964-65<br />
1965-66<br />
1 966-
CUADRO N" 13<br />
DESCARGA MEDIA MENSUAL DE LA QUEBRADA TONDORA EN TONDCRA<br />
(m3/seg.)<br />
Año<br />
1963-64<br />
1964-65<br />
1965-66<br />
1966-67<br />
1967-68<br />
1968-69<br />
1969-70<br />
1970-71<br />
1971-72<br />
1972-73<br />
Oct<br />
0.22<br />
0.29<br />
0.52<br />
0.94<br />
0=23<br />
1.25<br />
0.19<br />
0.50<br />
0.94<br />
0.11<br />
Nov.<br />
0.41<br />
1.10<br />
1.91<br />
0.64<br />
0.34<br />
0.48<br />
0.62<br />
0.67<br />
0.81<br />
0.19<br />
Die.<br />
0.46<br />
0.40<br />
0.53<br />
2.54<br />
0.15<br />
0J4<br />
0.83<br />
0.88<br />
0.36<br />
0.30<br />
Ene.<br />
0.71<br />
0.28<br />
0.67<br />
0.59<br />
0J4<br />
0.24<br />
0.69<br />
0.68<br />
0.47<br />
0.26<br />
Feb.<br />
0.52<br />
0.27<br />
0.34<br />
1.23<br />
0.13<br />
0.42<br />
0.33<br />
1.09<br />
0.44<br />
0.21<br />
Mar.<br />
0.41<br />
0.59<br />
0.49<br />
1.64<br />
0.53<br />
0.41<br />
0.53<br />
3.53<br />
2.12<br />
0.24<br />
Abr.<br />
1.82<br />
1.69<br />
0.63<br />
0.67<br />
0.15<br />
1.52<br />
0.47<br />
1.97<br />
2.60<br />
2.04<br />
May.<br />
0.58<br />
0.83<br />
0.69<br />
0.24<br />
0.09<br />
0.41<br />
0.87<br />
1.04<br />
0.69<br />
0.59<br />
Jim.<br />
0.24<br />
0.24<br />
0,34<br />
0J7<br />
0.08<br />
0J7<br />
0.25<br />
1.09<br />
0.35<br />
0.30<br />
JuL<br />
0J4<br />
0.18<br />
0J5<br />
OJC<br />
0.07<br />
0J?<br />
0J5<br />
O.^J<br />
0.19<br />
0.38<br />
Ago.<br />
0J8<br />
0J4<br />
0J1<br />
OJO<br />
0,07<br />
OJO<br />
OJC<br />
o.s:<br />
0.13<br />
0.47<br />
Set.<br />
0.15<br />
0J7<br />
0.11<br />
OJO<br />
0.39<br />
OJO<br />
0.08<br />
0.16<br />
0.16<br />
0.64<br />
Anual<br />
0.48<br />
0 o 51<br />
0.48<br />
0.75<br />
0.20<br />
0„44<br />
0.43<br />
1.<strong>03</strong><br />
0.77 '<br />
0.48
CURVA DE DURACIÓN DE LA PRECIPITACIÓN MENSUAL<br />
ESTACIÓN " CHOTA *<br />
Gráfico N" 9<br />
Enero<br />
Marzo<br />
Julio<br />
Setiembre<br />
Noviembre<br />
Febrero<br />
Jumo<br />
Octubre<br />
Abril<br />
Agosto<br />
Diciembre<br />
Probabilida<strong>de</strong>s %<br />
áO 70 60 90 100
era<br />
CURVA DE DURACIÓN DE LA PRECIPITACIÓN MENSUAL<br />
g<br />
ESTACIÓN " COCHABAMBA "<br />
Gráfico N° 10<br />
300<br />
280<br />
260<br />
240<br />
200<br />
Enero<br />
NAnyn<br />
Setiembre<br />
Febrero<br />
Jumo<br />
Octubre<br />
Marzo<br />
Julio<br />
Noviembre<br />
Abril<br />
Agosto<br />
Diciembre<br />
c<br />
«<br />
*!<br />
o<br />
*•<br />
,5.<br />
S<br />
a.<br />
£<br />
180<br />
1Ó0<br />
140<br />
120<br />
100<br />
80 -<br />
60<br />
40<br />
o-*<br />
Probabilida<strong>de</strong>s %<br />
10 20 30 40 50 60 70 80 90 100<br />
N<br />
O<br />
><br />
Z<br />
O<br />
H<br />
m<br />
O<br />
m<br />
n<br />
><br />
><br />
><br />
70<br />
O<br />
>
34-.<br />
CUR VAS DE LOS CAUDALES DIAF AOS<br />
RIO CHOTANO EN LAJAS<br />
34 -i<br />
Gráfico NMl<br />
><br />
z<br />
tn<br />
X<br />
O<br />
jo<br />
32<br />
32<br />
O<br />
24<br />
Q.Max. = 75.92 m 3 /seg.<br />
Q. Mm. = 0.05 m /seg.<br />
Q.Prom. = 4.50m 3 /seg.<br />
28<br />
24<br />
•<br />
en<br />
O<br />
en<br />
O<br />
jo<br />
i—<<br />
O<br />
O<br />
en<br />
i<br />
\<br />
CO<br />
E<br />
s<br />
1<br />
a<br />
•o<br />
3<br />
O<br />
U<br />
20 -<br />
16-<br />
i<br />
\ 20<br />
CO<br />
E<br />
s<br />
1<br />
i<br />
o<br />
U<br />
u<br />
3<br />
\<br />
\<br />
12<br />
^<br />
8<br />
s<br />
8<br />
4 -<br />
\<br />
N<br />
4 -<br />
^Zf:<br />
^<br />
1 1 1 1 1 1 1 1 1 =r 1<br />
3 10 20 30 40 50 Í0 70 80 90 100<br />
Duración en %<br />
0 -f•<br />
0<br />
¿-^Mf^ñ<br />
i!<br />
!_ .<br />
- ' r^U-<br />
mi "— n " i r<br />
1 1 1 1<br />
10 20 30 40 50 55<br />
Frecuencia en %<br />
OQ<br />
O<br />
en
CURVAS DE DURACIÓN MENSUAL DE LOS CAUDALES DIARIOS<br />
RIO CHOTANO EN LAJAS<br />
Gráfico N 0 12<br />
ENERO<br />
FEBRERO<br />
MARZO<br />
ABRIL<br />
MAYO<br />
JUNIO<br />
y ,0<br />
CO<br />
E<br />
*<br />
s<br />
1<br />
3 20<br />
100 % Tm = 372 dúis<br />
Mix. = 39.50 m Vsag.<br />
Mrn.=0.32m3/seg.<br />
\<br />
100%Tm=339dras<br />
Mix. = 71.15 m 3 /!.g.<br />
MFn. =0.44m 3 /seg.<br />
\<br />
100%Tm=372tlfa^<br />
Mix. = 75.92 m Vseg.<br />
Mrn. = 215m 3 /seg.<br />
\<br />
100 % Tm = 3i0 dfas<br />
Mix. = 44.94 m 3 /seg.<br />
Mrn. = 1.39m 3 /seg.<br />
100%Im=372dras<br />
Mix. = 58.30 m 3 /seg.<br />
Mfn. = 1.59m 3 /seg.<br />
100%Tm=360dras<br />
Mix. = 10.13 m 3 /seg.<br />
Mrn. = 0.23m 3 Aeg.<br />
\<br />
\<br />
\<br />
\ 5=10.4ém5/Seg.<br />
\ Q = 9.58m 3 /seg.<br />
10<br />
\ S=7.74m 3 /seg.<br />
\ . Q = 5.3ém 3 /iíg.<br />
\v a^OSmVseg.<br />
~^~~^^^<br />
i i i '1<br />
' 1 1 i<br />
0 2 0 4 0 6 0 8 0 0 20 4 0 6 0 8 0 0 2 0 4 0 6 0 8 0 0 2 0 4 0 6 0 8 0 0 2 0 4 0 6 0 8 0 0 2 0 4 0 6 0 8 0 0<br />
Duración en %<br />
\<br />
\ ^ ^ Q=I.a0m 3 /sea.<br />
JULIO AGOSTO SETIEMBRE OCTUBRE NOVIEMBRE DICIEMBRE<br />
100 % Tm » 372 dras<br />
100%Tm»372dras<br />
100 % Tm = 360 día,<br />
100 % Tm = 372 d'as<br />
100 %Tm= 360 dios<br />
100 % Tm = 372 dros<br />
CO<br />
E<br />
30<br />
Mix. = 3 <strong>45</strong>m 3 /seg.<br />
Mfn.' 0.24m 3 /reg.<br />
Mix. = 6.20 m<br />
3 /¡tg.<br />
Mrn. = 0.10 m'/jeg.<br />
Max. = 7.p7m 3 /seg.<br />
M'n. = 0.05m 3 /seg.<br />
Mix. - 70.00 m 3 /SOB.<br />
MSi. = 0.10in 3 /seg.<br />
Mix. = 43.27 m 3 /M0.<br />
Mrn. =0.30 mViro.<br />
Mix. = 38.93 m 3 /seg.<br />
MRi. = 0.48m 3 /i«g.<br />
20 40<br />
Q-0.71 m 3 /»9.<br />
L<br />
Q = 0.51 m 3 /s6g.<br />
Q=0.67m 3 /íeg.<br />
Q=3.28m 3 /sag,<br />
—r-<br />
20 40 60 «0 40<br />
Duración en %<br />
Q= 4.48m 3 /seg.
CUADRO N 0 14<br />
M<strong>ANA</strong>NTIALES INVENTARIADOS EN EL SECTOR HUALGAYOC<br />
N 0<br />
Distrito<br />
Ubi ca ción<br />
Estancia<br />
Nombre <strong>de</strong>l<br />
Manantial<br />
Tipo <strong>de</strong> Uso<br />
Caudal<br />
Ot/seg.)<br />
1<br />
2<br />
3<br />
4<br />
5<br />
6<br />
7<br />
8<br />
! 9<br />
10<br />
11<br />
12<br />
Hualgayoc<br />
Bambamarca<br />
Bambamarca<br />
Bambamarca<br />
Bambamarca<br />
Bambamarca<br />
Bambamarca<br />
Bambamarca<br />
Bambamarca<br />
Bambamarca<br />
Bambamarca<br />
Bambamarca<br />
Hualgayoc<br />
L<strong>la</strong>ucdn<br />
El Tambo<br />
El Enterrador<br />
Cuñacales<br />
Cuñacales<br />
La Lucma<br />
San Juan <strong>de</strong> Lacamaca<br />
San Juan <strong>de</strong> Lacamaca<br />
Lucma cucho<br />
San Antonio <strong>de</strong> Lacamaca<br />
San Antonio <strong>de</strong> Lacamaca<br />
Los Chimchangos<br />
Chaquil<br />
El Tambo<br />
Batán Cucho<br />
Los Huanchacos<br />
Los Sauces<br />
Tres Chorros<br />
San Juan<br />
Vigas Machay<br />
Lucmil<strong>la</strong><br />
Shinshil Pampa<br />
Pasholcucho<br />
Doméstico<br />
Agríco<strong>la</strong><br />
Agríco<strong>la</strong><br />
Agríco<strong>la</strong><br />
Agríco<strong>la</strong><br />
Agríco<strong>la</strong><br />
Doméstico-Agríco<strong>la</strong><br />
Doméstico<br />
Agríco<strong>la</strong><br />
Agríco<strong>la</strong><br />
Doméstico<br />
Doméstico<br />
S.D.<br />
160.0<br />
S.D.<br />
S.D.<br />
S.D.<br />
S.D.<br />
S.D.<br />
S.D.<br />
12.0<br />
1.1<br />
2.0<br />
1.0
Pag 108<br />
/UNA NORTH DE CAJA MA RCA<br />
CUADRO N 0 15<br />
M<strong>ANA</strong>NTIALES INVENTARIADOS EN EL SECTOR CHOTA<br />
N 0<br />
Distrito<br />
Ubi<br />
ca c io n<br />
Estancia<br />
Nombre <strong>de</strong>l<br />
Manantial<br />
Tipo <strong>de</strong> Uso<br />
Caudal<br />
(l^seg.)<br />
]<br />
2<br />
3<br />
4<br />
5<br />
6<br />
7<br />
8<br />
9<br />
10<br />
11<br />
12<br />
13<br />
14<br />
15<br />
16<br />
17<br />
18<br />
19<br />
20<br />
21<br />
22<br />
23<br />
24<br />
25<br />
26<br />
27<br />
28<br />
29<br />
30<br />
31<br />
32<br />
33<br />
34<br />
35<br />
36<br />
Chota<br />
Chota<br />
Chota<br />
Chota<br />
Chota<br />
Chota<br />
Chota<br />
Chota<br />
Chota<br />
Chota<br />
Chota<br />
Chota<br />
Chota<br />
Chota<br />
Chota<br />
Chota<br />
Chota<br />
Chota<br />
Chota<br />
Chota<br />
Chota<br />
Lajas<br />
Lajas<br />
Conchan<br />
Conchan<br />
Conchan<br />
Conchan<br />
Conchan<br />
Conchan<br />
Chiquirip<br />
Cochabamba<br />
Cochabamba<br />
Cochabamba<br />
Cochabamba<br />
Huambos<br />
Huambos<br />
Chaupe<strong>la</strong>nche<br />
Negropampa<br />
Negropampa<br />
Negropampa<br />
Cuyumaica<br />
Cuyumalca<br />
Yurayacu<br />
Cabracancha<br />
Cabracancha<br />
Cabracancha<br />
Cabracancha<br />
Cabíacancha<br />
Cabracancha<br />
Cabracancha<br />
Língan<br />
haca Gian<strong>de</strong><br />
Iraca Gran<strong>de</strong><br />
Chucrachulit<br />
Chuyabamba<br />
Chuyabamba<br />
Chuyabamba<br />
Rinconada<br />
Cuyac<br />
Conchan<br />
Conchan<br />
Conchan<br />
Conchan<br />
Conchan<br />
Conchan<br />
Chiquiíip<br />
L<strong>la</strong>nduma<br />
L<strong>la</strong>nduma<br />
Hualpahuagana<br />
Cochabamba<br />
Yamaluc<br />
Yamaluc<br />
Posad! lia<br />
Bocatoma<br />
El Gil<br />
Shotorco<br />
Suro<br />
Zaiza<br />
Guamoros<br />
Bobadilia<br />
La Empresa<br />
El Carrizo<br />
Trancamayo Chico<br />
Trancamayo Gían<strong>de</strong><br />
Linares<br />
El Ver<strong>de</strong><br />
Parinaco<br />
Lanshanto<br />
Jayampata<br />
Pleito Chacta<br />
La Paccha<br />
La Pauca<br />
Am bu y<br />
Rinconada<br />
Casmalca<br />
Centurión<br />
Tacshana<br />
B<strong>la</strong>s<br />
Mishquiaco<br />
La Chonta<br />
La Rinconada<br />
Unshaloma<br />
La Chotrera<br />
Chongoyape<br />
Hualpahuagana<br />
Cansaboca<br />
Nogal<br />
Malpaso<br />
AgiTco<strong>la</strong><br />
Agríco<strong>la</strong><br />
Agríco<strong>la</strong><br />
Ag» feo <strong>la</strong><br />
Doméstico<br />
Doméstico<br />
Agrico<strong>la</strong><br />
AgrTco<strong>la</strong><br />
Agríco<strong>la</strong><br />
Agríco<strong>la</strong><br />
Agrico<strong>la</strong><br />
Agrícoia<br />
Agríco<strong>la</strong><br />
Agí icol'i<br />
Agí ico Ir<br />
Domestico<br />
Agí ico<strong>la</strong><br />
Agrico<strong>la</strong><br />
Doméstico-Agí ico<strong>la</strong><br />
Doméstico-Agiíco<strong>la</strong><br />
Domestico-Agí Tco<strong>la</strong><br />
Doméstico<br />
Agríco<strong>la</strong><br />
Agri'co<strong>la</strong><br />
Doméstico<br />
Agrico<strong>la</strong><br />
Agríco<strong>la</strong><br />
Agríco<strong>la</strong><br />
Agríco<strong>la</strong><br />
Doméstico<br />
Agríco<strong>la</strong><br />
Agríco<strong>la</strong><br />
Agrico<strong>la</strong><br />
Doméstico<br />
Doméstico<br />
Agríco<strong>la</strong><br />
5,0,<br />
S,D.<br />
1.2<br />
2,0<br />
150,0<br />
250.0<br />
300,0<br />
S.D.<br />
S.D.<br />
S.D.<br />
60,0<br />
oO.O<br />
17.0<br />
10,0<br />
S.D. ;<br />
S.D,<br />
70.0<br />
S.D.<br />
15,0<br />
S.D.<br />
22.0<br />
6.0<br />
400,0<br />
<strong>45</strong>0 0<br />
11 .0<br />
2,0<br />
12,0<br />
S,D,<br />
5,0<br />
1.0<br />
S.D,<br />
S.D,<br />
S.D.<br />
1,9<br />
2,0<br />
1.5
ANEXO V - RECURSOS<br />
HIDRICOS<br />
CUADRO N 0 16<br />
M<strong>ANA</strong>NTIALES INVENTARIADOS EN EL SECTOR CUTERVO<br />
N 0<br />
Ub<br />
DisMto<br />
cae ion<br />
Estancia<br />
Nombre <strong>de</strong>l<br />
Manantial<br />
Tipo <strong>de</strong><br />
Uso<br />
Caudal<br />
(It/seg.)<br />
1<br />
Cutervo<br />
El Rejo<br />
Eshquirumi<br />
Agríco<strong>la</strong><br />
3.0<br />
2<br />
Cutervo<br />
Acuñac<br />
Acuñac<br />
Agríco<strong>la</strong><br />
13.0<br />
3<br />
Cutervo<br />
Yacu Chincana<br />
Chaul<strong>la</strong>cocha<br />
Agrico<strong>la</strong><br />
60.0<br />
4<br />
Cutervo<br />
Carmen Pampa<br />
Carmen Pampa<br />
Agríco<strong>la</strong><br />
110.0<br />
5<br />
Cutervo<br />
Conday<br />
Conday Alto N 0 1<br />
Agrico<strong>la</strong><br />
S.D.<br />
6<br />
Cutervo<br />
Conday<br />
Conday Alto N 0 2<br />
Agríco<strong>la</strong><br />
7.0<br />
7<br />
Cutervo<br />
Conday<br />
Conday Bajo<br />
Agríco<strong>la</strong><br />
8.0<br />
8<br />
Cutervo<br />
Huangashana<br />
Huangashana<br />
Agríco<strong>la</strong><br />
9.0<br />
9<br />
Cutervo<br />
La Succha<br />
La Naranja<br />
Agríco<strong>la</strong><br />
4.0<br />
10<br />
Cutervo<br />
La Succha<br />
La Lucma<br />
Agríco<strong>la</strong><br />
40.0<br />
11<br />
Cutervo<br />
La Succha<br />
El Carrizo<br />
Agríco<strong>la</strong><br />
S.D.<br />
12<br />
Cutervo<br />
Yatún<br />
Ramírez<br />
Agríco<strong>la</strong><br />
18.0<br />
13<br />
Cutervo<br />
Yatún<br />
El Gavilán<br />
Agríco<strong>la</strong><br />
100.0<br />
14<br />
Cutervo<br />
Yatún<br />
Is<strong>la</strong>ngate<br />
Agríco<strong>la</strong><br />
70.0<br />
15<br />
So cota<br />
Chulón gate<br />
Granadil<strong>la</strong><br />
Agrico<strong>la</strong><br />
S.D.<br />
16<br />
So cota<br />
CapulT<br />
CapulT<br />
Doméstico<br />
S.D.
CUADRO N 0 17<br />
EVAPOTRANSPIRACION POTENCIAL ESTIMADA MEDIANTE LA FORMULA DE BLANNEY & CRIDÓLE<br />
(Según Información Meteorológica <strong>de</strong> <strong>la</strong> Estación <strong>de</strong> Bambamarca)<br />
Mes<br />
Temperatura Media<br />
( 0 C)<br />
Porcentaje <strong>de</strong> Horas<br />
Anuales <strong>de</strong> Brillo So<strong>la</strong>r<br />
Factor <strong>de</strong> Corrección<br />
(kt)<br />
Evapotranspiración<br />
Potencial<br />
(mm/mes)<br />
Evapotranspiración<br />
Potencial Corregida<br />
(mm/mes)<br />
Ene.<br />
Feb.<br />
Mar.<br />
Abr.<br />
May„<br />
Jun.<br />
JuL<br />
Ago.<br />
Set.<br />
Oct,<br />
Nov.<br />
Die.<br />
14.8<br />
14.9<br />
14.8<br />
14.9<br />
14,7<br />
14.1<br />
13.7<br />
14,3<br />
15,0<br />
15.2<br />
15.2<br />
14.8<br />
8.737<br />
7.820<br />
8.5<strong>03</strong><br />
,8,117<br />
8.280<br />
7,969<br />
8.170<br />
8.353<br />
8.180<br />
8,600<br />
8.411<br />
8.774<br />
0.702<br />
0.705<br />
0.702<br />
0,705<br />
0,699<br />
0.680<br />
0.667<br />
0.686<br />
0.708<br />
0,714<br />
0,714<br />
0.702<br />
130.1<br />
116.8<br />
126.6<br />
121.3<br />
122,9<br />
116.1<br />
117.6<br />
122.5<br />
122.6<br />
129.7<br />
126.8<br />
130.7<br />
91,4<br />
82.4<br />
88.9<br />
85.5<br />
85.9<br />
78.9<br />
78.4<br />
84.0<br />
86.8<br />
92.5<br />
90,5<br />
91.7<br />
TOTAL<br />
1,483.7<br />
1,<strong>03</strong>6.9
CUADRO N 0 18<br />
EVAPOTRANSPIRACION POTENCIAL ESTIMADA MEDIANTE LA FORMULA DE BLANNEY & CRIDÓLE<br />
(Según Información Meteorológica <strong>de</strong> <strong>la</strong> Estación <strong>de</strong> Chota)<br />
Mes<br />
Temperatura Medía<br />
( 0 C)<br />
Porcentaje <strong>de</strong> Horas<br />
Anuales <strong>de</strong> Brillo So<strong>la</strong>r<br />
Factof <strong>de</strong> Corrección<br />
(kt)<br />
Evapoíranspiración<br />
Potencial<br />
(mm/mes)<br />
Evapotranspi ración<br />
Potencial Corregida<br />
{mm/mes)<br />
Ene,<br />
Feb,<br />
Mar,<br />
Abr.<br />
May 0<br />
Jun,<br />
Jul,<br />
Ago.<br />
Set,<br />
Oct,<br />
Nov.<br />
Die<br />
15.8<br />
15.5<br />
15.7<br />
15.7<br />
15.7<br />
15.2<br />
15.1<br />
15.3<br />
15.7<br />
15.8<br />
15.9<br />
15.9<br />
8,733<br />
7.818<br />
8.5<strong>03</strong><br />
8.117<br />
8.283<br />
7.975<br />
8.173<br />
8,356<br />
8.180<br />
8.598<br />
8,405<br />
8.768<br />
0.733<br />
0,724<br />
0.730<br />
0.730<br />
0.730<br />
0,714<br />
0.711<br />
0.717<br />
0.730<br />
0.733<br />
0.736<br />
0,736<br />
134.1<br />
118.9<br />
130.1<br />
124.2<br />
126,8<br />
120.2<br />
122,8<br />
126.4<br />
125.2<br />
132.0<br />
129.4<br />
135.0<br />
98,3<br />
86,1<br />
95.0<br />
90.7<br />
92.5<br />
85.8<br />
87.3<br />
90,6<br />
91.4<br />
96.7<br />
95.2<br />
99.4<br />
TOTAL<br />
1,525.1<br />
1,109.0
to<br />
CUADRO N 0 19<br />
EVAPOTRANSPIRACION POTENCIAL ESTIMADA MEDIANTE LA FORMULA DE BLANNEY & CRIDDLE<br />
(Según Información Meteorológica d° !a Estación d** Conchan)<br />
Mes<br />
Temperatura Media<br />
( 0 C)<br />
Porcentaje d« Ho ras<br />
Anuales d** Brillo So<strong>la</strong>r<br />
Factor d
'^W<br />
><br />
Mes<br />
o<br />
CUADRO N 0 20 <<br />
EVAPOTRANSPIRACION POTENCIAL ESTIMADA MEDIANTE LA FORMULA DE BLANNEY & CRIDÓLE £<br />
-——• — —•—— n<br />
Temperatura Media<br />
CO<br />
(Según Información Meteorológica <strong>de</strong> <strong>la</strong> Estación <strong>de</strong> Cochobombo) 5><br />
o<br />
en<br />
Porcentaje <strong>de</strong> Horas<br />
Anuales <strong>de</strong> Brillo So<strong>la</strong>r<br />
Factor <strong>de</strong> Corrección<br />
Oct)<br />
Ev apotra nspíración<br />
Potencial<br />
(mnv'mes)<br />
EvapotranspIraciÓn<br />
Potencial Corregida<br />
(mrr/mes)<br />
X<br />
Ene.<br />
Feb.<br />
Mar,<br />
Abr.<br />
May.<br />
Jun,<br />
Jul,<br />
Ago.<br />
Set.<br />
Oct,<br />
Nov.<br />
Die,<br />
18,8<br />
19.0<br />
18,9<br />
18.9<br />
19,1<br />
18,8<br />
18.6<br />
19.1<br />
19.1<br />
19.0<br />
18,9<br />
18.9<br />
8,729<br />
7.817<br />
8,502<br />
8.118<br />
8,286<br />
7,979<br />
8,176<br />
8-358<br />
8,180<br />
8.597<br />
8,401<br />
8,764<br />
0,827<br />
0,833<br />
0.830<br />
0,830<br />
0,840<br />
0,827<br />
0,820<br />
0,840<br />
0,840<br />
0,833<br />
0,830<br />
0,830<br />
146.0<br />
131.4<br />
142.6<br />
136.1<br />
139.7<br />
133,4<br />
136.0<br />
140,9<br />
137.9<br />
144 5<br />
140.9<br />
146.9<br />
120,7<br />
109.5<br />
118.3<br />
112,9<br />
117.3<br />
110.3<br />
111.5<br />
118,4<br />
115.8<br />
120.4<br />
116.9<br />
121.9<br />
TOTAL<br />
1,676.3<br />
1,393.9
-o<br />
CUADRO N 0 21<br />
EVAPOTRANSPIRACIÓN POTENCIAL ESTIMADA MEDIANTE LA FORMULA DE BLANNEY & CRIDÓLE<br />
(Según Información Meteorológica <strong>de</strong> <strong>la</strong> Estación <strong>de</strong> Cutervo)<br />
Mes<br />
Temperatura Media<br />
CO<br />
Porcentaje <strong>de</strong> Horas<br />
Anuales <strong>de</strong> Brillo So<strong>la</strong>r<br />
Factor <strong>de</strong> Corrección<br />
(let)<br />
Evapo transpiración<br />
Potencial<br />
(mm/mes)<br />
Evapotranspi rae ion<br />
Potencial Corregida<br />
(mm/mos)<br />
Ene.<br />
Feb.<br />
Mar.<br />
Abr.<br />
May.<br />
Jun.<br />
Jul.<br />
Ago.<br />
Set.<br />
Oct.<br />
Nov.<br />
Die.<br />
13.6<br />
13.9<br />
13.7<br />
13.9<br />
14,0<br />
13.5<br />
13.0<br />
13.5<br />
13.8<br />
13.8<br />
14.1<br />
13.9<br />
8.724<br />
7.816<br />
8.500<br />
8.113<br />
8.333<br />
7.987<br />
8.173<br />
8.358<br />
8,175<br />
8.599<br />
8.597<br />
8.390<br />
0.664<br />
0.674<br />
0.667<br />
0.674<br />
0.677<br />
0.661<br />
0.646<br />
0.661<br />
0.671<br />
0.671<br />
0.671<br />
0.680<br />
125.1<br />
113.2<br />
122.3<br />
117.5<br />
121.1<br />
114,2<br />
115.0<br />
119.5<br />
118.0<br />
124.1<br />
125.3<br />
121.5<br />
83.1<br />
76.3<br />
81.6<br />
79.2<br />
81.6<br />
75.5<br />
74.3<br />
79.0<br />
79.2<br />
83.3<br />
85.2<br />
81.9<br />
TOTAL<br />
1,436.8<br />
960.2
A ,><br />
ANEXO VI "DIAGNOSTICO AGROPECUARIO Pág. 115<br />
ANEXO<br />
VI<br />
DIAGNOSTICO<br />
AGROPECUARIO<br />
Area Física <strong>de</strong> Producción Sector I (Norte ).<br />
Area Física <strong>de</strong> Producción Sector II ( Sur )><br />
Valor y Volumen <strong>de</strong> <strong>la</strong> Producción Agríco<strong>la</strong> <strong>de</strong>l Subsector Cutervo.<br />
Valor y Volumen <strong>de</strong> <strong>la</strong> Producción Agríco<strong>la</strong> <strong>de</strong>l Subsector Chota.<br />
Valor y Volumen <strong>de</strong> <strong>la</strong> Producción Agríco<strong>la</strong> <strong>de</strong>l Subsector Santa Cruz,<br />
Valor y Volumen <strong>de</strong> <strong>la</strong> Producción Agríco<strong>la</strong> <strong>de</strong>l Subsector Hualgayoc<br />
Valor y Volumen <strong>de</strong> <strong>la</strong> Producción Agríco<strong>la</strong> <strong>de</strong>l Subsector Cajamarca*<br />
Valor y Volumen <strong>de</strong> <strong>la</strong> Producción Agríco<strong>la</strong> <strong>de</strong>l Subsector San Miguel<br />
Valor y Volumen <strong>de</strong> <strong>la</strong> Producción Agríco<strong>la</strong> <strong>de</strong>l Subsector Contumaza.<br />
Costos Directos <strong>de</strong> Producción Agríco<strong>la</strong> en el Subsector Cutervo.<br />
Costos Directos <strong>de</strong> Producción Agríco<strong>la</strong> en el Subsector Chota.<br />
Costos Directos <strong>de</strong> Producción Agríco<strong>la</strong> en el Subsector Santa Cruz.<br />
Costos Directos <strong>de</strong> Producción Agríco<strong>la</strong> en el Subsector Hualgayoc.<br />
Costos Directos <strong>de</strong> Producción Agríco<strong>la</strong> en el Subsector Cajamarca,<br />
Costos Directos <strong>de</strong> Producción Agríco<strong>la</strong> en el Subsector San Miguel.<br />
Costos Directos <strong>de</strong> Producción Agríco<strong>la</strong> en el Subsector Contumaza.<br />
Demanda <strong>de</strong> Mano <strong>de</strong> Obra por Cultivos.<br />
Ut<br />
Ut<br />
Ut<br />
Ut<br />
Ut<br />
Ut<br />
Ut<br />
lida<strong>de</strong>s Estimadas por Cult<br />
lida<strong>de</strong>s Estimadas por Cult<br />
lida<strong>de</strong>s Estimadas por Cult<br />
lida<strong>de</strong>s Estimadas por Cult<br />
lida<strong>de</strong>s Estimadas por Cult<br />
lida<strong>de</strong>s Estimadas por Cult<br />
lida<strong>de</strong>s Estimadas por Cult<br />
vos en el Subsector Cutervo.<br />
vos en el Subsector Chota,<br />
vos en el Subsector Santa Cruz,<br />
vos en el Subsector Hualgayoc.<br />
vos en el Subsector Cajamarcao<br />
vos en el Subsector San Miguel.<br />
vos en el Subsector Contumaza.<br />
Préstamos <strong>de</strong>l Banco Agrario y Fondo Fi<strong>de</strong>icomiso Sector I ( Norte ).<br />
Préstamos <strong>de</strong>l Banco Agrario y Fondo Fi<strong>de</strong>icomiso Sector II ( Sur ).<br />
___ o —
CUADRO N°1<br />
AREA FÍSICA DE PRODUCCIÓN SECTOR I ( NORTE )<br />
1974- 1975<br />
OQ<br />
s<br />
Cutervo<br />
Ch Jta<br />
Santa<br />
Cruz<br />
Hualg ayoc<br />
Total<br />
Cultivos<br />
Riega<br />
Ha.<br />
Secano<br />
Ha.<br />
Tot al<br />
Ha.<br />
%<br />
Riego '<br />
Ha.<br />
Secano<br />
Ha.<br />
Ha.<br />
Total<br />
%<br />
Riego<br />
Ha.<br />
Secano<br />
Ha.<br />
Ha.<br />
Total<br />
%<br />
Riego<br />
Ha.<br />
Secano<br />
Ha.<br />
Ha.<br />
Total<br />
%<br />
Riego<br />
Ha.<br />
Secano<br />
Ha.<br />
Ha.<br />
Tot 3I |<br />
% |<br />
1. Industriales<br />
Caña <strong>de</strong> azúcar<br />
Café<br />
Otros Cultivos (*l)<br />
78<br />
56<br />
22<br />
—<br />
548<br />
338<br />
207<br />
3<br />
626<br />
394<br />
229<br />
3<br />
hl<br />
2.5<br />
1.4<br />
0.0<br />
7<br />
2<br />
4<br />
1<br />
66<br />
64<br />
1<br />
1<br />
_73<br />
66<br />
5<br />
2<br />
0.4<br />
0.4<br />
0.0<br />
0.0<br />
2_<br />
2<br />
_- -<br />
_19<br />
12<br />
7<br />
~<br />
11<br />
14<br />
7<br />
-<br />
1.1<br />
0.7<br />
0.4<br />
0.0<br />
-^<br />
—<br />
—<br />
—<br />
_<br />
__<br />
-<br />
--_<br />
—<br />
E<br />
60<br />
26<br />
1<br />
633<br />
414<br />
215<br />
4<br />
720<br />
474<br />
241<br />
5<br />
1.5<br />
0.9<br />
0.6<br />
0.0<br />
II.<br />
Alimenticios<br />
758<br />
12,700<br />
13,<strong>45</strong>8<br />
83.7<br />
1,020<br />
15,260<br />
16,280<br />
99.2<br />
47<br />
1,925<br />
1,972<br />
98.9<br />
1,590<br />
14,400<br />
15,990<br />
93.5<br />
3,415<br />
44,285<br />
47,700<br />
92.3<br />
1. Menestras<br />
Friiol<br />
Arveja<br />
Haba<br />
Lenteja<br />
11<br />
72<br />
6<br />
--<br />
338<br />
1,556<br />
110<br />
111<br />
349<br />
1,628<br />
116<br />
111<br />
2.2<br />
10.1<br />
0.7<br />
0.7<br />
5<br />
38<br />
—<br />
2<br />
91<br />
1,378<br />
37<br />
388<br />
96<br />
1,416<br />
37<br />
390<br />
0.6<br />
8.6<br />
0.2<br />
2.4<br />
__<br />
—<br />
__<br />
-<br />
12<br />
72<br />
__<br />
-<br />
12<br />
72<br />
—<br />
0.6<br />
3.6<br />
0.0<br />
0.0<br />
-_<br />
28<br />
~<br />
—<br />
51<br />
394<br />
128<br />
77<br />
51<br />
422<br />
128<br />
77<br />
0.3<br />
2.5<br />
0.7<br />
0.5<br />
16<br />
138<br />
6<br />
2<br />
492<br />
3,400<br />
275<br />
576<br />
508<br />
3,538<br />
281<br />
578<br />
1.0<br />
6.9<br />
0.5<br />
1.1<br />
2. Cereales<br />
Mafz (*2)<br />
Arroz<br />
Cebada<br />
Trigo<br />
Otros cereales (*3)<br />
422<br />
1<br />
48<br />
1<br />
--<br />
7,991<br />
1<br />
416<br />
12<br />
4<br />
8,413<br />
2<br />
464<br />
13<br />
4<br />
52.3<br />
0.0<br />
2.9<br />
0.1<br />
0.0<br />
<strong>45</strong>9<br />
—<br />
22<br />
_<br />
—<br />
9,178<br />
—<br />
1,530<br />
86<br />
~<br />
9,637<br />
__<br />
1,552<br />
86<br />
-<br />
58.7<br />
0.0<br />
9.5<br />
0.5<br />
0.0<br />
25<br />
__<br />
4<br />
—<br />
1,326<br />
53<br />
6<br />
—<br />
1,351<br />
__<br />
57<br />
6<br />
—<br />
67.8<br />
0.0<br />
2.9<br />
0.3<br />
0.0<br />
508<br />
—<br />
149<br />
10<br />
1<br />
6,192<br />
—<br />
3,110<br />
123<br />
12<br />
6,700<br />
__<br />
3,259<br />
133<br />
13<br />
39.2<br />
0.0<br />
19.1<br />
0.8<br />
0.1<br />
1,414<br />
1<br />
223<br />
11<br />
1<br />
24,687<br />
1<br />
5,109<br />
227<br />
16<br />
26,101<br />
2<br />
5,332<br />
238<br />
17<br />
50.6<br />
0.0<br />
10.3<br />
0.5<br />
0.0<br />
3. Hortalizas<br />
Varias hortalizas (M)<br />
Arveja gr. ver<strong>de</strong><br />
~<br />
15<br />
48<br />
302<br />
48<br />
317<br />
0.3<br />
2.0<br />
2<br />
11<br />
29<br />
271<br />
31<br />
282<br />
0.2<br />
1.7<br />
..<br />
-<br />
__<br />
—<br />
__<br />
-<br />
0.0<br />
0.0<br />
10<br />
12<br />
35<br />
74<br />
<strong>45</strong><br />
86<br />
0.3<br />
0.5<br />
12<br />
38<br />
112<br />
647<br />
124<br />
685<br />
0.2<br />
1.3<br />
1 4. Tuberosas y Rafees<br />
Papa<br />
Olluco<br />
Camote<br />
Yuca<br />
Oca<br />
Otros (*5)<br />
5. Frutales<br />
Plátanos<br />
Cftricos<br />
Otros frutales (*6)<br />
lili. Pastos y Forrajes<br />
Alfalfa<br />
Trébol Rye Grass<br />
Mafz cha<strong>la</strong><br />
Otros forrajes (*7)<br />
Total<br />
114<br />
1<br />
19<br />
22<br />
—<br />
7<br />
16<br />
J<br />
—<br />
91<br />
"2<br />
27<br />
3<br />
59'<br />
927<br />
644<br />
93<br />
3<strong>03</strong><br />
212<br />
~<br />
510<br />
37<br />
12<br />
—<br />
1,906<br />
28<br />
279<br />
8<br />
1,591<br />
15,154<br />
758<br />
94<br />
322<br />
234<br />
—<br />
517<br />
53<br />
15<br />
—<br />
1,997<br />
30<br />
306<br />
11<br />
1,650<br />
16,081<br />
Fuente: ONEC - CENAGRO, 1972: (*1) Incluye mam, coca, maguey y algodón.<br />
(*2) Incluye maíz choclo.<br />
{*3) Incluye avena, centeno.<br />
(*4) Incluye tomate, zanahoria, cebol<strong>la</strong>, ají, zapallo, ca<strong>la</strong>baza, col,<br />
(*5) Incluye pituca, arracacha.<br />
(*6) Incluye mango, chirimoyo, palto, manzano, pepino*<br />
(*7) Incluye gramalote, pasto elefante, sorgo Forrajero y otros postos contro<strong>la</strong>dos ( kikuyo )«<br />
4.7<br />
0.6<br />
2.0<br />
1.5<br />
0.0<br />
3.2<br />
0.3<br />
0.1<br />
—<br />
12.4<br />
0.2<br />
1.9<br />
0.1<br />
10.2<br />
100.0<br />
434<br />
10<br />
11<br />
14<br />
6<br />
3<br />
1<br />
2<br />
-<br />
16<br />
9<br />
6<br />
1<br />
—<br />
1,043<br />
1,368<br />
536<br />
59<br />
16<br />
250<br />
38<br />
-<br />
1<br />
4<br />
54<br />
8<br />
23<br />
20<br />
3<br />
15,380<br />
1,802<br />
546<br />
70<br />
30<br />
256<br />
41<br />
-<br />
2<br />
6<br />
70<br />
17<br />
29<br />
21<br />
3<br />
16,423<br />
11.0<br />
3.3<br />
0.4<br />
0.2<br />
1.6<br />
0.3<br />
0.0<br />
0.0<br />
-<br />
0.4<br />
0.1<br />
0.2<br />
0.1<br />
0.0<br />
100.0<br />
7<br />
—<br />
11<br />
—<br />
-<br />
„<br />
__<br />
~<br />
__<br />
__<br />
—<br />
49<br />
153<br />
11<br />
132<br />
29<br />
—<br />
124<br />
7<br />
_-<br />
—<br />
„<br />
—<br />
._<br />
„<br />
—<br />
1,944<br />
160<br />
11<br />
132<br />
40<br />
—<br />
124<br />
7<br />
—<br />
—<br />
—<br />
__<br />
—<br />
1,993<br />
8.0<br />
0.5<br />
6.6<br />
2.0<br />
0.0<br />
6.2<br />
0.4<br />
0.0<br />
0.0<br />
0.0<br />
0.0<br />
0.0<br />
0.0<br />
0.0<br />
100.0<br />
796<br />
24<br />
—<br />
42<br />
—<br />
10<br />
~<br />
—<br />
400<br />
26<br />
34<br />
—<br />
340<br />
1,990<br />
2,169<br />
788<br />
28<br />
10<br />
1,172<br />
29<br />
— 8<br />
—<br />
712<br />
19<br />
<strong>45</strong><br />
26<br />
622<br />
15,112<br />
2,965<br />
812<br />
28<br />
10<br />
1,214<br />
29<br />
10<br />
8<br />
—<br />
1,112<br />
<strong>45</strong><br />
79<br />
26<br />
962<br />
17,102<br />
17.3<br />
4.7<br />
0.2<br />
0.0<br />
7.1<br />
0.2<br />
0.0<br />
0.0<br />
0.0<br />
6.5<br />
•<br />
0.3<br />
0.5<br />
0.1<br />
5.6<br />
100.0<br />
1,351<br />
35<br />
30<br />
47<br />
48<br />
10<br />
27<br />
5<br />
—<br />
507<br />
37<br />
67<br />
4<br />
399<br />
4,009<br />
4,334<br />
1,428<br />
522<br />
267<br />
1,422<br />
701<br />
<strong>45</strong><br />
24<br />
—<br />
2,672<br />
55<br />
347<br />
54<br />
2,216<br />
47,590<br />
5,685<br />
1,463<br />
552<br />
314<br />
1,470<br />
711<br />
72<br />
29<br />
—<br />
3,179<br />
92<br />
414<br />
58<br />
2,615<br />
51,599<br />
11.0<br />
2.8<br />
1.1<br />
0.6<br />
2.8<br />
1.4<br />
0.1<br />
0.1<br />
0.0<br />
6.2<br />
0.2<br />
0.8<br />
0.1<br />
5.1<br />
100.0<br />
O<br />
z<br />
><br />
z<br />
o<br />
P1<br />
o<br />
m<br />
><br />
><br />
><br />
o
ANEXO VI-DIAGNÓSTICO AGROPECUARIO Pág. 117<br />
CUADRO N" 2<br />
AREA FÍSICA DE PRODUCCIÓN SECTOR II ( SUR )<br />
1974- 1975<br />
Cajamarca<br />
San Mi ]uel<br />
Contumazá<br />
Total<br />
Cultivos<br />
Riega<br />
Secano<br />
Total<br />
Riego<br />
Secano<br />
Total<br />
Riego<br />
Secano<br />
Total<br />
Riego<br />
Secano<br />
Tota<br />
Ha.<br />
Ha.<br />
Ha.<br />
%<br />
Ha.<br />
Ha.<br />
Ha.<br />
%<br />
Ha.<br />
Ha.<br />
Ha.<br />
%<br />
Ha.<br />
Ha.<br />
Ha.<br />
%<br />
1. Industriales<br />
Caña <strong>de</strong> azúcar<br />
Café<br />
Otros cultivos (1)<br />
327<br />
304<br />
3<br />
20<br />
512<br />
505<br />
— 7<br />
M9<br />
809<br />
3<br />
27<br />
4.8<br />
4..6<br />
0.0<br />
0.2<br />
9<br />
._<br />
6<br />
3<br />
1^<br />
1<br />
—<br />
J2<br />
7<br />
3<br />
M<br />
0.0<br />
0.1<br />
0.0<br />
16<br />
14<br />
—<br />
2<br />
5<br />
_<br />
- 5<br />
121<br />
114<br />
« 7<br />
3.0<br />
2.8<br />
0.0<br />
0.2<br />
<strong>45</strong>2<br />
418<br />
9<br />
25<br />
518<br />
505<br />
1<br />
12<br />
'70<br />
923<br />
10<br />
37<br />
2.9<br />
2.8<br />
0.0<br />
0.1<br />
lU Alimenticios<br />
3 44?<br />
12,707<br />
16,156<br />
91.6<br />
4,138<br />
5,529<br />
9,667<br />
86.4<br />
1,634<br />
2,242<br />
3 676<br />
9 .8<br />
9,221<br />
20 478<br />
29,699<br />
90.3<br />
1. Menestras<br />
Frijol<br />
Haba<br />
Lenteja<br />
2. Cereales<br />
142<br />
60<br />
5<br />
59<br />
192<br />
<strong>45</strong><br />
149<br />
201<br />
952<br />
<strong>45</strong><br />
154<br />
1.1<br />
5.4<br />
0.3<br />
0.9<br />
1<strong>03</strong><br />
349<br />
5<br />
—<br />
3<br />
7)5<br />
52<br />
-<br />
106<br />
1,(54<br />
57<br />
—<br />
0.9<br />
9.4<br />
1.5<br />
0.0<br />
57<br />
30<br />
6<br />
<strong>45</strong><br />
10<br />
202<br />
13<br />
2<br />
67<br />
232<br />
19<br />
47<br />
.6<br />
5.6<br />
0.5<br />
.1<br />
302<br />
439<br />
11<br />
50<br />
72<br />
1,799<br />
110<br />
151<br />
374<br />
2,238<br />
121<br />
201<br />
1.1<br />
6.8<br />
0.4<br />
0.6<br />
Mafz (2)<br />
Arroz<br />
Cebada<br />
Trigo<br />
Otros cereales (3)<br />
3. Hortalizas<br />
Varios hortalizas (4)<br />
Arveja gr. vei<strong>de</strong><br />
4. Tuberosas y RoTces<br />
1 300<br />
155<br />
369<br />
239<br />
—<br />
123<br />
206<br />
2,646<br />
2<br />
4, )72<br />
1, ¡11<br />
25<br />
50<br />
731<br />
3,944<br />
157<br />
4,44!<br />
2,050<br />
25<br />
173<br />
937<br />
22.4<br />
).9<br />
25.2<br />
1 1.6<br />
0.1<br />
1.0<br />
5.3<br />
1,570<br />
275<br />
505<br />
238<br />
27<br />
57<br />
35<br />
9<strong>45</strong><br />
l,!4é<br />
136<br />
48<br />
12<br />
66<br />
2,515<br />
275<br />
2,351<br />
1,074<br />
75<br />
69<br />
101<br />
22.5<br />
2.5<br />
21.0<br />
9.6<br />
0.7<br />
0.6<br />
0.9<br />
639<br />
3<strong>03</strong><br />
65<br />
19<br />
1<br />
__<br />
—<br />
98<br />
6<br />
.173<br />
1,222<br />
2<br />
22<br />
837<br />
309<br />
538<br />
1 341<br />
1<br />
2<br />
22<br />
20.3<br />
7.5<br />
13.0<br />
3 .5<br />
0.0<br />
.0<br />
0.5<br />
3,509<br />
733<br />
939<br />
596<br />
28<br />
80<br />
241<br />
3,789<br />
8<br />
6,391<br />
3,869<br />
73<br />
64<br />
819<br />
7,298<br />
741<br />
7,330<br />
4,465<br />
101<br />
244<br />
1,060<br />
'<br />
22."2<br />
2.3<br />
2.3 1<br />
3.6 f<br />
0.3<br />
0.7<br />
3.2<br />
Papa<br />
Olluco<br />
Camote<br />
Yuca<br />
Oca<br />
Otros (5)<br />
5. Frutales<br />
Plátanos<br />
Crtricos<br />
1 Otrdi frutales (6)<br />
2<strong>45</strong><br />
9<br />
90<br />
227<br />
18<br />
2<br />
134<br />
11<br />
114<br />
1,186<br />
669<br />
12<br />
21<br />
329<br />
1<br />
"<br />
7<br />
1,431<br />
678<br />
102<br />
248<br />
347<br />
3<br />
141<br />
11<br />
114<br />
8.1<br />
3.8<br />
).6<br />
1.4<br />
2.0<br />
0.0<br />
0.8<br />
0.1<br />
0.6<br />
683<br />
16<br />
102<br />
120<br />
2<br />
—<br />
24<br />
14<br />
13<br />
560<br />
:J8<br />
4<br />
S<br />
153<br />
—<br />
__<br />
3<br />
"<br />
1,243<br />
304<br />
106<br />
128<br />
153<br />
— ,<br />
24<br />
17<br />
13<br />
11.1<br />
2.7<br />
0.9<br />
1.2<br />
1.4<br />
0.0<br />
0.2<br />
).2<br />
0.1<br />
71<br />
3<br />
61<br />
92<br />
3<br />
—<br />
18<br />
1<br />
20<br />
<strong>45</strong><br />
21<br />
3<br />
1<br />
20<br />
—<br />
„<br />
2<br />
—<br />
216<br />
24<br />
64<br />
93<br />
23<br />
—<br />
18<br />
3<br />
20<br />
.2<br />
1.6<br />
.6<br />
2.2<br />
0.6<br />
0.0<br />
0.4<br />
0.1<br />
0.5<br />
1,099<br />
28<br />
253<br />
439<br />
23<br />
2<br />
176<br />
26<br />
147<br />
1,791<br />
978<br />
19<br />
30<br />
502<br />
1<br />
7<br />
5<br />
—<br />
2,890<br />
1,006<br />
272<br />
469<br />
525<br />
3<br />
183<br />
31<br />
147<br />
8.8<br />
3.1<br />
0.8<br />
1.4<br />
1.6<br />
0.0<br />
0.6<br />
0.1<br />
0.4<br />
III. Pastos y Forrajes<br />
472<br />
149<br />
621<br />
3^6<br />
_ZZ1<br />
725<br />
1,496<br />
13.5<br />
128<br />
4<br />
_132<br />
3.2<br />
1,371<br />
878<br />
2,249<br />
6.8 |<br />
Alfalfo<br />
Trébol Rye Grass<br />
MaTz cha<strong>la</strong><br />
Otros forrajes (7)<br />
236<br />
83<br />
29<br />
124<br />
6<br />
37<br />
7fr<br />
30<br />
242<br />
120<br />
105<br />
154<br />
1.4<br />
0.7<br />
0.6<br />
0.9<br />
110<br />
639<br />
8<br />
14<br />
22<br />
16<br />
10<br />
677<br />
132<br />
655<br />
18<br />
691<br />
1.2<br />
5.9<br />
0.2<br />
6.2<br />
98<br />
7<br />
—<br />
23<br />
2<br />
—<br />
2<br />
—<br />
100<br />
7<br />
2<br />
23<br />
2.4<br />
0.2<br />
0.0<br />
0.Í<br />
444<br />
729<br />
37<br />
161<br />
30<br />
53<br />
88<br />
707<br />
474<br />
782<br />
125<br />
868<br />
1.4<br />
2.4<br />
0.4<br />
2.6<br />
Total<br />
—4,248<br />
13,368<br />
17,616<br />
100.0<br />
4,918<br />
6,255<br />
11,173<br />
100,0<br />
1,878<br />
2,251<br />
4,129<br />
100.0<br />
11,044<br />
21,874<br />
32,918<br />
100.0<br />
Fuente : ONEC - CENAGRO 1972<br />
(1) Incluye mam, coca, maguey y algodón,<br />
(2) Incluye maíz, choclo.<br />
(3) Incluye avena, centeno»<br />
(4) Incluye tomate, zanahoria, cebol<strong>la</strong>, ají", zapallo, ca<strong>la</strong>bazo, col,<br />
(5) Incluye pituca, arracacha.<br />
(6) Incluye mango, chirimoyo, palto, manzano, pepino.<br />
(7) Incluye gramalote, pasto elefante, sorgo forrajero y otras pastos contro<strong>la</strong>dos ( kíkuyo ).
118 ZONA N C! HT K D K C A I A .,1 ,\
ANEXO VI'DIAGNOSTICO AGROPECUARIO Pág. 119<br />
CUADRO N° 4<br />
VOLUMEN Y VALOR DE LA PRODUCCIÓN AGRÍCOLA DEL SUBSECTOR CHOTA<br />
( 1974 - 1975 )<br />
Cultivo<br />
Area Anual <strong>de</strong><br />
Producción<br />
Ha<br />
"Jo<br />
Kg<br />
/Ha<br />
\ f olu men<br />
T M<br />
"/o<br />
Precio<br />
Promedio<br />
en<br />
Chacra<br />
SI<br />
/Kg<br />
SI /Ha<br />
Valor<br />
Miles <strong>de</strong> SI.<br />
"lo<br />
i<br />
í<br />
Industriales<br />
r 3<br />
0 "<br />
1 053<br />
n o<br />
.,<br />
..<br />
8 r 3<br />
0 8<br />
i<br />
Caña <strong>de</strong> azúcar *<br />
|café<br />
lOtros cultivos<br />
66<br />
5<br />
2<br />
0 4<br />
0.0<br />
0 0<br />
50 000<br />
300<br />
300<br />
1 650<br />
2<br />
1<br />
7,8<br />
0 0<br />
0 0<br />
0,50<br />
20 00<br />
30,00<br />
25,000<br />
6,000<br />
9,000<br />
825<br />
30<br />
18<br />
0 8 |<br />
0.0 '<br />
0 0<br />
II.<br />
Alimenticios<br />
16,280<br />
99,2<br />
--<br />
18,663<br />
88 7<br />
"<br />
--<br />
100,780<br />
98 9<br />
Mafz<br />
Papa<br />
Arveja grano seco<br />
Arveja grano ver<strong>de</strong><br />
Cebada<br />
Olluco<br />
iLenteja<br />
Oca<br />
Camote<br />
[Trigo<br />
i Frijol<br />
Hortalizas vanas<br />
Haba<br />
Otros tubérculos<br />
Yuca<br />
Cítricos<br />
Plátanos<br />
1<br />
III" Pastos'y Forra<br />
l 0 j ¿i<br />
1<br />
pVWfaj I£o v 0¡i<br />
Otros forrajes<br />
Total<br />
18<br />
_.<br />
9 637<br />
1,802<br />
1,416<br />
282<br />
1,552<br />
546<br />
390<br />
256<br />
70<br />
86<br />
96<br />
31<br />
37<br />
41<br />
30<br />
6<br />
2<br />
)0 s ¡(.n<br />
1 V<br />
29<br />
33<br />
16 423<br />
58 3<br />
11 0<br />
8 6<br />
1.7<br />
9.5<br />
3.3<br />
2.4<br />
1,6<br />
0 4<br />
0 5<br />
0 6<br />
0 2<br />
0 2<br />
0 3<br />
Q 2<br />
0 0<br />
0 0<br />
C i Á 4 í<br />
or { r ( ) i ^<br />
fa «<br />
•
Pig. 320<br />
ZONA NORTt: DE CAJA MA RCA<br />
CUADRO N e 5<br />
VOLUMEN Y VALOR DE LA PRODUCCIÓN AGRÍCOLA DEL SUBSECTOR SANFA CRUZ<br />
( 1974- 1975 )<br />
Cultivos<br />
Area Anual <strong>de</strong><br />
Producción<br />
Ha.<br />
%<br />
Kg./Ha.<br />
Volumen<br />
T.M.<br />
%<br />
."recio<br />
Promedio<br />
en<br />
Chacra<br />
S/, /Kg,<br />
SA/Ha,.<br />
Valor<br />
Miles<br />
<strong>de</strong><br />
s/.<br />
%<br />
1. Industriales<br />
21<br />
1.1<br />
—<br />
352<br />
12.2<br />
—<br />
—<br />
217<br />
2.0<br />
Caña <strong>de</strong> azúcar *<br />
Cafe<br />
14<br />
7<br />
0.7<br />
0.4<br />
50,000<br />
300<br />
350<br />
2<br />
12.1<br />
0.1<br />
0.50<br />
20*00<br />
25,000<br />
6,000<br />
175<br />
42<br />
1.6<br />
0.4<br />
II. Alimenticios<br />
1,972<br />
98.9<br />
—<br />
2,543<br />
87.8<br />
—<br />
—<br />
10,434<br />
98.0 1<br />
IMaiz<br />
Papa<br />
Otros tubérculos<br />
Arveja grano seco<br />
Cebada<br />
Yuca<br />
Camote<br />
Plátanos<br />
Olluco<br />
Frijol<br />
Trigo<br />
1,351<br />
160<br />
124<br />
72<br />
57<br />
40<br />
132<br />
7<br />
11<br />
12<br />
6<br />
67.8<br />
8.0<br />
6.2<br />
3.6<br />
2.9<br />
2.0<br />
6.6<br />
0.4<br />
0.5<br />
0.6<br />
0.3<br />
400<br />
5,000<br />
4,000<br />
300<br />
500<br />
3,500<br />
3,500<br />
4,000<br />
2,000<br />
200<br />
400<br />
540<br />
800<br />
496<br />
2?.<br />
29<br />
140<br />
462<br />
28<br />
22<br />
2<br />
2<br />
18.6<br />
27.6<br />
17.1<br />
0.8<br />
1.0<br />
4.8<br />
15.9<br />
1.0<br />
0.8<br />
0.1<br />
0.1<br />
10.00<br />
3.50<br />
1.00<br />
20.00<br />
8.00<br />
1.50<br />
1.50<br />
2.00<br />
2.50<br />
15.00<br />
10.00<br />
4,000<br />
17,500<br />
4,000<br />
6,000<br />
4,000<br />
5,250<br />
5,250<br />
8,000<br />
5,000<br />
3,000<br />
4,000<br />
5,404<br />
2,800<br />
496<br />
432<br />
228<br />
210<br />
693<br />
56<br />
55<br />
56<br />
24<br />
50.8<br />
26.3<br />
4.7<br />
4.1<br />
2.1<br />
2.0<br />
6.5<br />
0.5<br />
0.5<br />
0.3<br />
0.2<br />
Total<br />
1,993<br />
100.0<br />
—<br />
2,895<br />
100.0<br />
—<br />
—<br />
10,651<br />
IOO.OI<br />
(*) 50^0 área <strong>de</strong> cosecha anual <strong>de</strong> caf<strong>la</strong> <strong>de</strong> azdcar,<br />
Fuente; ONERN, 1975,
A Nh KO V ! b l \ Ci \Oi 1 a O A( HOt b( f ARIO Pág, 121<br />
i ADUO N b<br />
f V \ \U >F I \ t'KOU ( I IO\ At kiC Ol n Dtl -UB'-R 1 OR HUAL&AYOC<br />
19/4 19 ><br />
Valor<br />
S/ /Ha.<br />
Miles <strong>de</strong><br />
S/.<br />
II<br />
A i mcnticich<br />
106 ^3S<br />
apa<br />
Mai/<br />
C e id <strong>la</strong> !<br />
O. i<br />
Ol'uc».<br />
A L J -l i_,'ari ) itt < |<br />
A i ¡a si in-> vt tli I<br />
Haia<br />
Lcmcjd<br />
Ho i il /as \ai as<br />
i<br />
i '<br />
i a iioie<br />
Out 5 inb? i i It)<br />
P<strong>la</strong>t iocs<br />
Y! d<br />
eft<br />
•,<br />
Ortos ce ealt<br />
'<br />
I<br />
1 7 500<br />
4,000<br />
4,000<br />
4,000<br />
5,000<br />
6,000<br />
7,800<br />
4,500<br />
4,000<br />
5,000<br />
8,000<br />
3..000<br />
5 3 ¿o0<br />
4,000<br />
8,000<br />
i:,2b0<br />
6,000<br />
3 S 480<br />
51,888<br />
26,800<br />
13,<strong>03</strong>6<br />
4.856<br />
4,060<br />
671<br />
576<br />
532<br />
385<br />
360<br />
' 153<br />
147<br />
i 16<br />
80<br />
53<br />
48<br />
<strong>45</strong><br />
pil<br />
I<br />
P-is» s ^ í o'taje<br />
2,333<br />
O t )S tuUdJCS<br />
1 u bol i Rye ntds<br />
^ haiia<br />
K< da<strong>la</strong><br />
l.jOO<br />
4,800<br />
7,200<br />
i 200<br />
1,443<br />
3?9<br />
324<br />
IH" 1<br />
1 o ! a J<br />
1 L 10<br />
108,671<br />
futpu ONIRN, (9/
Pág. 122 ZONA NORTE DE CAJAMARCA<br />
CUADRO N° 7<br />
VOLUMEN Y VALOR DE LA PRODUCCIÓN AGRICOI \ DEL SUBSECTOR CAJAMARCA<br />
( 1974 " 1975 )<br />
C ultivos<br />
Area Anual <strong>de</strong><br />
Producción<br />
Ha.<br />
lo<br />
Kg./Ha,<br />
Volumen<br />
T,M C<br />
lo<br />
Precio<br />
Promedio<br />
en<br />
Chacra<br />
S/,/Kg<br />
SI /Ha.<br />
Valor<br />
Miles SI<br />
lo<br />
ll,<br />
Industríales<br />
839<br />
4 8<br />
„,-<br />
20 209<br />
<strong>45</strong> 4<br />
,=<br />
-'<br />
10,361<br />
9,5<br />
J<br />
'Caña!<strong>de</strong> azúcar*<br />
Otros cultivos<br />
Café<br />
809<br />
27<br />
3<br />
4,6<br />
0.2<br />
0,0<br />
50,000<br />
300<br />
300<br />
20,200<br />
8<br />
1<br />
<strong>45</strong>,4<br />
0,0<br />
0 0<br />
0 50<br />
30,00<br />
20.00<br />
25,000<br />
9,000<br />
6 S 000<br />
10 100<br />
243<br />
18<br />
9.3<br />
0,2<br />
0,0<br />
II.<br />
Alimenticios<br />
16 156<br />
91 6<br />
--<br />
18,715<br />
42,1<br />
..<br />
--<br />
95,012<br />
87.5<br />
Papa<br />
Cebada<br />
Mafz<br />
Trigo<br />
Arveja grano ver<strong>de</strong><br />
Arveja grano seco<br />
Arroz<br />
Olluco<br />
Oca<br />
Hortalizas varias<br />
Yuca<br />
Plátanos<br />
Lenteja<br />
Frijol<br />
Otros frutales<br />
Camote<br />
Haba<br />
Otros cereales<br />
Cítricos<br />
Otros tubérculos<br />
1.431<br />
4,441<br />
3 946<br />
2,050<br />
937<br />
952<br />
157<br />
678<br />
347<br />
173<br />
248<br />
141<br />
154<br />
201<br />
114<br />
102<br />
<strong>45</strong><br />
25<br />
11<br />
3<br />
8.1<br />
25.2<br />
22,4<br />
11,6<br />
5,3<br />
5„4<br />
0.9<br />
3,8<br />
2„0<br />
1.0<br />
1.4<br />
0 8<br />
0 9<br />
1.1<br />
0.6<br />
0,6<br />
0.3<br />
0,1<br />
0,1<br />
0 0<br />
5,000<br />
500<br />
400<br />
400<br />
1,300<br />
300<br />
3 000<br />
2,000<br />
2,000<br />
4,000<br />
3 500<br />
4,000<br />
250<br />
200<br />
2,500<br />
3,500<br />
300<br />
400<br />
3,000<br />
4,000<br />
7,155<br />
2,221<br />
1,578<br />
820<br />
1,218<br />
286<br />
471<br />
1,356<br />
694<br />
692<br />
868<br />
564<br />
39<br />
40<br />
285<br />
357<br />
16<br />
10<br />
33<br />
12<br />
16 1<br />
5„0<br />
3,5<br />
1.8<br />
2,7<br />
0,6<br />
1 1<br />
3,1<br />
1,6<br />
1,6<br />
2,0<br />
1.3<br />
0,1<br />
0.1<br />
0,6<br />
0 8<br />
0,0<br />
0,0<br />
0,1<br />
0 0<br />
3-50<br />
8,00<br />
10,00<br />
10 00<br />
6,00<br />
20 00<br />
8,00<br />
2.50<br />
2,00<br />
2 00<br />
1.50<br />
2 00<br />
20.00<br />
15.00<br />
2,00<br />
1 50<br />
15,00<br />
8.00<br />
2 00<br />
1 00<br />
17,500<br />
4,000<br />
4,000<br />
4,000<br />
7,800<br />
6,000<br />
24,000<br />
5,000<br />
4,000<br />
8,000<br />
5,250<br />
8,000<br />
5,000<br />
3,000<br />
5,000<br />
5,250<br />
4,500<br />
3,200<br />
6 000<br />
4 000<br />
25,043<br />
17.764<br />
15,784<br />
8,200<br />
7,309<br />
5,712<br />
3,768<br />
3,390<br />
1,388<br />
1,384<br />
1,302<br />
1,128<br />
770<br />
6<strong>03</strong><br />
570<br />
536<br />
2<strong>03</strong><br />
80<br />
66<br />
12<br />
23.0<br />
16,4<br />
14,3<br />
7,5<br />
6 7<br />
5 3<br />
3,5<br />
3 1<br />
1 3<br />
1 3<br />
1,2<br />
1,1<br />
0.7<br />
0,6<br />
0 -D<br />
0 5<br />
0,2<br />
0 1<br />
0,1<br />
0,0<br />
III.<br />
Pastos y Forraje<br />
621<br />
3,6<br />
o -<br />
5,586<br />
12,5<br />
-~<br />
..<br />
3 305<br />
3 0<br />
Alfalfa<br />
Maíz cha<strong>la</strong><br />
Trébol i Rye grass<br />
Otros forrajes<br />
242<br />
105<br />
120<br />
154<br />
1,4<br />
0.6<br />
0,7<br />
0 9<br />
12,000<br />
12,000<br />
8,000<br />
3,000<br />
2 904<br />
1,260<br />
960<br />
462<br />
6,5<br />
2 8<br />
2,2<br />
1,0<br />
0 60<br />
0,60<br />
0,60<br />
0,50<br />
7 200<br />
7,200<br />
4,800<br />
1,500<br />
1 7'2<br />
751><br />
576<br />
231<br />
1 b,<br />
0 7<br />
0 5<br />
0,2<br />
Total<br />
17,616<br />
100,0<br />
-.<br />
44.510<br />
100,0<br />
..<br />
--<br />
108 678<br />
t<br />
100,0<br />
(*) El área <strong>de</strong> cosecha anual <strong>de</strong> caña <strong>de</strong> azúcar equivale al 50^0<br />
Fuente ONERN 1975
ANEXO VI-DIAGNOSTICO AGROPECUARIO<br />
Pág, 123<br />
CUADRO N 8<br />
VOLUMEN Y VALOR DE LA PRODUCCIÓN AGRÍCOLA DEL SUBSECTOR SAN MIGUEL<br />
( 1974 - 1975 )<br />
Cultivos<br />
Area Anual <strong>de</strong><br />
Producción<br />
Ha.<br />
lo<br />
1<br />
Kg. /Ha,<br />
Volumen<br />
T,M,<br />
"h<br />
i<br />
P; -.ció<br />
Promedio<br />
en<br />
Chacra<br />
S/. /Kg,<br />
S/ e /Ha,<br />
Va lot<br />
Miles<br />
<strong>de</strong> S/-<br />
«h<br />
I, Industriales<br />
10<br />
0,1<br />
--<br />
3<br />
0,0<br />
--<br />
--<br />
69<br />
0,1<br />
Café<br />
Otros cultivos<br />
7<br />
3<br />
0.1<br />
0,0<br />
300<br />
300<br />
2<br />
1<br />
0.0<br />
0.0<br />
20,00<br />
30,00<br />
6,000<br />
9 000<br />
42<br />
27<br />
0 1<br />
0 0<br />
II,<br />
Alimenticios<br />
9,667<br />
CS 4<br />
--<br />
12 s 355<br />
57.6<br />
--<br />
-*<br />
64, 302<br />
92,3<br />
Papa<br />
Mafz<br />
Arroz<br />
Arveja grano seco<br />
Arveja grano ver<strong>de</strong><br />
Trigo<br />
Olluco<br />
Cebada<br />
Yuca<br />
Oca<br />
Camote<br />
Hortalizas varias<br />
Frijol<br />
Haba<br />
Otros cereales<br />
Plátanos<br />
Cítricos<br />
Otros frutales<br />
1,243<br />
2,515<br />
275<br />
1,054<br />
101<br />
1,074<br />
304<br />
2,351<br />
128<br />
155<br />
106<br />
69<br />
106<br />
S" 7<br />
75<br />
24<br />
17<br />
13<br />
11.1<br />
22,5<br />
2,5<br />
9-4<br />
0.9<br />
9,6<br />
2 r 7<br />
21,0<br />
1,2<br />
1.4<br />
0,9<br />
0.6<br />
0,9<br />
0 P 5<br />
0,7<br />
0,2<br />
0.2<br />
0,1<br />
5 S 000<br />
400<br />
3,000<br />
300<br />
1,300<br />
400<br />
2,000<br />
500<br />
3,500<br />
2,000<br />
3,500<br />
4,000<br />
200<br />
300<br />
400<br />
4 S 000<br />
3,000<br />
2,500<br />
6, 210*<br />
1,006<br />
825<br />
316<br />
131<br />
430<br />
608<br />
1,176<br />
448<br />
310<br />
371<br />
276<br />
21<br />
17<br />
30<br />
96<br />
51<br />
33<br />
28,9<br />
4,7<br />
3,8<br />
1.5<br />
0,6<br />
2,0<br />
2,8<br />
5,5<br />
2,1<br />
1,5<br />
1,7<br />
1,3<br />
0.1<br />
0,1<br />
0.1<br />
0,5<br />
0,2<br />
0.,2<br />
3.50<br />
10,00<br />
8.00<br />
20,00<br />
6,00<br />
10,00<br />
2,50<br />
8,00<br />
1,50<br />
2,00<br />
1,50<br />
2,00<br />
15,00<br />
15,00<br />
8,00<br />
2.00<br />
2.00<br />
2,00<br />
17,486<br />
4 000<br />
24,000<br />
6,000<br />
7,800<br />
4,000<br />
5,000<br />
400<br />
5,250<br />
4,000<br />
5,250<br />
8,000<br />
3 3 000<br />
4,500<br />
3,200<br />
8,000<br />
6 000<br />
5,000<br />
21 735<br />
10 060<br />
6 600<br />
6,324<br />
788<br />
4,296<br />
1,520<br />
9,404<br />
672<br />
620<br />
557<br />
552<br />
318<br />
257<br />
240<br />
192<br />
102<br />
65<br />
31.1<br />
14,4<br />
9 5<br />
9 1<br />
1 1<br />
6 2<br />
2 2<br />
13,5<br />
1 0<br />
0 9<br />
0,8<br />
0.8<br />
0,5<br />
0,4<br />
C 3<br />
0 3<br />
0.. 1<br />
0,1<br />
III,, Pastos y Forrajes<br />
1 5 496<br />
li 5<br />
--<br />
9.113<br />
42,4<br />
--<br />
--<br />
5-282<br />
7,6'<br />
Trébol * Rye grass<br />
Otros forrajes<br />
Alfalfa<br />
Maíz cha<strong>la</strong><br />
655<br />
691<br />
132<br />
18<br />
5.9<br />
6,2<br />
1,2<br />
0 2<br />
8,000<br />
3,000<br />
12,000<br />
12,. 000<br />
5 S 240<br />
2 S 073<br />
1,584<br />
216<br />
24.4<br />
9,6<br />
7,4<br />
1 0<br />
0.60<br />
0,50<br />
0,60<br />
0,70<br />
4 S 800<br />
l r 500<br />
7,200<br />
8,400<br />
3 144<br />
1,<strong>03</strong>7<br />
950<br />
151<br />
4,5<br />
1,5<br />
1.4<br />
0.2<br />
Total<br />
11,173<br />
100,0<br />
.-<br />
21 471<br />
100.0<br />
.-<br />
—<br />
eg.ess<br />
100,0<br />
O<br />
Promedio Pon<strong>de</strong>rado<br />
Fuente ;ONERN.
Pág„ 124<br />
ZON \ NOR1 t DE C A JAMA RC A<br />
CUADRO N° 9<br />
VOLUMEN Y VALORDELA PRODUCCIÓN AGRÍCOLA DEL SUHSEC1 OR CONIUMAZA<br />
Cultivos<br />
I- Industriales<br />
Area Anual <strong>de</strong><br />
ProducciGn<br />
lia<br />
121<br />
lo<br />
3 0<br />
( 1974 " 1975 )<br />
Volumen<br />
Kg ^Ha T M<br />
-- 2 t 852<br />
%<br />
34 5<br />
Precio<br />
Pro<br />
medio<br />
en<br />
Chacra<br />
S/ /Kg<br />
.-<br />
b /<br />
--<br />
Ha<br />
Valor i 1<br />
Miles dv;<br />
S/<br />
1 488<br />
'/o<br />
5 3<br />
1<br />
i<br />
Caña <strong>de</strong> azúcar*<br />
Otros cultivos<br />
1 .<br />
i<br />
II<br />
Alimenticios<br />
114<br />
7<br />
3,876<br />
2 8<br />
0 2<br />
93 8<br />
50,000<br />
300<br />
--<br />
2,850<br />
2<br />
4 060<br />
34 5<br />
0 0<br />
49 2<br />
0 50<br />
30 00<br />
--<br />
25 000<br />
9.000<br />
..<br />
1 425<br />
63<br />
25 463<br />
5,1<br />
0 2<br />
91 8<br />
Arroz<br />
Trigo<br />
Papa<br />
Maíz<br />
Cebada<br />
Arveja grano seco<br />
Arveja grano ver<strong>de</strong><br />
Yuca<br />
Camote<br />
Lenteja<br />
Frijol<br />
Plátanos<br />
Olluco<br />
Otros frutales<br />
Oca<br />
Haba<br />
Cítricos<br />
Hortalizas varias<br />
Otros cereales<br />
309<br />
1,341<br />
216<br />
837<br />
538<br />
232<br />
22<br />
93<br />
64<br />
47<br />
67<br />
18<br />
24<br />
20<br />
23<br />
19<br />
3<br />
2<br />
1<br />
7 5<br />
32 5<br />
5,2<br />
20 3<br />
13 0<br />
5 6<br />
0 5<br />
2 2<br />
1.6<br />
1 1<br />
1 6<br />
04<br />
0 6<br />
0 5<br />
0 6<br />
0 5<br />
0 1<br />
0.0<br />
0 0<br />
3,000<br />
400<br />
5 3 000<br />
400<br />
500<br />
300<br />
1 300<br />
3 500<br />
3,500<br />
250<br />
200<br />
4 000<br />
2,000<br />
2 r 500<br />
2,000<br />
300<br />
3 000<br />
4.000<br />
400<br />
927<br />
536<br />
1,080<br />
335<br />
269<br />
70<br />
29<br />
326<br />
224<br />
12<br />
13<br />
72<br />
48<br />
50<br />
46<br />
6<br />
9<br />
8<br />
11 2<br />
6 5<br />
13,1<br />
4 0<br />
3 3<br />
0 8<br />
0 4<br />
3 9<br />
2,7<br />
0 1<br />
0 2<br />
0 C 9<br />
0 6<br />
0 6<br />
0 6<br />
0 1<br />
0,1<br />
0 1<br />
S^OO<br />
10 00<br />
3.50<br />
10 00<br />
8 00<br />
20 00<br />
6 00<br />
1 50<br />
1 50<br />
20 00<br />
15 00<br />
2.00<br />
2 50<br />
2 00<br />
2 00<br />
15 00<br />
2 00<br />
2 00<br />
8 00<br />
24 000<br />
4,000<br />
17,500<br />
4 000<br />
4 000<br />
6 000<br />
7 800<br />
5 250<br />
5 250<br />
5 000<br />
3 000<br />
8 S 000<br />
5,000<br />
5 000<br />
4 000<br />
4 500<br />
6 000<br />
8 000<br />
3,200<br />
7 r 416<br />
5 364<br />
3 780<br />
3,348<br />
2,152<br />
1,392<br />
172<br />
488<br />
336<br />
235<br />
201<br />
144<br />
120<br />
100<br />
92<br />
86<br />
18<br />
16<br />
3<br />
26 7<br />
19 3<br />
13 6<br />
12,1<br />
7 8<br />
5,0<br />
0 6<br />
1 8<br />
1 2<br />
0 9<br />
0 7<br />
0 o<br />
0 4<br />
0 4<br />
0 3<br />
0 3<br />
0,1<br />
0 1<br />
0 0<br />
III<br />
Pastos y Forrajes<br />
132<br />
3 2<br />
--<br />
1 349<br />
16 3<br />
--<br />
806<br />
2 9<br />
Alfalfa<br />
Otros forrajes<br />
Trébol i Rye grass<br />
Maíz cha<strong>la</strong><br />
100<br />
23<br />
7<br />
2<br />
2 4<br />
0 6<br />
0 2<br />
0 0<br />
12 a 000<br />
3 000<br />
8,000<br />
12 000<br />
1 200<br />
69<br />
56<br />
24<br />
14,5<br />
0 8<br />
0 7<br />
0 3<br />
0 60<br />
0 50<br />
0 60<br />
0 70<br />
7 3 200<br />
1 500<br />
4 800<br />
8 400<br />
720<br />
35<br />
34<br />
17<br />
2.6<br />
0 L<br />
0 l<br />
0 1<br />
Total<br />
4 129<br />
100 0<br />
e<br />
8 261<br />
100 0<br />
,.<br />
.,<br />
27 757<br />
100 0<br />
(*) El área <strong>de</strong> cosecha anual <strong>de</strong> caña <strong>de</strong> azúcar equivale al 5QP/o<br />
Fuente ONERN
CUADRO N o 10<br />
COSTOS DIRECTOS DE PRODUCCIÓN AGRÍCOLA EN EL SUBSECTOR CUTERVO<br />
><br />
Z<br />
m<br />
X<br />
O<br />
Cultivos<br />
1. Industriales<br />
Cafia <strong>de</strong> azúcar<br />
Café<br />
Otros cultivos<br />
II. Alimenticios<br />
Mofz<br />
Papa<br />
Arveja grano seco<br />
Otros tubérculos<br />
Arveja grano ver<strong>de</strong><br />
Cebada<br />
Camote<br />
Yuca<br />
Frijol<br />
Haba<br />
Olluco<br />
Lenteja<br />
Mortal izas varias<br />
Plátanos<br />
Trigo<br />
Cítricos<br />
Arroz<br />
Otros cereales<br />
III. Pastos y Forrajes<br />
Otros forrajes<br />
Trébol + Rye grass<br />
Alfalfa<br />
Maíz cha<strong>la</strong><br />
Area Anual <strong>de</strong><br />
Producción<br />
Ha.<br />
626<br />
394(1)<br />
229<br />
3<br />
13,<strong>45</strong>8<br />
8,413<br />
758<br />
1,628<br />
517<br />
317<br />
464<br />
322<br />
234<br />
349<br />
116<br />
94<br />
m<br />
48<br />
53<br />
13<br />
15<br />
2<br />
4<br />
1,997<br />
1,650<br />
306<br />
30<br />
11<br />
%<br />
3.9<br />
2.5<br />
1.4<br />
0.0<br />
83.7<br />
52.3<br />
4.7<br />
10.1<br />
3.2<br />
2.0<br />
2.9<br />
2.0<br />
1.5<br />
2.2<br />
0.7<br />
0.6<br />
0.7<br />
0.3<br />
0.3<br />
0.1<br />
0.1<br />
0.0<br />
0.0<br />
12.4<br />
10.2<br />
1.9<br />
0.2<br />
0.1<br />
Miles S/.<br />
Insumes<br />
100<br />
100<br />
—<br />
13,088<br />
3,365<br />
5,988<br />
1,954<br />
259<br />
507<br />
297<br />
161<br />
117<br />
105<br />
93<br />
71<br />
44<br />
106<br />
—<br />
10<br />
— 8<br />
3<br />
_72<br />
._<br />
<strong>45</strong><br />
18<br />
9<br />
%<br />
0.8<br />
0.8<br />
—<br />
98.7<br />
25.4<br />
<strong>45</strong>.2<br />
14.7<br />
2.0<br />
3.8<br />
2.2<br />
1.2<br />
0.9<br />
0.8<br />
0.7<br />
0.5<br />
0.3<br />
0.8<br />
--<br />
0.1<br />
~<br />
0.1<br />
0.0<br />
0.5<br />
0.3<br />
0.1<br />
0.1<br />
Jornales<br />
Ha.<br />
-<br />
120<br />
40<br />
50<br />
~<br />
40<br />
80<br />
30<br />
40<br />
40<br />
25<br />
40<br />
50<br />
20<br />
30<br />
40<br />
30<br />
80<br />
50<br />
30<br />
50<br />
100<br />
25<br />
-<br />
10<br />
30<br />
40<br />
40<br />
Mano <strong>de</strong><br />
Total<br />
Jornales<br />
32,950<br />
23,640<br />
9,160<br />
150<br />
541,020<br />
336,520<br />
60,640<br />
48,840<br />
20,680<br />
12,680<br />
11,600<br />
12,880<br />
11,700<br />
6,980<br />
3,480<br />
3,760<br />
3,330<br />
3,840<br />
2,650<br />
390<br />
750<br />
200<br />
100<br />
27,320<br />
16,500<br />
9,180<br />
1,200<br />
440<br />
Obra<br />
Miles S/.<br />
Val 3r<br />
1,698<br />
1,418<br />
275<br />
5<br />
16,236<br />
10,096<br />
1,819<br />
1,465<br />
620<br />
380<br />
348<br />
386<br />
351<br />
209<br />
104<br />
113<br />
100<br />
115<br />
80<br />
12<br />
23<br />
12<br />
3<br />
819<br />
495<br />
275<br />
36<br />
13<br />
%<br />
9.1<br />
7.6<br />
1.5<br />
0.0<br />
86.5<br />
53.8<br />
9.7<br />
7.8<br />
3.3<br />
2.0<br />
1.9<br />
2.1<br />
1.9<br />
1.1<br />
0.6<br />
0.6<br />
0.5<br />
0.6<br />
0.4<br />
0.1<br />
0.1<br />
0.1<br />
0.0<br />
4.4<br />
2.6<br />
1.5<br />
0.2<br />
0.1<br />
Miles S/.<br />
Tracción<br />
120<br />
%<br />
0.8<br />
120(2) 0.8<br />
~<br />
—<br />
14,899<br />
8,413<br />
1,895<br />
1,954<br />
517<br />
380<br />
464<br />
386<br />
281<br />
175<br />
139<br />
94<br />
133<br />
48<br />
~ 13<br />
— 3<br />
4<br />
-_<br />
86<br />
~<br />
—<br />
98.6<br />
55.7<br />
12.5<br />
12.9<br />
3.4<br />
2.5<br />
3.1<br />
2.6<br />
1.9<br />
1.2<br />
0.9<br />
0.6<br />
0.9<br />
0.3<br />
—<br />
0.1<br />
~<br />
0.0<br />
0.0<br />
0^6<br />
„<br />
30(3) 0.2<br />
<strong>45</strong>(4) 0.3<br />
11 0.1<br />
'<br />
Otros Gastos<br />
Miles S/.<br />
193<br />
164<br />
28<br />
1<br />
4,423<br />
2,187<br />
970<br />
537<br />
140<br />
127<br />
111<br />
93<br />
75<br />
49<br />
34<br />
28<br />
28<br />
27<br />
8<br />
4<br />
2<br />
2<br />
1<br />
_£?<br />
50<br />
35<br />
10<br />
3<br />
%<br />
4.1<br />
3.5<br />
0.6<br />
0.0<br />
93.8<br />
46.3<br />
20.6<br />
11.4<br />
3.0<br />
2.7<br />
2.4<br />
2.0<br />
1.6<br />
1.0<br />
0.7<br />
0.6<br />
0.6<br />
0.6<br />
0.2<br />
0.1<br />
0.0<br />
0.0<br />
0.0<br />
2.1<br />
1.1<br />
0.7<br />
0.2<br />
0.1<br />
Miles S/.<br />
2,111<br />
1,802<br />
3<strong>03</strong><br />
6<br />
48,646<br />
24,061<br />
10,672<br />
5,910<br />
1,536<br />
1,394<br />
1,220<br />
1,026<br />
824<br />
538<br />
370<br />
306<br />
305<br />
296<br />
88<br />
39<br />
25<br />
25<br />
11<br />
1,075<br />
Costo Total<br />
5<strong>45</strong><br />
385<br />
109<br />
36<br />
%<br />
4.1<br />
3.5<br />
0.6<br />
0.0<br />
93.8<br />
46.3<br />
20.6<br />
11.4<br />
3.0<br />
2.7<br />
2.4<br />
2.0<br />
1.6<br />
1.0<br />
0.7<br />
0.6<br />
0.6<br />
0.6<br />
0.2<br />
0.1<br />
0.0<br />
0.0<br />
0.0<br />
Id<br />
1.1<br />
0.7<br />
0.2<br />
0.1<br />
Costo por<br />
Ha.<br />
s/.<br />
—<br />
9,150<br />
1,320<br />
2,000<br />
-<br />
2,860<br />
14,080<br />
3,630<br />
2,970<br />
4,400<br />
2,630<br />
3,180<br />
3,520<br />
f,540<br />
3,190<br />
Í 260<br />
1,750<br />
4,170<br />
1.660<br />
3,000<br />
¿670<br />
12,000<br />
3,750<br />
~<br />
330<br />
1,260<br />
3,630<br />
3,270<br />
><br />
O<br />
z<br />
o<br />
H<br />
1—4<br />
O<br />
O<br />
><br />
o<br />
s<br />
tn<br />
O<br />
G<br />
><br />
70<br />
Total<br />
10,081<br />
100.0<br />
13,260<br />
100.0<br />
-<br />
601,290<br />
18,753<br />
100.0<br />
15,105<br />
100.0<br />
4,714<br />
100.0<br />
51,832<br />
100.0<br />
-<br />
(1) Area <strong>de</strong> cosecha anual 50% <strong>de</strong>l oreo.<br />
(2) Area <strong>de</strong> renovación anual caña <strong>de</strong> azúcar 10%<br />
(3) Area <strong>de</strong> renovación Trébol Ryegrass 10%<br />
(4) Area <strong>de</strong> renovación <strong>de</strong> alfalfa 20%<br />
Fuente: ONERN, 1975.<br />
s<br />
OQ<br />
M<br />
8
1. Industriales<br />
Cul f i vos<br />
Cana <strong>de</strong> azúcar<br />
Café<br />
Otros cultivas<br />
II. Alimenticios<br />
Area Anual <strong>de</strong><br />
Producción<br />
Ha.<br />
73<br />
16,280<br />
66(1)<br />
5<br />
2<br />
%<br />
0.4<br />
0.4<br />
0.0<br />
0.0<br />
99.2<br />
Miles S/.<br />
CUADRO N'11<br />
COSTOS DIRECTOS DE PRODUCCIÓN AGRÍCOLA EN EL SUBSECTOR CHOTA<br />
Insumas<br />
i!<br />
18<br />
~<br />
—<br />
22,221<br />
%<br />
0.1<br />
0.1<br />
~<br />
—<br />
99.7<br />
Jornal<br />
por Ha.<br />
120<br />
40<br />
50<br />
-<br />
( 1974- 1975)<br />
Mano d s- Obra<br />
Total<br />
Jornales<br />
4,260<br />
3,960<br />
200<br />
100<br />
680,410<br />
Miles S/.<br />
247<br />
Va<br />
238<br />
6<br />
3<br />
20,407<br />
or<br />
%<br />
1.1<br />
1.1<br />
0.0<br />
0.0<br />
98.6<br />
Trace ion<br />
Miles S/.<br />
21<br />
21(2)<br />
—<br />
19,365<br />
%<br />
0.1<br />
0.1<br />
~<br />
99.8<br />
Otros Gastos<br />
Miles S/.<br />
29<br />
28<br />
1<br />
—<br />
6,200<br />
%<br />
0.5<br />
0.5<br />
0.0<br />
—<br />
99.3<br />
Miles S/.<br />
Costo Total<br />
315<br />
'<br />
305<br />
7<br />
3<br />
68,193<br />
%<br />
0.4<br />
'"<br />
0.4<br />
0.0<br />
0.0<br />
99.4<br />
Costo por<br />
Ha.<br />
s/.<br />
„<br />
"••"*"<br />
9,240<br />
1,400<br />
1,500<br />
~<br />
N<br />
O<br />
•z<br />
><br />
o<br />
jo<br />
•4<br />
PJ<br />
O<br />
tu<br />
O<br />
><br />
><br />
><br />
n<br />
><br />
Maíz<br />
Papa<br />
Arveja grano seco<br />
Cebada<br />
Olluco<br />
Lenteja<br />
Oca<br />
Trigo<br />
Camote<br />
Hortalizas varias<br />
Frijol<br />
Otras tubérculos<br />
Haba<br />
Y^ica<br />
Crtricos<br />
Plátanos<br />
III. Pastos y Forrajes<br />
9,637<br />
1,802<br />
1,416<br />
1,552<br />
546<br />
282<br />
390<br />
256<br />
86<br />
70<br />
31<br />
96<br />
41<br />
37<br />
30<br />
6<br />
22<br />
70<br />
58.7<br />
11.0<br />
8.6<br />
9.5<br />
3.3<br />
1.7<br />
2.4<br />
1.6<br />
0.5<br />
0.4<br />
0.2<br />
0.6<br />
0.3<br />
0.2<br />
0.2<br />
0.0<br />
0.0<br />
0.4<br />
3,855<br />
14,236<br />
1,699<br />
993<br />
410<br />
<strong>45</strong>1<br />
156<br />
154<br />
69<br />
35<br />
68<br />
29<br />
21<br />
30<br />
15<br />
—<br />
_<strong>45</strong><br />
17.3<br />
63.9<br />
7.Ó<br />
4.5<br />
1.8<br />
2.0<br />
0.7<br />
0.7<br />
0.3<br />
0.2<br />
0.3<br />
0.1<br />
0.1<br />
0.1<br />
0.1<br />
—<br />
0.2<br />
40<br />
80<br />
30<br />
25<br />
40<br />
40<br />
30<br />
40<br />
30<br />
40<br />
80<br />
20<br />
40<br />
30<br />
50<br />
50<br />
50<br />
~<br />
385,480<br />
144,160<br />
42,480<br />
38,800<br />
21,840<br />
11,280<br />
11,700<br />
10,240<br />
2,580<br />
2,800<br />
2,480<br />
1,920<br />
1,640<br />
1,110<br />
1,500<br />
300<br />
100<br />
2,420<br />
11,564<br />
4,325<br />
1,274<br />
1,164<br />
655<br />
338<br />
351<br />
307<br />
77<br />
84<br />
74<br />
58<br />
49<br />
33<br />
<strong>45</strong><br />
6<br />
3<br />
74<br />
55.9<br />
20.9<br />
6.1<br />
5.6<br />
3.2<br />
1.6<br />
1.7<br />
1.5<br />
0.4<br />
0.4<br />
0.4<br />
0.3<br />
0.2<br />
0.2<br />
0.2<br />
0.0<br />
0.0<br />
(U<br />
9,637<br />
4,505<br />
1,699<br />
1,552<br />
546<br />
338<br />
468<br />
256<br />
86<br />
84<br />
31<br />
48<br />
41<br />
44<br />
30<br />
—<br />
30<br />
49.7<br />
23.3<br />
8.8<br />
8.0<br />
2.8<br />
1.7<br />
2.4<br />
1.3<br />
0.4<br />
0.4<br />
0.2<br />
0.2<br />
0.2<br />
0.2<br />
0.2<br />
—<br />
0.1<br />
2,506<br />
2,307<br />
467<br />
371<br />
161<br />
113<br />
98<br />
72<br />
23<br />
20<br />
17<br />
14<br />
11<br />
11<br />
9<br />
—<br />
U<br />
40.1<br />
37.0<br />
7.5<br />
5.9<br />
2.6<br />
1.8<br />
1.6<br />
1.2<br />
0.4<br />
0.3<br />
0.3<br />
0.2<br />
0.2<br />
0.2<br />
0.1<br />
—<br />
0.2<br />
27,562<br />
25,373<br />
5,139<br />
4,080<br />
1,772<br />
1,240<br />
1,073<br />
789<br />
255<br />
223<br />
190<br />
149<br />
122<br />
118<br />
99<br />
6<br />
3<br />
163<br />
40.2<br />
37.0<br />
7.5<br />
5.9<br />
2.6<br />
1.8<br />
1.6<br />
1.1<br />
0.4<br />
0.3<br />
0.3<br />
0.2<br />
0.2<br />
0.2<br />
0.1<br />
0.0<br />
0.0<br />
0.2<br />
2,863<br />
14,083<br />
3,630<br />
2,6%<br />
3,250<br />
4,400<br />
2,750<br />
3,080<br />
2,970<br />
3,190<br />
6,130<br />
1,550<br />
2,980<br />
3,190<br />
2,970<br />
1,000<br />
1,500<br />
-<br />
Mafz cha<strong>la</strong><br />
Alfalfo<br />
Trébol + Rye grass<br />
Otros forrajes<br />
21<br />
17<br />
29<br />
3<br />
0.1<br />
0.1<br />
0.2<br />
0.0<br />
28<br />
12<br />
5<br />
_<br />
0.1<br />
0.1<br />
0.0<br />
—<br />
40<br />
40<br />
30<br />
10<br />
840<br />
680<br />
870<br />
30<br />
25<br />
20<br />
26<br />
3<br />
0.1<br />
0.1<br />
0.1<br />
0.0<br />
21<br />
6(3)<br />
3(4)<br />
—<br />
0.1<br />
0.0<br />
0.0<br />
—<br />
7<br />
4<br />
3<br />
—<br />
0.1<br />
0.1<br />
—<br />
—<br />
81<br />
42<br />
37<br />
3<br />
0.1<br />
0.1<br />
0.0<br />
0.0<br />
3,860<br />
2,470<br />
4,800<br />
1,000<br />
Total<br />
16,423<br />
100.0<br />
22,284<br />
100.0<br />
-<br />
687,090<br />
20,728<br />
100.0<br />
19,416<br />
100.0<br />
6,243<br />
100.0<br />
68,671<br />
100.0<br />
-<br />
(1) Area <strong>de</strong> cosecha anual 50% <strong>de</strong>l áreo ( 33 Ha.)<br />
(2) Area <strong>de</strong> renovaciónanual caña <strong>de</strong> azOcar 10%<br />
(3) Area <strong>de</strong> renovaciónanual alfalfa 20 %<br />
(4) Area <strong>de</strong> renovaciónTrébol + Rye grass 10%<br />
Fuente- ONERN<br />
00<br />
to
CUADRO N° 12<br />
COSTOS DIRECTOS DE PRODUCCIÓN AGRÍCOLA EN EL SUBSECTOR SANTA CRUZ<br />
( 1974 - 1975 )<br />
Z<br />
X<br />
O<br />
II.<br />
Cultivos<br />
I. Industriales<br />
Caña <strong>de</strong> azficar<br />
Café<br />
AUmenticigs<br />
Maíz<br />
Papa<br />
Camote<br />
Otros tubérculos<br />
Arveja grano seco<br />
Cebada<br />
Yuca<br />
Olluco<br />
Frijol<br />
Trigo<br />
Plátanos<br />
Area Anual <strong>de</strong><br />
Producción<br />
Ha,<br />
21<br />
1,972<br />
•<br />
14(1<br />
7<br />
1,351<br />
160<br />
132<br />
124<br />
72<br />
57<br />
40<br />
11<br />
12<br />
6<br />
7<br />
lo<br />
1-1.<br />
0.7<br />
0.4<br />
98.9<br />
67.8<br />
8.0<br />
6.6<br />
6,2<br />
3.6<br />
2,9<br />
2.0<br />
0.5<br />
0,6<br />
0.3<br />
0,4<br />
Insumes<br />
Miles <strong>de</strong><br />
s/.<br />
3<br />
3<br />
"•<br />
2,060<br />
540<br />
1,232<br />
66<br />
62<br />
86<br />
37<br />
20<br />
8<br />
4<br />
5<br />
" •<br />
«7»<br />
0,1.<br />
0.1<br />
-"<br />
99.9.<br />
26,2<br />
59,7<br />
3.2<br />
3.0<br />
4.2<br />
1.8<br />
1.0<br />
0.4<br />
0,2<br />
0,2<br />
• .<br />
Jornales<br />
por Ha.<br />
120(1)<br />
40<br />
wm<br />
40<br />
80<br />
40<br />
40<br />
30<br />
25<br />
50<br />
40<br />
20<br />
30<br />
50<br />
V<strong>la</strong>no <strong>de</strong><br />
Total<br />
Jornales<br />
1,120<br />
840<br />
280<br />
83,875<br />
54,040<br />
12,800<br />
5,280<br />
4,960<br />
2,160<br />
1,425<br />
2,000<br />
440<br />
2¿0<br />
180<br />
350<br />
Obra<br />
Miles <strong>de</strong><br />
s/.<br />
50<br />
8<br />
2.516<br />
1,621<br />
384<br />
158<br />
149<br />
65<br />
43<br />
60<br />
13<br />
7<br />
5<br />
11<br />
«70<br />
2.2<br />
1,9<br />
0.3<br />
97 t 8<br />
63.1<br />
14,9<br />
6.1<br />
5.8<br />
2.5<br />
1.7<br />
2,3<br />
0.5<br />
0.3<br />
0.2<br />
0,4<br />
Tracción<br />
vliles<strong>de</strong><br />
SA<br />
2,247<br />
"lo<br />
3 0.1<br />
3(2) 0.1<br />
»- ""*<br />
1,351<br />
400<br />
158<br />
124<br />
86<br />
57<br />
48<br />
11<br />
6<br />
6<br />
"<br />
99.9.<br />
60.1<br />
17.8<br />
7.0<br />
5.5<br />
3.8<br />
2.5<br />
2.1<br />
0,5<br />
0.3<br />
0.3<br />
"<br />
Otros Gastos<br />
Miles<br />
s/.<br />
_7_<br />
6<br />
1<br />
682<br />
351<br />
201<br />
38<br />
33<br />
24<br />
14<br />
13<br />
3<br />
2<br />
2<br />
1<br />
lo<br />
1,0.<br />
0.9<br />
0.1<br />
99.0<br />
51,0<br />
29.2<br />
5.5<br />
4.8<br />
3.5<br />
2.0<br />
1.9<br />
0.4<br />
0.3<br />
0.3<br />
0.1<br />
Costo Total<br />
Miles<br />
s/.<br />
62<br />
9<br />
7.505<br />
3,863<br />
2,217<br />
420<br />
368<br />
261<br />
151<br />
141<br />
35<br />
19<br />
18<br />
12<br />
lo<br />
0.9<br />
0.8<br />
0.1<br />
99.1<br />
51.0<br />
29.2<br />
5.5<br />
4.9<br />
3.4<br />
2,0<br />
1,9<br />
0.5<br />
0,3<br />
0,2<br />
0.2<br />
r<br />
Costo<br />
por<br />
Ha.<br />
— m '<br />
8,860<br />
1.290<br />
-,<br />
2,860<br />
13,860 |<br />
3,180<br />
2,970<br />
3,630 )<br />
2,650<br />
3 5 530<br />
3,190<br />
1,580<br />
3,000<br />
I.-'IO<br />
><br />
o<br />
z<br />
o<br />
H<br />
I—I<br />
n<br />
o<br />
><br />
o<br />
;o<br />
O<br />
m<br />
n<br />
a<br />
><br />
Total<br />
1,993<br />
lOO^O<br />
2,063<br />
100.0<br />
..<br />
84,995<br />
2,574<br />
100,0<br />
2,250<br />
100,0<br />
689<br />
100^<br />
7,576<br />
100,0<br />
I<br />
1<br />
(li , Area <strong>de</strong> cosecha 50%<br />
(2) ; Area <strong>de</strong> renovación ICrfo <strong>de</strong>l área<br />
No existe Categoría III, Pastos y Fotrajes<br />
Fuente; ONERN 1975
CUADRO N 0 13<br />
COSTOS DIRECTOS DE PRODlTCC ION AGRÍCOLA EN EL SUBSECTOR HLALGAYOC<br />
1974 - 1975<br />
A ico ICIIJV aoón 2 ho <strong>de</strong>j area i oral Area ieno\acion 10% <strong>de</strong>l aíea To r aí ONERN
CUADRO N"14<br />
COSTOS DIRECTOS DE PRODUCCIÓN AGRÍCOLA EN EL SUBSECTOR CAJAMARCA<br />
(1974-75)<br />
><br />
Z<br />
tu<br />
X<br />
O<br />
Cultivos<br />
1. Industriales<br />
II.<br />
Caña <strong>de</strong> Azúcar<br />
Otros cultivos<br />
Café<br />
Alimenticios<br />
Papa<br />
Cebada<br />
Mafz<br />
Trigo<br />
Arveja grano ver<strong>de</strong><br />
Arveja grono seco<br />
Olluco<br />
Arroz<br />
Oca<br />
Hortalizas varias<br />
Yuca<br />
Lenteja<br />
Camote<br />
Frijol<br />
Plátanos<br />
Otros frutales<br />
Haba<br />
Otros cereales<br />
Crtricos<br />
Otros tubérculos<br />
Area Anual <strong>de</strong><br />
Produce ifin<br />
Ha.<br />
839<br />
809(1)<br />
27<br />
3<br />
16,156<br />
1,431<br />
4,441<br />
3,946<br />
2,050<br />
937<br />
952<br />
678<br />
157<br />
347<br />
173<br />
248<br />
154<br />
102<br />
201<br />
141<br />
114<br />
<strong>45</strong><br />
25<br />
11<br />
3<br />
%<br />
4.8<br />
4.6<br />
0.2<br />
0.0<br />
91.6<br />
8.1<br />
25.2<br />
22.4<br />
11.6<br />
5.3<br />
5.4<br />
3.8<br />
0.9<br />
2.0<br />
1.0<br />
1.4<br />
0.9<br />
0.6<br />
1.1<br />
0.8<br />
0.6<br />
0.3<br />
0.1<br />
0.1<br />
0.0<br />
Miles S/.<br />
Insumas<br />
200<br />
200<br />
—<br />
22,083<br />
11,305<br />
2,842<br />
1,578<br />
1,640<br />
1,499<br />
1,142<br />
509<br />
628<br />
208<br />
381<br />
124<br />
62<br />
51<br />
60<br />
—<br />
—<br />
36<br />
16<br />
—<br />
2<br />
%<br />
0.9<br />
0.9<br />
~<br />
—<br />
97.8<br />
50.1<br />
12.6<br />
7.0<br />
7.3<br />
6.6<br />
5.0<br />
2.2<br />
2.8<br />
0.9<br />
1.7<br />
0.5<br />
0.3<br />
0.2<br />
0.3<br />
—<br />
—<br />
0.2<br />
0.1<br />
—<br />
0.0<br />
Jornales<br />
por Ha.<br />
..<br />
120<br />
50<br />
40<br />
-<br />
80<br />
25<br />
40<br />
30<br />
40<br />
30<br />
40<br />
100<br />
40<br />
80<br />
50<br />
30<br />
40<br />
20<br />
50<br />
40<br />
30<br />
25<br />
50<br />
40<br />
Mano <strong>de</strong> Ob ra<br />
Total<br />
Jornales<br />
49,950<br />
48,480<br />
1,350<br />
120<br />
620,800<br />
114,480<br />
111,025<br />
157,840<br />
61,500<br />
37,480<br />
28,560<br />
27,120<br />
15,700<br />
13,880<br />
13,840<br />
12,400<br />
4,620<br />
4,080<br />
4,020<br />
7,050<br />
4,560<br />
1,350<br />
625<br />
550<br />
120<br />
Miles S/.<br />
2,954<br />
2,909<br />
41<br />
4<br />
19,096<br />
3,434<br />
3,331<br />
4,735<br />
1,8<strong>45</strong><br />
1,124<br />
856<br />
814<br />
942<br />
416<br />
415<br />
372<br />
139<br />
122<br />
121<br />
212<br />
137<br />
41<br />
19<br />
17<br />
4<br />
Va or<br />
%<br />
13.1<br />
12.9<br />
0.2<br />
0.0<br />
84.4<br />
15.2<br />
14.7<br />
20.9<br />
8.2<br />
5.0<br />
3.8<br />
3.6<br />
4.2<br />
1.8<br />
1.8<br />
1.7<br />
0.6<br />
0.5<br />
0.5<br />
0.9<br />
0.6<br />
0.2<br />
0.1<br />
0.1<br />
0.0<br />
Tracción<br />
Miles S/.<br />
240<br />
240(2)<br />
—<br />
18,5<strong>03</strong><br />
3,578<br />
4,441<br />
3,946<br />
2,050<br />
1,124<br />
1,142<br />
678<br />
236<br />
347<br />
173<br />
298<br />
185<br />
122<br />
101<br />
~<br />
—<br />
54<br />
25<br />
—<br />
3<br />
%<br />
1.3<br />
1.3<br />
—<br />
-"<br />
97.6<br />
18.9<br />
23.5<br />
20.8<br />
10.8<br />
5.9<br />
6.0<br />
3.6<br />
1.3<br />
1.8<br />
0.9<br />
1.6<br />
1.0<br />
0.6<br />
0.5<br />
~<br />
—<br />
0.3<br />
0.1<br />
~<br />
0.0<br />
Otros Gastos<br />
Miles S/.<br />
339<br />
335<br />
4<br />
—<br />
5,970<br />
1,832<br />
1,061<br />
1,026<br />
554<br />
375<br />
314<br />
200<br />
181<br />
97<br />
97<br />
79<br />
39<br />
30<br />
28<br />
21<br />
14<br />
13<br />
6<br />
2<br />
1<br />
%<br />
5.3<br />
5.2<br />
0.1<br />
—<br />
93.0<br />
28.6<br />
16.5<br />
¡6.0<br />
8.6<br />
5.9<br />
4.9<br />
3.1<br />
2.8<br />
1.5<br />
1.5<br />
1.2<br />
0.6<br />
0.5<br />
0.5<br />
0.3<br />
0.2<br />
0.2<br />
0.1<br />
0.0<br />
0.0<br />
Costo Total<br />
Miles S/.<br />
3,733<br />
3,684<br />
<strong>45</strong><br />
4<br />
65,652<br />
20,149<br />
11,675<br />
11,285<br />
6,089<br />
4,122<br />
3,<strong>45</strong>4<br />
2,201<br />
1,987<br />
1,068<br />
1,066<br />
873<br />
425<br />
325<br />
310<br />
233<br />
151<br />
144<br />
66<br />
19<br />
10<br />
%<br />
5.3<br />
5.2<br />
0.1<br />
0.0<br />
93.0<br />
28.6<br />
16.6<br />
16.0<br />
8.6<br />
5.9<br />
4.9<br />
3.1<br />
2.8<br />
1.5<br />
1.5<br />
1.2<br />
0.6<br />
0.5<br />
0.4<br />
0.3<br />
0.2<br />
0.2<br />
0.1<br />
0.0<br />
0.0<br />
Costo por<br />
Ha.<br />
S/.<br />
4,550<br />
1,670<br />
1,330<br />
-<br />
14,080<br />
2,630<br />
2,860<br />
2,970<br />
4,400<br />
3,630<br />
3,250<br />
12,660<br />
3,080<br />
6,160<br />
3,520<br />
2,760<br />
3,190<br />
1,540<br />
1,650<br />
1,320<br />
3,200<br />
2,640<br />
1,730<br />
3,330<br />
><br />
O<br />
2<br />
O<br />
en<br />
H<br />
I—I<br />
O<br />
O<br />
><br />
o<br />
po<br />
O<br />
"O<br />
tu<br />
O<br />
c<br />
><br />
50<br />
¡II.<br />
Pastos y Forrajes<br />
621<br />
3.6<br />
299<br />
1.3<br />
-<br />
19,020<br />
570<br />
2.5<br />
189<br />
1.1<br />
107<br />
1.7<br />
1,165<br />
1.7<br />
-<br />
Alfalfa<br />
MaTz cha<strong>la</strong><br />
Trébol + Rye Grass<br />
Otros forrajes<br />
Total<br />
242<br />
105<br />
120<br />
154<br />
17,616<br />
1.4<br />
0.6<br />
0.7<br />
0.9<br />
100.0<br />
144<br />
137<br />
18<br />
—<br />
22,582<br />
0.6<br />
0.6<br />
0.1<br />
—<br />
100.0<br />
40<br />
40<br />
30<br />
10<br />
~<br />
9,680<br />
4,200<br />
3,600<br />
1,540<br />
689,770<br />
290<br />
126<br />
108<br />
46<br />
22,620<br />
1.3<br />
0.6<br />
0.5<br />
—<br />
100.0<br />
72(3)<br />
105<br />
12(4)<br />
—<br />
18,932<br />
0.4<br />
0.6<br />
0.1<br />
~<br />
100.0<br />
51<br />
37<br />
14<br />
5<br />
6,416<br />
0.8<br />
0.6<br />
0.2<br />
0.1<br />
100.0<br />
557<br />
405<br />
152<br />
51<br />
70,550<br />
0.8<br />
0.6<br />
0.2<br />
0.1<br />
100.0<br />
2,300<br />
3,860<br />
1,270<br />
330<br />
-<br />
(1) Area <strong>de</strong> cosecha anual 50% <strong>de</strong>l firea (404 Ha.)<br />
(2) Area <strong>de</strong> renovaciones 10% <strong>de</strong>l firea total<br />
(3) Area <strong>de</strong> renovaciones 20% <strong>de</strong>l firea total<br />
(4) Area <strong>de</strong> renovaciones 10% <strong>de</strong>l firea total<br />
Fuente: ONERN, 1975.<br />
"O<br />
(a<br />
00<br />
to<br />
to
CUADRO N 0 15<br />
COSTOS DIRECTOS DE PRODUCCIÓN AGRICOLA EN EL SUB-SECTOR SAN MIGUEL<br />
( 1974- 1975)<br />
s<br />
o<br />
Cul Mvos<br />
Area Anual <strong>de</strong><br />
Producción<br />
Ha.<br />
%<br />
Miles <strong>de</strong> y.<br />
1 nsumos<br />
%<br />
Jornales<br />
por Ha.<br />
Mano <strong>de</strong><br />
Total<br />
Jómales<br />
Obra<br />
Miles <strong>de</strong> S/.<br />
%<br />
Tracción<br />
Miles <strong>de</strong> S/.<br />
%<br />
Otros Gastos<br />
Miles <strong>de</strong> S/.<br />
%<br />
Costo Total<br />
Miles <strong>de</strong> S/.<br />
%<br />
Costo por<br />
Ha.<br />
1. Industriales<br />
II.<br />
Café<br />
Otros cultivos<br />
Alimenticios<br />
K><br />
7<br />
3<br />
9,667<br />
0.1<br />
0.1<br />
0.0<br />
86.4<br />
j^<br />
,-<br />
—<br />
16,433<br />
^<br />
—<br />
~<br />
99.3<br />
~<br />
40<br />
50<br />
~<br />
430<br />
280<br />
150<br />
396,990<br />
_13<br />
8<br />
5<br />
11,911<br />
0.0<br />
0.0<br />
0.0<br />
92.4<br />
—<br />
—<br />
11,411<br />
~<br />
—<br />
98.9<br />
_2<br />
1<br />
1<br />
3,974<br />
CU)<br />
0.0<br />
0.0<br />
97.1<br />
J5_<br />
9<br />
6<br />
43,729<br />
M<br />
0.0<br />
0.0<br />
97.0<br />
~<br />
1,290<br />
2,000<br />
~<br />
Papa<br />
Maíz<br />
Cebada<br />
Arveja grano seco<br />
Arveja grano ver<strong>de</strong><br />
Trigo<br />
Arroz<br />
Olluco<br />
Oca<br />
Yuca<br />
Hortalizas varias<br />
Camote<br />
Otros cereales<br />
Haba<br />
Frijol<br />
Plátanos<br />
Cftricos<br />
Otros frutales<br />
III. Pastas y Forrajes<br />
Trébol + Rye grass<br />
Otros forrajes<br />
Alfalfa<br />
Maíz cha<strong>la</strong><br />
Total<br />
1,243<br />
2,515<br />
2,351<br />
1,054<br />
101<br />
1,074<br />
275<br />
304<br />
155<br />
128<br />
69<br />
106<br />
75<br />
57<br />
106<br />
24<br />
17<br />
13<br />
1,469<br />
655<br />
691<br />
132<br />
18<br />
11,173<br />
(1) Area <strong>de</strong> renovación 10% <strong>de</strong>l área total<br />
(2) Area <strong>de</strong> renovación 20% <strong>de</strong>l área total<br />
Costo por jornal S/. 30.00<br />
Fuente: ONERN, 1975.<br />
11.1<br />
22.5<br />
21.0<br />
9.4<br />
0.9<br />
9.6<br />
2.5<br />
2.7<br />
1.4<br />
1.2<br />
0.6<br />
0.9<br />
0.7<br />
0.5<br />
0.9<br />
0.2<br />
0.2<br />
0.1<br />
13.5<br />
5.9<br />
6.2<br />
1.2<br />
0.2<br />
100.0<br />
9,820<br />
1,006<br />
1,505<br />
1,265<br />
161<br />
859<br />
1,101<br />
228<br />
93<br />
64<br />
152<br />
53<br />
48<br />
46<br />
32<br />
—<br />
JI25<br />
99<br />
— 3<br />
23<br />
16,558<br />
59.3<br />
6.1<br />
9.1<br />
7.6<br />
1.0<br />
5.2<br />
6.6<br />
1.4<br />
0.6<br />
0.4<br />
0.9<br />
0.3<br />
0.3<br />
0.3<br />
0.2<br />
—<br />
~<br />
0.7<br />
0.6<br />
~<br />
0.0<br />
0.1<br />
100.0<br />
80<br />
40<br />
25<br />
30<br />
40<br />
30<br />
100<br />
40<br />
40<br />
50<br />
80<br />
40<br />
25<br />
30<br />
20<br />
50<br />
50<br />
40<br />
-<br />
30<br />
10<br />
40<br />
40<br />
~<br />
99,440<br />
100,600<br />
58,775<br />
31,620<br />
4,040<br />
32,220<br />
27,500<br />
12,160<br />
6,200<br />
6,400<br />
5,520<br />
4,240<br />
1,875<br />
1,710<br />
2,120<br />
1,200<br />
850<br />
520<br />
32,560<br />
19,650<br />
6,910<br />
5,280<br />
720<br />
429,980<br />
2,983<br />
3,018<br />
1,763<br />
949<br />
121<br />
967<br />
825<br />
365<br />
186<br />
192<br />
166<br />
127<br />
56<br />
51<br />
64<br />
36<br />
26<br />
16<br />
977<br />
590<br />
207<br />
158<br />
22<br />
12,901<br />
23.1<br />
23.4<br />
13.7<br />
7.4<br />
0.9<br />
7.5<br />
6.4<br />
2.8<br />
1.4<br />
1.5<br />
1.3<br />
1.0<br />
0.4<br />
0.4<br />
0.5<br />
0.3<br />
0.3<br />
0.1<br />
IA<br />
4.6<br />
1.6<br />
1.2<br />
0.2<br />
100.0<br />
3,108<br />
2,515<br />
2,351<br />
1,054<br />
29<br />
1,074<br />
275<br />
304<br />
155<br />
154<br />
69<br />
127<br />
75<br />
68<br />
53<br />
—<br />
~<br />
124<br />
11,535<br />
66(1)<br />
—<br />
40(2)<br />
18<br />
26.9<br />
21.8<br />
20.4<br />
9.1<br />
0.3<br />
9.3<br />
2.4<br />
2.6<br />
1.3<br />
1.3<br />
0.6<br />
1.1<br />
0.7<br />
0.6<br />
0.5<br />
~<br />
—<br />
~<br />
id'<br />
0.6<br />
—<br />
0.3<br />
0.2<br />
100.0<br />
1,591<br />
653<br />
561<br />
326<br />
31<br />
290<br />
220<br />
89<br />
43<br />
41<br />
39<br />
31<br />
18<br />
17<br />
15<br />
4<br />
3<br />
2<br />
^23<br />
76<br />
21<br />
20<br />
6<br />
4,099<br />
38.8<br />
15.9<br />
13.7<br />
8.0<br />
0.8<br />
7.1<br />
5.4<br />
2.2<br />
1.0<br />
1.0<br />
1.0<br />
0.8<br />
0.4<br />
0.4<br />
0.4<br />
0.1<br />
0.1<br />
0.0<br />
2.9<br />
1.8<br />
0.5<br />
0.5<br />
0.1<br />
100.0<br />
17,502<br />
7,192<br />
6,180<br />
3,594<br />
342<br />
3,190<br />
2,421<br />
986<br />
477<br />
<strong>45</strong>1<br />
426<br />
338<br />
197<br />
182<br />
164<br />
40<br />
29<br />
18<br />
1,349<br />
831<br />
228<br />
221<br />
69<br />
<strong>45</strong>,093<br />
38.8<br />
15.9<br />
13.7<br />
8.0<br />
0.8<br />
7.1<br />
5.4<br />
2.2<br />
1.1<br />
1.0<br />
0.9<br />
0.7<br />
0.4<br />
0.4<br />
0.4<br />
0.1<br />
0.1<br />
0.0<br />
3.0<br />
1.8<br />
0.5<br />
0.5<br />
0.2<br />
100.0<br />
14,080<br />
2,860<br />
2,630<br />
3,410<br />
3,390<br />
2,970<br />
8,800<br />
3,240<br />
3,080<br />
3,520<br />
6,170<br />
3,190<br />
2,630<br />
3,190<br />
1,550<br />
1,670<br />
1,710<br />
1,380<br />
~<br />
1,270<br />
330<br />
1,670<br />
3,830<br />
-<br />
N<br />
O<br />
Z<br />
><br />
o<br />
w<br />
a<br />
M<br />
o<br />
><br />
«—i<br />
><br />
><br />
o<br />
>
CUADRO N" 16<br />
COSTOS DIRECTOS DE PRODUCCIÓN AGRÍCOLA EN EL SUBSECTORCONTUMAZA<br />
( 1974- 1975)<br />
><br />
z<br />
Pl<br />
X<br />
o<br />
Cultivos<br />
1. Industriales<br />
II.<br />
Cana <strong>de</strong> azúcar<br />
Otros cultivos<br />
Alimenticios<br />
Trigo<br />
Papa<br />
Arroz<br />
Maíz<br />
Cebada<br />
Arveja grano seco<br />
Arveia grano ver<strong>de</strong><br />
Yuca<br />
Camota<br />
Lenteja<br />
Frijol<br />
Oca<br />
Olluco<br />
Haba<br />
Plátanos<br />
Otros frutales<br />
Hortalizas varios<br />
Crtriccs<br />
Otros cereales<br />
III. Pastos y Forrajes<br />
Area Anual <strong>de</strong><br />
Producción<br />
Ha.<br />
121<br />
114(1)<br />
7<br />
3,876<br />
1,341<br />
216<br />
309<br />
837<br />
538<br />
232<br />
22<br />
93<br />
64<br />
47<br />
67<br />
23<br />
24<br />
19<br />
18<br />
20<br />
2<br />
3<br />
1<br />
_132<br />
%<br />
3.0<br />
2.8<br />
0.2<br />
93.8<br />
32.5<br />
5.2<br />
7.5<br />
20.3<br />
13.0<br />
5.6<br />
0.5<br />
2.2<br />
1.6<br />
1.1<br />
1.6<br />
0.6<br />
0.6<br />
0.5<br />
0.4<br />
0.5<br />
0.0<br />
0.0<br />
0.0<br />
hl<br />
Miles S/.<br />
US<br />
143<br />
—<br />
5,177<br />
1,073<br />
1,706<br />
1,236<br />
335<br />
344<br />
278<br />
35<br />
47<br />
32<br />
19<br />
20<br />
14<br />
18<br />
15<br />
—<br />
4<br />
—<br />
1<br />
65<br />
Insumas<br />
%<br />
M<br />
2.6<br />
—<br />
96.2<br />
19.9<br />
31.7<br />
23.0<br />
6.2<br />
6.4<br />
5.2<br />
0.6<br />
0.9<br />
0.6<br />
0.3<br />
0.4<br />
0.3<br />
0.3<br />
0.3<br />
—<br />
0.1<br />
—<br />
0.0<br />
K2<br />
Jornales<br />
por Ha.<br />
-<br />
120<br />
50<br />
""<br />
30<br />
80<br />
100<br />
40<br />
25<br />
30<br />
40<br />
50<br />
40<br />
30<br />
20<br />
40<br />
40<br />
30<br />
50<br />
40<br />
80<br />
50<br />
25<br />
-<br />
Mano<br />
Total<br />
Jómales<br />
7,190<br />
6,Í40<br />
350<br />
157,625<br />
40,230<br />
17,280<br />
30,900<br />
33,480<br />
13,<strong>45</strong>0<br />
6,960<br />
880<br />
4,650<br />
2,560<br />
1,410<br />
1,340<br />
920<br />
960<br />
570<br />
900<br />
800<br />
160<br />
150<br />
25<br />
4,520<br />
<strong>de</strong> Obra<br />
Miles S/.<br />
421<br />
410<br />
11<br />
4,730<br />
1,207<br />
518<br />
927<br />
1,004<br />
404<br />
209<br />
26<br />
140<br />
77<br />
42<br />
40<br />
28<br />
29<br />
17<br />
27<br />
24<br />
5<br />
5<br />
1<br />
_135<br />
%<br />
BJ)<br />
7.8<br />
0.2<br />
89.5<br />
22.8<br />
9.8<br />
17.5<br />
19.0<br />
7.7<br />
4.0<br />
0.5<br />
2.6<br />
1.5<br />
0.8<br />
0.8<br />
0.5<br />
0.5<br />
0.3<br />
0.5<br />
0.5<br />
0.1<br />
0.1<br />
0.0<br />
2.5<br />
Miles $/.<br />
171<br />
Tracción<br />
171(2)<br />
—<br />
4,376<br />
1,341<br />
540<br />
464<br />
837<br />
538<br />
278<br />
26<br />
112<br />
77<br />
56<br />
34<br />
23<br />
24<br />
23<br />
—<br />
2<br />
—<br />
1<br />
39<br />
%<br />
hl<br />
3.7<br />
—<br />
95.4<br />
29.2<br />
11.8<br />
10.1<br />
18.3<br />
11.7<br />
6.1<br />
0.6<br />
2.4<br />
1.7<br />
1.2<br />
0.7<br />
0.5<br />
0.5<br />
0.5<br />
—<br />
0.0<br />
—<br />
0.0<br />
2d<br />
Otros Gastos<br />
Miles 5/.<br />
_73<br />
72<br />
1<br />
1,430<br />
362<br />
276<br />
263<br />
217<br />
129<br />
77<br />
9<br />
30<br />
19<br />
12<br />
9<br />
7<br />
7<br />
6<br />
3<br />
2<br />
1<br />
1<br />
—<br />
25<br />
%<br />
íl?<br />
4.7<br />
0.1<br />
93.5<br />
23.7<br />
18.1<br />
17.2<br />
14.2<br />
8.4<br />
5.0<br />
0.6<br />
2.0<br />
1.2<br />
0.8<br />
0.6<br />
0.5<br />
0.5<br />
0.4<br />
0.2<br />
0.1<br />
0.0<br />
0.0<br />
—<br />
hi<br />
Casto Total<br />
Miles S/.<br />
8OT<br />
796<br />
12<br />
15,713<br />
3,983<br />
3,040<br />
2,890<br />
2,393<br />
1,415<br />
842<br />
96<br />
329<br />
205<br />
129<br />
1<strong>03</strong><br />
72<br />
78<br />
61<br />
30<br />
26<br />
12<br />
6<br />
3<br />
264<br />
%<br />
4.8<br />
4.7<br />
0.1<br />
93.7<br />
23.7<br />
18.1<br />
17.2<br />
14.3<br />
8.4<br />
5.0<br />
0.6<br />
2.0<br />
1.2<br />
0.8<br />
0.6<br />
0.4<br />
0.5<br />
0.4<br />
0.2<br />
0.2<br />
0.1<br />
0.0<br />
0.0<br />
1.5<br />
Costo por<br />
Ha.<br />
~<br />
6,980<br />
1,710<br />
~<br />
2,970<br />
14,070<br />
9,350<br />
2,860<br />
2,610<br />
3,630<br />
4,360<br />
3,540<br />
3,200<br />
2,740<br />
1,540<br />
3,610<br />
3,250<br />
3,210<br />
1,670<br />
1,300<br />
6,000<br />
2,000<br />
3,000<br />
~<br />
><br />
o<br />
z<br />
o<br />
C/l<br />
H<br />
I—I<br />
O<br />
o<br />
><br />
O<br />
•a<br />
M<br />
n<br />
><br />
Alfalfa<br />
Otros forrajes<br />
Trébol + Rye grass<br />
Maíz cha<strong>la</strong><br />
100<br />
23<br />
7<br />
2<br />
2.4<br />
0.6<br />
0.2<br />
0,0<br />
60<br />
—<br />
2<br />
3<br />
1.1<br />
—<br />
0.0<br />
0.1<br />
40<br />
10<br />
30<br />
40<br />
4,000<br />
230<br />
210<br />
80<br />
120<br />
7<br />
6<br />
2<br />
2.3<br />
0.1<br />
0.1<br />
0.0<br />
30(3)<br />
—<br />
7(4)<br />
2<br />
0.7<br />
—<br />
0.2<br />
0.0<br />
21<br />
1<br />
2<br />
1<br />
1.4<br />
0.1<br />
0.1<br />
0.1<br />
231<br />
8<br />
17<br />
8<br />
1.4<br />
0.0<br />
0.1<br />
0.0<br />
1,250<br />
350<br />
1,570<br />
4,000<br />
Total<br />
4,129<br />
100.0<br />
5,385<br />
100.0<br />
-<br />
169,335<br />
5,286<br />
100.0<br />
4,586<br />
100.0<br />
1,528<br />
100.0<br />
16,785<br />
100.0<br />
-<br />
(1) 50% área <strong>de</strong> cosecha anual ( 57 Ha,)<br />
(2) 10% área <strong>de</strong> renovación<br />
(3) 20% área <strong>de</strong> renovación<br />
(4) 10% área <strong>de</strong> renovación<br />
Fuente: ONERN, 1975<br />
OQ<br />
W
CUADRO N 0 17<br />
00<br />
DEMANDA DE MANO DE OBRA POR CULTIVO<br />
to<br />
1975-<br />
Cultivos 1<br />
Has.<br />
D emanda<br />
Mensual<br />
<strong>de</strong><br />
Jorna1 es<br />
por<br />
Cultivo<br />
Total<br />
Enero<br />
Febrero |<br />
Marzo<br />
Abril<br />
Mayo 1<br />
Junio<br />
Julio<br />
Agosto<br />
Setiembre j Octubre<br />
Noviembre<br />
Diciembre<br />
Caña <strong>de</strong> azúcar<br />
Café<br />
Otros cultivos industriales<br />
Frijol<br />
Arveja grano seco<br />
Haba<br />
Lenteja<br />
Maíz<br />
Arroz<br />
Cebada<br />
Trigo<br />
Otros cereales<br />
1 Hortalizas varias<br />
Arveja grano ver<strong>de</strong><br />
Papa<br />
01 luco<br />
Camote<br />
Yuca<br />
Oca<br />
Otras tuberosas<br />
Plátano<br />
Cftricos<br />
Otros frutales<br />
Alfalfa<br />
Trébol Rye grass<br />
Maíz cha<strong>la</strong><br />
Otros forrajes<br />
1 Total<br />
Días <strong>de</strong> Trabajo por Horn<br />
bre al Mes.<br />
Número <strong>de</strong> Hombres <strong>de</strong>man<br />
1 dados por Mes<br />
1,397*<br />
251<br />
42<br />
882<br />
5,776<br />
402<br />
779<br />
33,399<br />
743<br />
2,662<br />
4,7<strong>03</strong><br />
118<br />
368<br />
1,7<strong>45</strong><br />
8,575<br />
2,469<br />
824<br />
783<br />
1,995<br />
714<br />
255<br />
60<br />
147<br />
566<br />
1,196<br />
183<br />
3,483<br />
84,517<br />
5,508<br />
1,255<br />
336<br />
1,908<br />
41,592<br />
—<br />
—<br />
__<br />
1,558<br />
—<br />
~<br />
290<br />
1,760<br />
—<br />
—<br />
29,502<br />
~<br />
12,312<br />
23,088<br />
~<br />
255<br />
60<br />
147<br />
1,132<br />
2,392<br />
2,840<br />
3,483<br />
129,418<br />
25<br />
5,200<br />
„<br />
—<br />
~<br />
3,384<br />
__<br />
3,850<br />
8,724<br />
324,144<br />
13,482<br />
—<br />
40,960<br />
—<br />
1,760<br />
~<br />
91,875<br />
—<br />
5,410<br />
1,188<br />
710<br />
120<br />
255<br />
60<br />
147<br />
9,056<br />
9,568<br />
—<br />
—<br />
514,693<br />
24<br />
21,500<br />
18,550<br />
—<br />
336<br />
—<br />
62,388<br />
«_<br />
—<br />
—<br />
1,468<br />
115,000<br />
—<br />
890<br />
2,112<br />
11,728<br />
—<br />
24,060<br />
—<br />
—<br />
19,240<br />
—<br />
2,805<br />
660<br />
1,617<br />
1,132<br />
2,392<br />
1,420<br />
3,483<br />
269,281<br />
25<br />
10,800<br />
(*) : Sólo se consi<strong>de</strong>ra un área anual <strong>de</strong> producción <strong>de</strong> 698 Ha.<br />
Fuente : ONERN<br />
956<br />
3,765<br />
—<br />
~<br />
—<br />
—<br />
—<br />
227,808<br />
7,340<br />
—<br />
--<br />
—<br />
8,928<br />
2,932<br />
147,000<br />
—<br />
—<br />
—<br />
—<br />
2,805<br />
660<br />
1,176<br />
1,132<br />
2,392<br />
—<br />
3,483<br />
410,377<br />
25<br />
16,400<br />
4,063<br />
—<br />
-588<br />
3,384<br />
51,990<br />
136<br />
—<br />
--<br />
7,358<br />
5,810<br />
40,960<br />
—<br />
—<br />
20,524<br />
24,500<br />
24,060<br />
7,574<br />
5,346<br />
19,240<br />
7,1B8<br />
«<br />
—<br />
—<br />
1,132<br />
2,392<br />
1,420<br />
3,483<br />
231,148<br />
25<br />
9,200<br />
4,063<br />
—<br />
—<br />
~<br />
4,616<br />
—<br />
7,686<br />
—<br />
22,020<br />
115,000<br />
—<br />
890<br />
1,920<br />
~<br />
34,300<br />
—<br />
~<br />
—<br />
—<br />
~<br />
—<br />
~<br />
—<br />
1,132<br />
2,392<br />
—<br />
3,483<br />
197,502<br />
25<br />
7,900<br />
14,438<br />
—<br />
—<br />
__<br />
—<br />
204<br />
—<br />
—<br />
216<br />
—<br />
6,070<br />
1<strong>45</strong><br />
1,920<br />
25,688<br />
41,650<br />
504<br />
4,528<br />
7,776<br />
— 72<br />
—<br />
~<br />
—<br />
5,660<br />
9,568<br />
—<br />
3,483<br />
121,922<br />
25<br />
4,900<br />
956<br />
3,765<br />
—<br />
2,544<br />
6,924<br />
—<br />
624<br />
59,076<br />
18<br />
11,620<br />
—<br />
—<br />
2,304<br />
558<br />
~<br />
—<br />
~<br />
—<br />
568<br />
9,828<br />
3,315<br />
780<br />
1,176<br />
1,132<br />
2,392<br />
820<br />
3,483<br />
111,883<br />
25<br />
4,500<br />
13,042<br />
—<br />
504<br />
—<br />
—<br />
170<br />
—<br />
--<br />
1,486<br />
—<br />
6,070<br />
—<br />
3,<strong>45</strong>6<br />
3,906<br />
36,750<br />
756<br />
2,830<br />
5,832<br />
—<br />
120<br />
255<br />
60<br />
147<br />
1,132<br />
2,392<br />
—<br />
3,483<br />
82,39í<br />
25<br />
3,300<br />
956<br />
~<br />
—<br />
1,908<br />
5,770<br />
3,080<br />
—<br />
390,942<br />
162<br />
—<br />
—<br />
290<br />
—<br />
—<br />
61,250<br />
—<br />
—<br />
1,944<br />
852<br />
4,212<br />
255<br />
60<br />
147<br />
—<br />
—<br />
410<br />
3,483<br />
475,721<br />
25<br />
19,000<br />
9,753<br />
1,255<br />
336<br />
—<br />
—<br />
—<br />
—<br />
—<br />
17,634<br />
11,620<br />
..<br />
—<br />
5,280<br />
4,464<br />
144,550<br />
19,878<br />
--<br />
4,752<br />
15,392<br />
—<br />
255<br />
60<br />
147<br />
~<br />
~<br />
—<br />
3,483<br />
238,859<br />
25<br />
9,600<br />
11,475<br />
~<br />
—<br />
4,512<br />
—<br />
4,620<br />
6,336<br />
333,990<br />
1,558<br />
57,500<br />
47,<strong>03</strong>0<br />
4<strong>45</strong><br />
—<br />
~<br />
104,125<br />
—<br />
12,618<br />
--<br />
710<br />
7,020<br />
2,550<br />
600<br />
1,176<br />
—<br />
~<br />
410<br />
—<br />
596,675<br />
25<br />
23,900<br />
83,760<br />
10,040<br />
2,100<br />
17,640<br />
173,280<br />
12,060<br />
23,370<br />
1'335,960<br />
74,300<br />
316,550<br />
141,090<br />
2,950 1<br />
29,440<br />
69,800<br />
686,000<br />
?8,7ó0<br />
32,960<br />
39,150<br />
79,800<br />
28,560<br />
12,750<br />
3,000<br />
5,880<br />
22,640<br />
35,880<br />
7,320<br />
34,830<br />
3 , 379,870 1<br />
—<br />
~<br />
N<br />
O<br />
z<br />
><br />
z<br />
o<br />
7a<br />
H<br />
tn<br />
a<br />
O<br />
><br />
><br />
><br />
O<br />
>
ANEXO VI "DIAGNOSTICO AGROPECUARIO IMU, 133<br />
. CUADRO N 0 18<br />
UTILIDADES ESTIMADAS POR CULTIVOS jiN IlL.SmiSECTCMlCUTI-RVO<br />
( 1974 - 1975 )<br />
Cultivos<br />
Area Anual <strong>de</strong><br />
Producción<br />
Ha.<br />
lo<br />
Ingreso Bruto<br />
Miles <strong>de</strong><br />
s/.<br />
lo<br />
Costos Directos<br />
Miles <strong>de</strong><br />
s/.<br />
Pág. 134<br />
ZONA<br />
NORTE DE CAJA MA RCA<br />
CUADRO N° 19<br />
UTILIDADES ESTIMADAS POR CULTIVOS EN EL SUBSECTOR CHOTA<br />
( 1974 ' 1975 )<br />
Cultivos<br />
Area Anual <strong>de</strong><br />
Producción<br />
Ha.<br />
°¡o<br />
Ingreso Bruto<br />
Miles <strong>de</strong><br />
s/.<br />
lo<br />
Costos Directos<br />
Miles <strong>de</strong><br />
s/.<br />
%<br />
Utilida<strong>de</strong>s<br />
Miles <strong>de</strong><br />
SA<br />
lo<br />
Utilidad<br />
por<br />
Ha.<br />
s/.<br />
I, Industriales<br />
73<br />
0.4<br />
873<br />
0.8<br />
315<br />
0,4<br />
558*<br />
1.7<br />
•-<br />
Caña <strong>de</strong> azúcar<br />
Café<br />
Otros cultivos<br />
66<br />
5<br />
2<br />
0,4<br />
0,0<br />
0,0<br />
825<br />
30<br />
18<br />
0.8<br />
0,0<br />
0.0<br />
305<br />
7<br />
3<br />
0,4<br />
0.0<br />
0.0<br />
520<br />
23<br />
15<br />
1.6<br />
0.1<br />
0.0<br />
15,760<br />
4,600<br />
7,500<br />
II.<br />
Alimenticios<br />
16,280<br />
99,2<br />
100,780<br />
98,9<br />
68,193<br />
99.4<br />
32,587<br />
97,5<br />
--<br />
Papa<br />
Mafz<br />
Arveja grano seco<br />
Cebada<br />
Arv e ja grano ver<strong>de</strong><br />
OIluco<br />
Lenteja<br />
Oca<br />
Camote<br />
Fríjol<br />
Trigo<br />
Yuca<br />
Hortalizas varias<br />
Haba<br />
Otros tubérculos<br />
Cítricos<br />
Plátanos<br />
1,802<br />
9,637<br />
1.416<br />
1,55'2<br />
282<br />
546<br />
390<br />
256<br />
70<br />
96<br />
86<br />
30<br />
31<br />
37<br />
41<br />
6<br />
2<br />
11,0<br />
58.7<br />
8.6<br />
9.5<br />
1,7<br />
3,3<br />
2.4<br />
1.6<br />
0.4<br />
0.6<br />
0.5<br />
0.2<br />
0,2<br />
0.2<br />
0.3<br />
0,0<br />
0,0<br />
37,835<br />
38,548<br />
8,496<br />
6.208<br />
2.200<br />
2,730<br />
1,950<br />
1,024<br />
368<br />
288<br />
344<br />
158<br />
248<br />
167<br />
164<br />
36<br />
16<br />
37.1<br />
37,8<br />
8.3<br />
6.1<br />
2.2<br />
2.7<br />
1.9<br />
1.0<br />
0.4<br />
0.3<br />
0.3<br />
0.2<br />
0.2<br />
0.2<br />
0,2<br />
0.0<br />
0.0<br />
25.373<br />
27,562<br />
5,139<br />
4,080<br />
1,240<br />
1,772<br />
1,073<br />
789<br />
223<br />
149<br />
255<br />
99<br />
190<br />
118<br />
122<br />
6<br />
3<br />
37,0<br />
40.2<br />
7.5<br />
5.9<br />
1.8<br />
2,6<br />
1.6<br />
1.1<br />
0.3<br />
0.2<br />
0.4<br />
0.1<br />
0.3<br />
0,2<br />
0.2<br />
0,0<br />
0,0<br />
12,462<br />
10,986<br />
3,357<br />
2,128<br />
960<br />
958<br />
877<br />
235<br />
1<strong>45</strong><br />
139<br />
89<br />
59<br />
58<br />
49<br />
42<br />
30<br />
13<br />
37.3<br />
32,9<br />
10,0<br />
6.4<br />
2.9<br />
2.9<br />
2.6<br />
0,7<br />
0,4<br />
0,4<br />
0.3<br />
0.2<br />
0.2<br />
0.1<br />
0,1<br />
0,1<br />
0,0<br />
6,920<br />
1.140<br />
2,370<br />
1.370<br />
3,400<br />
1.750<br />
2,250<br />
920<br />
310<br />
1,<strong>45</strong>0<br />
1,<strong>03</strong>0<br />
1,970<br />
1,870<br />
1.320<br />
1,020<br />
5.000<br />
6,500<br />
III.<br />
Pastos y Forrajes<br />
70<br />
0,4<br />
441<br />
0,3<br />
163<br />
0.2<br />
278<br />
0,8<br />
-.,<br />
Trébol -3- Rye grass<br />
Alfalfa<br />
Mafz cha<strong>la</strong><br />
Otros forrajes<br />
29<br />
17<br />
21<br />
3<br />
0*2<br />
0,1<br />
0,1<br />
0,0<br />
139<br />
143<br />
151<br />
88<br />
0,1<br />
0,1<br />
0,1<br />
0,0<br />
37<br />
42<br />
81<br />
3<br />
0.0<br />
0,1<br />
0.1<br />
0,0<br />
102<br />
101<br />
70<br />
5<br />
0.3<br />
0,3<br />
0,2<br />
0.0<br />
3,520<br />
5.. 940<br />
3 S 330<br />
1,660<br />
T otal<br />
16, ,423<br />
100.0<br />
102„094<br />
100,0<br />
68,671<br />
100,0<br />
33,,423<br />
100.0<br />
--<br />
(*) : 5CPjo <strong>de</strong>l área total<br />
Fuente: ONERN.
ANEXO VI-DIAGNOS TICO AGROPECUARIO Pág. 13.><br />
CUADRO N o 20<br />
UTILIDADES ESTIMADAS POR CULTIVOS EN EL SUBSECTOR SANTA CRUZ<br />
( 1974 - 1975 )<br />
Cultivos<br />
Area Anual <strong>de</strong><br />
Producción<br />
Ha, ojo<br />
Ingreso Bruto<br />
Miles <strong>de</strong><br />
s/.<br />
%<br />
Cestos Dlfettos<br />
Miles <strong>de</strong><br />
s/.<br />
lo<br />
Utilida<strong>de</strong>s<br />
Miles <strong>de</strong><br />
ojo<br />
S/.<br />
Utilidad<br />
por<br />
Ha a<br />
5/<br />
1. Industriales<br />
21<br />
1,1<br />
217<br />
2,0<br />
71<br />
0,9<br />
146<br />
4.8<br />
—<br />
Caña <strong>de</strong> azúcar<br />
Café<br />
14<br />
7<br />
0,7<br />
0,4<br />
175<br />
42<br />
1,6 62<br />
0.4 9<br />
0,8<br />
0,1<br />
113*<br />
33<br />
' 3.7<br />
1.1<br />
16,140<br />
4,710<br />
II. Alimenticios<br />
1,972<br />
98,9<br />
10,434<br />
98,0 7,505<br />
99,1<br />
2,929<br />
95.2<br />
—<br />
Maiz<br />
Papa<br />
Camote<br />
Arveja grano seco<br />
Otros tubérculos<br />
Cebada<br />
Yuca<br />
Plátanos<br />
Olluco<br />
Frijol<br />
Trigo<br />
1,351<br />
160<br />
132<br />
72<br />
124<br />
57<br />
40<br />
7<br />
11<br />
12<br />
6<br />
67,8<br />
8,0<br />
6,6<br />
3,6<br />
6,2<br />
2,9<br />
2,0<br />
0,4<br />
0,5<br />
0,6<br />
0,3<br />
5,404<br />
2,800<br />
693<br />
432<br />
496<br />
228<br />
210<br />
56<br />
55<br />
36<br />
24<br />
50,8<br />
26,3<br />
6,5<br />
4,1<br />
4,7<br />
2,1<br />
2,0<br />
0,5<br />
0.5<br />
0,3<br />
0,2<br />
3,863<br />
2,217<br />
420<br />
261<br />
368<br />
151<br />
141<br />
12<br />
35<br />
19<br />
18<br />
51,0<br />
29,2<br />
5,5<br />
3,4<br />
4,9<br />
2,0<br />
1,9<br />
0,2<br />
0,5<br />
0,3<br />
0,2<br />
1,541<br />
583<br />
273<br />
171<br />
128<br />
77<br />
69<br />
44<br />
20<br />
17<br />
6<br />
50.0<br />
19.0<br />
8,8<br />
5.6<br />
4.2<br />
2.5<br />
2.2<br />
1.4<br />
0.7<br />
0.6<br />
0.2<br />
1,140<br />
3,640<br />
2,070<br />
2,380<br />
1,<strong>03</strong>0<br />
1,350<br />
1,730<br />
6,290<br />
1,820<br />
1,420<br />
1,000<br />
Total<br />
1,993<br />
100,0 10,651 100,0 7,576<br />
100,0<br />
3,075<br />
100.0<br />
—<br />
Nota: No existe categoría III Pastos y Forrajes,<br />
(•) 50% <strong>de</strong>l área total.<br />
Fuente: ONERN, 1975,
pá S-<br />
136<br />
7. ON A NORTE DE CA [A MARCA<br />
CUADRO N° 21<br />
UTILIDADES ESTIMADAS POR CULTIVOS EN ET. STIRSECTOR HUAT.GAYOC<br />
( 1974 - 1975 )<br />
Cultivos<br />
Area Anual <strong>de</strong><br />
Producción<br />
Ha,<br />
lo<br />
Ingie o Biuto<br />
Miles <strong>de</strong><br />
s/.<br />
ojo<br />
Costos Directos<br />
lo<br />
Utilida<strong>de</strong>s<br />
Miles <strong>de</strong><br />
s/.<br />
lo<br />
1<br />
Utilidad<br />
por<br />
Ha<br />
Miles <strong>de</strong><br />
S/-<br />
S/-<br />
II. Alimenticios<br />
15.990<br />
93,5<br />
106,338<br />
97,9<br />
74,594<br />
99,2<br />
31.744<br />
94,8<br />
--<br />
Papa<br />
Mafz<br />
Cebada<br />
Oca<br />
Olluco<br />
Arveja grano seco<br />
Arveja grano ver<strong>de</strong><br />
Haba<br />
Trigo<br />
Hortalizas varias<br />
Lenteja<br />
Camote<br />
Otros tubérculos<br />
Frijol<br />
Otros cereales<br />
Yuca<br />
Plátanos<br />
Cítricos<br />
2,965<br />
6,700<br />
3,259<br />
1,214<br />
812<br />
422<br />
86<br />
128<br />
133<br />
<strong>45</strong><br />
77<br />
28<br />
29<br />
51<br />
13<br />
10<br />
10<br />
8<br />
17-2<br />
39,3<br />
19,1<br />
7.1<br />
4,7<br />
2,5<br />
0,5<br />
0.7<br />
0,8<br />
0,3<br />
0,5<br />
0.2<br />
0,2<br />
0,3<br />
0,1<br />
0 0<br />
0..0<br />
0,0<br />
51., 888<br />
26.800<br />
13,<strong>03</strong>6<br />
4,856<br />
4,060<br />
2,532<br />
671<br />
576<br />
532<br />
360<br />
385<br />
147<br />
116<br />
153<br />
<strong>45</strong><br />
53<br />
80<br />
48<br />
47-8<br />
24,8<br />
12,1<br />
4 5<br />
3.7<br />
2.3<br />
0.6<br />
0,5<br />
0 C 5<br />
0,3<br />
0,4<br />
0,1<br />
0,-1<br />
0„1<br />
0.0<br />
0.0<br />
0.1<br />
0,0<br />
36,933<br />
19,162<br />
8.568<br />
3,739<br />
2,635<br />
1,531<br />
377<br />
408<br />
395<br />
277<br />
211<br />
90<br />
87<br />
79<br />
37<br />
35<br />
17<br />
13<br />
49.1<br />
25.5<br />
11.4<br />
5,0<br />
3,5<br />
2.0<br />
0.5<br />
0,5<br />
0,5<br />
0,4<br />
0.3<br />
0,1<br />
0,1<br />
0,1<br />
0 1<br />
0.1<br />
0,0<br />
0.0<br />
14,955<br />
7,638<br />
4.468<br />
1,117<br />
1,425<br />
1 001<br />
294<br />
168<br />
137<br />
83<br />
174<br />
57<br />
29<br />
74<br />
8<br />
18<br />
63<br />
35<br />
44.7<br />
22.8<br />
13,4<br />
3.3<br />
4 3<br />
3 0<br />
0 9<br />
0.5<br />
0 4<br />
0,2<br />
0-5<br />
0.2<br />
0.1<br />
0,2<br />
0.0<br />
0 1<br />
0.2<br />
0.1<br />
5,040<br />
1,140<br />
1.490<br />
920<br />
1,750<br />
2,370<br />
3,420<br />
1,950<br />
1 £ <strong>03</strong>0<br />
1.840<br />
2,260<br />
2,040<br />
1,000<br />
1,<strong>45</strong>0<br />
610<br />
180<br />
1,800<br />
4,380<br />
III<br />
Pastos y Forrajes<br />
1,112<br />
6,5<br />
2 S 333<br />
2.1<br />
624<br />
0..8<br />
1,709<br />
5,2<br />
--<br />
Otros forrajes<br />
Mafz cha<strong>la</strong><br />
Alfalfa<br />
Trébol t Rye grass<br />
962<br />
26<br />
<strong>45</strong><br />
79<br />
5.6<br />
0,1<br />
0-3<br />
0 5<br />
1,443<br />
187<br />
324<br />
379<br />
1.3<br />
0,2<br />
0,3<br />
0.3<br />
318<br />
100<br />
104<br />
102<br />
0.5<br />
0.1<br />
0.1<br />
0.1<br />
1,125<br />
87<br />
220<br />
277<br />
3,4<br />
0 3<br />
0,7<br />
0,8<br />
1.170<br />
3 S 350<br />
4,890<br />
3,500<br />
Total<br />
17,102<br />
100.0<br />
108 671<br />
100,0<br />
75,218<br />
100 0<br />
33,<strong>45</strong>3<br />
100,0<br />
--<br />
No existe categorfa<br />
Fuente: ONERN, 1975.<br />
I Industriales
ANEXO VI "DIAGNOSTICO AGROPECUARIO PSg.M'.'i<br />
CUADRO \' ¿¿<br />
U'jTLIDADhS FSTIMADAS POR CULI I VOS IN I L SUBSFCTOR C A.IAMARCA<br />
( 1974 " 197o )<br />
Ar.. j a Anual <strong>de</strong><br />
Producción<br />
Ha.<br />
%<br />
Inga-so Btuio<br />
Miles <strong>de</strong><br />
S/. 1<br />
%<br />
Costos Directos<br />
Miles <strong>de</strong><br />
s/.<br />
"/o J<br />
Utilida<strong>de</strong>s<br />
Miles <strong>de</strong><br />
s/.<br />
Pág, 138 ZONA NORTE DE CAJAMARCA<br />
CUADRO N° 23<br />
UTILIDADES ESTIMADAS POR CULTIVOS EN EL SUBSECTOR SAN MIGUEL<br />
( 1974 " 1975 )<br />
Cultivos<br />
Area Anual <strong>de</strong><br />
Producci6n<br />
Ha,<br />
lo<br />
Ingreso Bruto<br />
Miles <strong>de</strong><br />
s/.<br />
lo<br />
Costos Directos<br />
Miles <strong>de</strong><br />
s/.<br />
lo<br />
Miles <strong>de</strong><br />
s/.<br />
UtiUda<strong>de</strong>s<br />
lo<br />
Utilidad<br />
por<br />
Ha.<br />
I. Industriales<br />
, 10<br />
0.1<br />
69<br />
0,1<br />
15<br />
0.0<br />
54<br />
0.2<br />
• •<br />
Café<br />
Otros cultivos<br />
7<br />
3<br />
0,1<br />
0.0<br />
42<br />
27<br />
0,1<br />
0,0<br />
9<br />
6<br />
0.0<br />
0.0<br />
33<br />
21<br />
0.1<br />
0.1<br />
16,530<br />
7,000<br />
II. A limenticios<br />
9,667<br />
85.5<br />
64,302<br />
92.3<br />
43,729<br />
97.0<br />
20,573<br />
83,8<br />
• -<br />
Papa<br />
Arroz<br />
Maíz<br />
Arveja grano seco<br />
Trigo<br />
Olluco<br />
Arveja grano ver<strong>de</strong><br />
Yuca<br />
Camote<br />
Frijol<br />
Plátanos<br />
Oca<br />
Hortalizas varias<br />
Haba<br />
Cítricos<br />
Otros frutales<br />
Otros cereales<br />
Cebada<br />
1,243<br />
275<br />
2,515<br />
1,054<br />
1,074<br />
304<br />
101<br />
128<br />
106<br />
106<br />
24<br />
155<br />
69<br />
57<br />
17<br />
13<br />
75<br />
2,351<br />
11.1<br />
2.5<br />
22.5<br />
9.4<br />
9.6<br />
2.7<br />
0,9<br />
1.2<br />
0.9<br />
0,9<br />
0,2<br />
0,4<br />
0,6<br />
0.5<br />
0.2<br />
0.1<br />
0.7<br />
21,0<br />
21,735<br />
6,600<br />
10,060<br />
6,324<br />
4,296<br />
1,520<br />
788<br />
672<br />
557<br />
318<br />
192<br />
620<br />
552<br />
257<br />
102<br />
65<br />
240<br />
9,404<br />
31.1<br />
9.5<br />
14.4<br />
9,1<br />
6.2<br />
2.2<br />
1.1<br />
1.0<br />
0.8<br />
0.5<br />
0,3<br />
0.9<br />
0.8<br />
0.4<br />
0.1<br />
0.1<br />
0.3<br />
13.5<br />
17,502<br />
2,421<br />
7,192<br />
3,594<br />
3,190<br />
986<br />
342<br />
<strong>45</strong>1<br />
338<br />
16*<br />
40<br />
477<br />
426<br />
182<br />
29<br />
18<br />
197<br />
6,180<br />
38.8<br />
5.4<br />
15.9<br />
8.0<br />
7.1<br />
2.2<br />
0.8<br />
1.0<br />
0.7<br />
0.4<br />
0,1<br />
1.1<br />
0.9<br />
0.4<br />
0.1<br />
0.0<br />
0.4<br />
13.7<br />
4.233<br />
4.J79<br />
2,868<br />
2,730<br />
1,106<br />
534<br />
446<br />
221<br />
219<br />
154<br />
152<br />
143<br />
126<br />
75<br />
73<br />
47<br />
43<br />
3,224<br />
17,3<br />
17.0<br />
11.7<br />
11.1<br />
4.5<br />
2.2<br />
1.8<br />
0.9<br />
0.9<br />
0.6<br />
0.6<br />
0.6<br />
0.5<br />
0.3<br />
0.3<br />
0.2<br />
0.2<br />
13.1<br />
3,400<br />
15,200<br />
1,140<br />
2.590<br />
1,<strong>03</strong>0<br />
1,760<br />
4,420<br />
1,730<br />
2,060<br />
1,<strong>45</strong>0<br />
6,330<br />
920<br />
1,830<br />
1,320<br />
4,300<br />
3,620<br />
570<br />
1,370<br />
III. Pastos y Forrajes<br />
1,496<br />
14.4<br />
5,282<br />
7.6<br />
1,349<br />
3.0<br />
3,933<br />
16.0<br />
»••<br />
Tíébol * Rye grass<br />
Otros forrajes<br />
Alfalfa<br />
Mafz cha<strong>la</strong><br />
655<br />
691<br />
132<br />
18<br />
5,9<br />
6.2<br />
2.1<br />
0.2<br />
3.144<br />
1.<strong>03</strong>7<br />
950<br />
151<br />
4.5<br />
1.5<br />
1.4<br />
0.2<br />
831<br />
228<br />
221<br />
69<br />
1.8<br />
0.5<br />
0.5<br />
0.2<br />
2,313<br />
809<br />
729<br />
82<br />
9.4<br />
3.3<br />
3.0<br />
0.3<br />
3,530<br />
1,170<br />
5,520 |<br />
4,560<br />
Total<br />
11,173<br />
100,0<br />
69,653<br />
100,0<br />
<strong>45</strong>,093<br />
100.0<br />
24,560<br />
100.0<br />
m M m<br />
Fuente: ONERN , 1975
ANEXO VI-DIAGNOSTICO<br />
AGROPECUARIO<br />
pá g-<br />
139<br />
CUADRO N" 24<br />
UTILIDADES-ESTIMADAS PORCULTIVOS EN EL SUBSECTOR CONTUMAZA<br />
( 1974 - 1975<br />
Cultivos<br />
Area Anual <strong>de</strong><br />
Producción<br />
Ha.<br />
lo<br />
Ingreso Bruto<br />
Miles <strong>de</strong><br />
s/.<br />
lo<br />
Costos Directos<br />
Miles <strong>de</strong><br />
s/.<br />
lo<br />
Miles <strong>de</strong><br />
s/.<br />
Utilida<strong>de</strong>s<br />
"lo<br />
Utilidad<br />
por<br />
Ha.<br />
s /.<br />
I. Industriales<br />
121<br />
3.0<br />
1,488<br />
5.3<br />
808<br />
4.8<br />
680<br />
6.2<br />
--<br />
Caña <strong>de</strong> azúcar<br />
Otros cultivos<br />
114<br />
7<br />
2.8<br />
0.2<br />
1,425<br />
63<br />
5.1<br />
0.2<br />
796<br />
12<br />
4.7<br />
0.1<br />
629*<br />
51<br />
5.7<br />
0.5<br />
5,520<br />
7, 290<br />
II.<br />
Alimenticios<br />
3,876<br />
93.8<br />
25,463<br />
91.8<br />
15,713<br />
93.7<br />
9,750<br />
88.8<br />
--<br />
Arroz<br />
Trigo<br />
Maíz<br />
Papa<br />
Cebada<br />
Arveja grano seco<br />
Yuca<br />
Camote<br />
Plátanos<br />
Lenteja<br />
Frijol<br />
Arveja grano ver<strong>de</strong><br />
Otros frutales<br />
OIluco<br />
Haba<br />
Oca<br />
Cítricos<br />
Hortalizas varias<br />
Otros cereales<br />
309<br />
1,341<br />
837<br />
216<br />
538<br />
232<br />
93<br />
64<br />
18<br />
47<br />
67<br />
22<br />
20<br />
24<br />
19<br />
23<br />
3<br />
2<br />
1<br />
7.5<br />
32.5<br />
20.3<br />
5,2<br />
13.0<br />
5.6<br />
2.2<br />
1.6<br />
0.4<br />
1.1<br />
1.6<br />
0.5<br />
0.5<br />
0.6<br />
0.5<br />
0.6<br />
0.1<br />
0.0<br />
0.0<br />
7,416<br />
5,364<br />
3,348<br />
3.780<br />
2,152<br />
1,392<br />
488<br />
336<br />
144<br />
235<br />
201<br />
172<br />
100<br />
120<br />
86<br />
92<br />
18<br />
16<br />
3<br />
26.7<br />
19.3<br />
12.1<br />
13.6<br />
7.8<br />
5.0<br />
1.8<br />
1.2<br />
0.5<br />
0.9<br />
0.7<br />
0.6<br />
0.4<br />
0.4<br />
0.3<br />
0.3<br />
0.1<br />
0.1<br />
0.0<br />
2,890<br />
3,983<br />
2,393<br />
3,040<br />
1,415<br />
842<br />
329<br />
205<br />
30<br />
129<br />
1<strong>03</strong><br />
96<br />
26<br />
78<br />
61<br />
72<br />
6<br />
12<br />
3<br />
17.2<br />
23.7<br />
14.3<br />
18.1<br />
8.4<br />
5.0<br />
2.0<br />
1.2<br />
0.2<br />
0.8<br />
0.6<br />
0.6<br />
0,2<br />
0.5<br />
0.4<br />
0.4<br />
0.0<br />
0.1<br />
0.0<br />
4,526<br />
1,381<br />
955<br />
740<br />
737<br />
550<br />
159<br />
131<br />
114<br />
106<br />
98<br />
76<br />
74<br />
42<br />
25<br />
20<br />
12<br />
4<br />
0<br />
41.3<br />
12.6<br />
8.7<br />
6.7<br />
6.7<br />
5.0<br />
1,4<br />
1.2<br />
1.0<br />
1.0<br />
0.9<br />
0.7<br />
0.7<br />
0.4<br />
0.2<br />
0.2<br />
0.1<br />
0.0<br />
0.0<br />
14,650<br />
1,<strong>03</strong>0<br />
1,140<br />
3,430 |<br />
1,370 ¡<br />
2,.37
CUADRO N 0 25<br />
PRESTAMOS DEL BANCO AGRARIO Y FONDO EN FIDEICOMISO<br />
SECTOR I ( NORTE )<br />
Fondo en Fi<strong>de</strong>rcomiso<br />
Banco Agrario<br />
Total<br />
Tipo<br />
Préstamos<br />
Monto<br />
Préstamos<br />
Monto<br />
Préstamos<br />
Monto<br />
N 0<br />
%<br />
Soles<br />
%<br />
N 0<br />
%<br />
Soles<br />
%<br />
N 0<br />
%<br />
Soles<br />
%<br />
Pequeña Agricultura<br />
Avio Agrico<strong>la</strong> : CP<br />
Avio Agrfco<strong>la</strong> : LP<br />
Avfo Pecuario : CP<br />
13<br />
92.9<br />
277, 990<br />
14.9<br />
140<br />
1<br />
4<br />
96.5<br />
0 o 7<br />
2.8<br />
3'60} ,470<br />
13,800<br />
831,000<br />
81.0<br />
0.3<br />
18.7<br />
153<br />
1<br />
4<br />
96.3<br />
0.6<br />
2.5<br />
3'879,460<br />
13,800<br />
831,000<br />
61.4<br />
0.2<br />
13.2<br />
Subtotal<br />
13<br />
92.9<br />
277, 990<br />
14.9<br />
1<strong>45</strong><br />
100.0<br />
4'446,270<br />
100.0<br />
158<br />
99.4<br />
4'724, 260<br />
74.8<br />
Grupos Organizados<br />
Avio Agrico<strong>la</strong> : LP<br />
1<br />
7.1<br />
T 590,000<br />
85.1<br />
—<br />
—<br />
—<br />
—<br />
1<br />
0.6<br />
1 '590, 000<br />
25.2<br />
Subtotal<br />
1<br />
7.1<br />
T590,000<br />
85,1<br />
—<br />
~._<br />
~~<br />
—<br />
1<br />
0.6<br />
T590,000<br />
25.2<br />
Total<br />
14<br />
100.0<br />
T 867, 990<br />
100.0<br />
1<strong>45</strong><br />
100.0<br />
4 , 44ó, 270<br />
100.0^<br />
159<br />
100.0<br />
6'ZU,260<br />
100.0<br />
rúente: Banco Agrario<br />
C, P. - C orto Pía zo<br />
L. P. ' Largo P<strong>la</strong>zo
CUADRO N 0 26<br />
PRESTAMOS DEL CANCO AGRARIO Y FONDO EN FIDEICOMISO<br />
SECTOR 11 (SUR)<br />
Fondo en Fi<strong>de</strong>icomiso<br />
Banco Agrario<br />
Total<br />
Tipo<br />
Préstamos<br />
Monto<br />
Préstamos<br />
Monto<br />
Préstamos<br />
Monto<br />
N 0<br />
o/<br />
7o<br />
Soles<br />
%<br />
N 0<br />
%<br />
Soles<br />
%<br />
N 0<br />
%<br />
Soles<br />
%<br />
Pequeña Agricuitu -a<br />
AvFo Agnco<strong>la</strong><br />
AvFo Pecuario<br />
AvFo Pecuario<br />
Reface. Mobi liarlo<br />
CP<br />
CP<br />
LP<br />
CP<br />
52<br />
14<br />
6<br />
70.3<br />
13.9<br />
3 1<br />
369, 750<br />
910,000<br />
20,900<br />
16.3<br />
17.1<br />
0.4<br />
2<strong>45</strong><br />
4S<br />
1<br />
83.3<br />
16.3<br />
0.4<br />
3'536,350<br />
3'240,000<br />
30,000<br />
52.0<br />
47.6<br />
0.4<br />
297<br />
62<br />
1<br />
6<br />
80.7<br />
16.9<br />
0.3<br />
1.6<br />
4 , 40ó, 100<br />
4'150,000<br />
30,000<br />
20,900<br />
36.3<br />
34.2<br />
1.3<br />
0.2<br />
Subtotal<br />
72<br />
97.3<br />
1" 800,650<br />
33.8<br />
294<br />
100.0<br />
6' 806,350<br />
100.0<br />
366<br />
99.5<br />
8 , 607,000<br />
71.0<br />
Grupos Organizados<br />
AvFo Agnco<strong>la</strong><br />
: LP<br />
2<br />
2.7<br />
3 , 520,000<br />
66.2<br />
—<br />
—<br />
—<br />
—<br />
2<br />
0.5<br />
3 , 520,000<br />
29.0<br />
Subtotal<br />
2<br />
2.7 j 3 , 520,000<br />
66.2<br />
—<br />
—<br />
—<br />
—<br />
2<br />
0.5<br />
3 , 520,000<br />
29.0<br />
Total<br />
74<br />
100.0 J 5'320,650<br />
100.0<br />
294<br />
100.0<br />
6'806,350<br />
100.0<br />
368<br />
100.0<br />
12'127,000<br />
100.0<br />
Fuente: Buicc - erario<br />
CP. - Corto P<strong>la</strong>zo<br />
L P. Largo Pl^zo
MAPA NO. 1: CLIMATOLÓGICO<br />
MAPA NO.2 : ECOLÓGICO Y APTITUD FORESTAL<br />
MAPA NO.3 : AGR0ST0L0GIC0<br />
MAPA NO.4 : GEOLÓGICO Y MINERO<br />
MAPA NO.5 : HIDROLÓGICO Y TRANSPORTES<br />
MAPA NO. 6 : GRANDES GRUPOS DE SUELOS ( HOJAS 1 Y 2 )<br />
MAPA NO.7 : GRUPOS DE CAPACIDAD DE USO MAYOR DE LAS TIERRAS ( HOJAS 1 Y 2 )<br />
MAPA No.8: SISTEMA DE RIEGO ( ZONAS CUTERVO, COCHAEAMBA Y CONCHAN )<br />
MAPA NO.9 : SISTEMA DE RIEGO ( ZONAS CHOTA, BAMBAMARCA )
ATÚRALES
OFICINA<br />
• '<br />
• • • • - - • • • •••<br />
BEPUBL,CA ML PERU<br />
CLASIFIMCIOB<br />
CLIHATOLOGlCfl<br />
NACIONAL DE EVALUACIÓN DE RECUBSOS NArURAlES<br />
ONERN<br />
CUMASfflwaWMKal<br />
DESCRIPCIÓN<br />
- — —<br />
DAD P«W ACTIVIDADES<br />
SIERRA NORTE DE CAJAMAECA<br />
MAPA CLIMATOLÓGICO<br />
i<br />
)<br />
"^X^<br />
,<br />
Esca<strong>la</strong> 11200,000<br />
?._'_°_ _ f<br />
FUENTE: Carta Nacional Fotogra^étriea 1:100,000 IGM. InlorrradÓn hemáfíca<br />
y oomprobaciér <strong>de</strong> tampo ohtenidos por ONERN con fotografTos aérens<br />
USAF<strong>de</strong> I9ól.<br />
1 ..,„..,<br />
^ •, fm^'—<br />
. _ . J :• • 1<br />
: ••• , •<br />
—' I ^ A " ' -/" "•''<br />
— MM<br />
Br C =•<br />
Ar C 1 •„<br />
•i;; 3%<br />
^t^<br />
UMlíg<br />
ont^<br />
Coi hí bomba<br />
Chora<br />
Son Juan<br />
ConlüroiS<br />
Lidian<br />
Timgftl<br />
i<br />
;<br />
'50<br />
^<br />
4*<br />
6/E<br />
5/B<br />
5/8<br />
-<br />
Ll^ .<br />
1_<br />
líwu<br />
::<br />
Í ••• cu<br />
W^^M^":.<br />
^<br />
•IT---<br />
MAPA DE UBICACIÓN<br />
i<br />
yi-j<br />
i<br />
Í^J\.<br />
' ' ' ' - i -<br />
j_<br />
i i 1<br />
isi
MAPA M «. 1<br />
i<br />
po/7o' :/<br />
'->'$<br />
#
•<br />
•<br />
/ ,..<br />
•mm+<br />
Wtm<br />
,8^. ROEH <strong>de</strong> <strong>la</strong> VmB<br />
\<br />
^ n Andtfe dC C<br />
\<br />
ZONAS DE VIDA<br />
ESÍPOO - Mcnlti^o Tropical<br />
TIERRAS COM VOCACIÓN FORESTAL<br />
««„<br />
SUPfUFICIE<br />
Ha.<br />
%<br />
„<br />
OFICINA NACIONAL DE EVALUACIÓN DE RECORSOS NATURALES<br />
ONERN<br />
SIERRA NORTE DE CAJAMARCA<br />
MAPA ECOLÓGICO Y DE<br />
APTITUD FORESTAL<br />
ESCALA 1: 200,000<br />
/ \<br />
^ ^-/"^<br />
/••^J.Í- .<br />
: •-•- : C'\<br />
• \<br />
' -H ^<br />
/ , , >-••-':<br />
;<br />
A<br />
\ ..^'::••• 'T '<br />
. /•• /•• \<br />
Bosque tórred., - Montono Wicsl<br />
Ensíl. my- hú^iedt, - Metano Troprcal<br />
.<br />
3,230<br />
33,««<br />
100.0<br />
FUENTE ! Carta Nacional FotogtaméKico 1: 100,000 IGM.<br />
Información Vemot<br />
y oomprobacién <strong>de</strong> campo obtenidas por ONERN con fotogroRas aén<br />
USAF<strong>de</strong>I96l..<br />
ZONAS DE VIDA 0 FORMACIONES VEGETALES<br />
¿ircnTERVO'-.<br />
- .-A<br />
y<br />
;• /<br />
memmc**<br />
1 «....l^.i..^,...,...!,*.!<br />
. «,„..,,„.-„....,„,*,,<br />
3 Bosque seco - Príüiumtano Tropical<br />
5 Bosque seno - Montano Bolo Tropical<br />
,.-,:<br />
L-H<br />
i "-""I<br />
• ,»D<br />
«<br />
,..<br />
"<br />
,..<br />
7 BosquemjvhLWo-MoT.tonoEoioTropicat<br />
ííi'smbaí<br />
-—vi.<br />
I<br />
\ \<br />
••$
i**
-<br />
(<br />
\<br />
/<br />
/<br />
\<br />
.-fro/orros<br />
/<br />
co '• ,<br />
- \ X<br />
\,S-,?.<br />
a>fls <strong>de</strong> <strong>la</strong> Vifi<br />
\."Sin Andres<br />
*xc„.m„<br />
\ )<br />
\<br />
OFICINA NACIQHU DE EVALUACIÓN DE RECURSOS NATUCALES<br />
ONKRN<br />
SIERRA NORTE DE CAJAMARCA<br />
MAPA AGROSTOLOGICO<br />
Esca<strong>la</strong> 1:200.000<br />
J 0<br />
1977<br />
FUENTE : CortQ NaeiOTo Fotogrométrica 1:100,000 !GM,<br />
\<br />
/ comprobociéi<br />
I<br />
\ \<br />
US A F <strong>de</strong> 1961<br />
Infomocán tefnáKeo<br />
da camoo obleridos por ONERN con fotdgrofras oiSrAis<br />
Í<br />
\<br />
\CHOTA,<br />
^-«*><br />
Suro*^^<br />
íomo Cuchi/<br />
L--<br />
V__í<br />
\<br />
San Juan Pan<br />
3AMBAMAECA<br />
^<br />
Mina El Dorado<br />
SIGLOS COMVENCIOHALES<br />
fflpa Cowa!<br />
;<br />
c<br />
§nwnab)<br />
;<br />
/<br />
1<br />
^ \<br />
l<br />
BAMBAMARCA<br />
ASOCIACIONES AGR0ST0L0GICAS DETERMINADAS EN EL AREA DE ESTUDIO<br />
t<br />
/* ,*-: //<br />
ASOCIACIONES<br />
SÍMBOLO<br />
EX "ENS'ON<br />
(Ho.l<br />
•09,300<br />
PORCENTAJE EN RELACIÓN<br />
POTENCIAL<br />
AL AREA TOTAL DEL ESTUDIO<br />
19.9 bueno<br />
I<br />
/<br />
Co<strong>la</strong>magrosBnim<br />
PospaleUm<br />
Festuchehim<br />
Oconales<br />
—<br />
35.000<br />
3,600<br />
3.«0<br />
•,500<br />
6.4 __<br />
O.á<br />
0.6<br />
0.3<br />
pobre<br />
medio • pobre<br />
boon.<br />
„*<br />
)<br />
Slipelum -Colomagrowtura<br />
SUBTOTAL<br />
500<br />
,53,300<br />
0.1<br />
27.9<br />
pobro<br />
Af lQrom : enro rocoso<br />
en el drea <strong>de</strong> pOsh»<br />
•tOO<br />
0.1<br />
CAJAMARCA^<br />
Otras Areas ( Agrrco<strong>la</strong>i,<br />
relictos, cojas <strong>de</strong> rros, etc.<br />
TOTAL<br />
396,3Q0<br />
550,000<br />
72.0<br />
100.O
MAPA i'Jo. 3
PEKF1L CEOLOGICi)<br />
(B - B")<br />
OFfCINi NACIONAL DE EVALUACIÓN Oí RECORSDS NATURALES<br />
ONERN<br />
SIERRA NORTE DE CA.TAMARCA<br />
MAPA GEOLÓGICO Y MINERO<br />
•¿o.T0„os[,_<br />
Esca<strong>la</strong><br />
lr2DO.ODO<br />
1977<br />
FUENTE : Corta Nocional FotogromélricQ 1:100,000 1GM. Información temí<br />
y comprobaclán <strong>de</strong> campo obtenidos por ONERN con falografTas al<br />
USAF <strong>de</strong>! 961.<br />
PBBm GEOLQGlca (4 - A')<br />
^< _ /<br />
ASPECTOS GEOLÓGICOS • •• .. !.<br />
L» *M<br />
^<br />
J¿ _<br />
FUENTES TERMALES<br />
SÍMBOLOS GEOLÓGICOS<br />
) ;:.:-í/. CTÍ.^<br />
m (<br />
SIGNOS<br />
Capital <strong>de</strong> Pfo-in<br />
CapiMld«Distrilo<br />
&M * fe "<br />
CONVENCIONALES<br />
CHOTA<br />
Conchan<br />
Qnivindha<br />
mv*<br />
Curva <strong>de</strong> nivel<br />
LM^^I.<br />
— - - 1<br />
^<br />
woe- —<br />
>\^'(<br />
íííí?-<br />
1 /<br />
m<br />
y<br />
^<br />
ASPECTOS GEOLÓGICOS<br />
FOSMACION L 1 T O L O PEílODO O 1 A 1 aWlOLO<br />
,. BOCAS SEDIMENTARIA;<br />
Dep^iro^FW»<br />
1=-'<br />
•7 J<br />
'• ¡1<br />
•-yi<br />
ted<br />
Ks-ce |<br />
B<br />
Oiia<br />
Ceño. - (l)ta<br />
Qjil^nTn-<br />
Forimciín<br />
con rascas £oiiliIefQSi>odulont y cu [i zas <strong>de</strong> Igmio;.<br />
:¡s i * ssssiSsss ; ^<br />
Compolicién het.tcaí^o r h.tetco.aniKia <strong>de</strong> Biban-<br />
NARÍO<br />
„..„., ..im....». .,....,,„,*.<br />
Iconics Tofo! aglopeíodis conrei.lendo par^olrsnte corbfin.<br />
Humboi De vi.ied» colore! y cor. p-sdominir. RUJÍO.<br />
^n Poblt, compiili&i d-oitico /(iOffilOJ, <strong>de</strong> voriodos colores<br />
FornociÓr Chota<br />
jen accr<strong>de</strong>ntol. Es un <strong>de</strong>pósito <strong>de</strong> lipoFlysch.<br />
Luirai tibies eu/fosiliTwas.irie^fado! «n c-<br />
Forrmciá,<br />
G-Isndrn<br />
tienCforaninTFcros', n l»eo (i m( 1 ITdo!<br />
rss^Kss^:—*•<br />
„„,»„»,,—,.».-*.-<br />
CciiMsa.cilloBsyiiiorHOs aajyh, coi. «IralifÍM-<br />
fed<br />
Xf'Sj<br />
I CAJAMARCA<br />
Pafí^íaX<br />
ChuITc'-lnM<br />
Chulee<br />
Foj^ifo.<br />
for^oTón<br />
ifflta-GAai<br />
""<br />
~~s S23 :~.í.r.-1.;<br />
Colisas Brises. ^as y Mitas pardal cor abundan a<br />
C;.....„,..,..^,,,-, ,.,„,..,!-<br />
SHiS££9SuS<br />
ZOÍ, i mere itrorifi cadas con dolgados «Iralo! da nava<br />
cw «i<strong>la</strong>s <strong>de</strong> p<strong>la</strong>nta, fóiile!.<br />
b£n y alguna! kiriras carbonosas.<br />
2. ROCA; Í G N E A ; INTRUSIVA;<br />
l«-*l|<br />
• -<br />
1<br />
ed<br />
M<br />
-<br />
TERCiABIO .. ,,,., ^W»»» fPÍfi'i'. !••*! rdiqwsd» compone,finsraj.<br />
M?A<br />
DE UÍÍ.;CAC:;;;!M<br />
•..,•1;....<br />
>mmmm<br />
v ' • f I<br />
L _* íj =H _<br />
-%-. VK;-';-^^-^-"<br />
1 I a,'f -'I<br />
uJ 1 I ¡si _
,».,-, ••^—uj injimmn^w«•Hpwyw»»
• •<br />
\ í J<br />
\<br />
1 -~<br />
w<br />
r<br />
1<br />
\-%A<br />
í i. """^ r .,,,<br />
/ J<br />
J / .,,<br />
i^fevS<br />
• ^<br />
CM. So<br />
/--<br />
w<br />
;<br />
Ro^ <strong>de</strong> ia vas.<br />
\ •<br />
,^.i An, -c, JL Cu<br />
\<br />
\<br />
i *<br />
\<br />
V<br />
%* 1<br />
'"* ^\<br />
DISTANCIAS APROXIMADAS DE LA ZONA EVALUADA ( EN KM . )<br />
CUTERVO<br />
SOCOTA.<br />
\<br />
COCHASAMBA<br />
cnú-A<br />
B AM SAM ARC A<br />
HUA.GAYOC<br />
CONTIMAZA<br />
NINABAMSA<br />
PEDERNAL<br />
SAN MIGUEL<br />
CHILETE<br />
MAGDALENA<br />
ASUNCION<br />
SAN JUAN<br />
CAJAMARCA<br />
Í. 5<br />
6 ^<br />
30<br />
•!»<br />
,.,.<br />
-h<br />
4Í IW<br />
«|!!J<br />
2?! 321<br />
». ~<br />
ÍJD<br />
.41 ¡71<br />
m\m<br />
|<br />
3<br />
61<br />
1^<br />
ill<br />
60 ' n<br />
X 123<br />
63<br />
-<br />
W »|»<br />
115<br />
leo<br />
,„<br />
117<br />
137<br />
!1D<br />
ra_<br />
3! "OS<br />
S31<br />
zro<br />
178<br />
175<br />
T77<br />
IS: 1S7<br />
1<strong>45</strong> 1!<br />
8<br />
1<br />
130<br />
133<br />
79<br />
70<br />
¡7<br />
16<br />
7!<br />
1<br />
147<br />
1M<br />
130<br />
«><br />
i 1<br />
ill ¡<br />
330 193 146<br />
m m<br />
•199 ' -72<br />
270 U3<br />
237 1 100<br />
33<br />
83<br />
128<br />
39<br />
63<br />
87<br />
ÍT<br />
m<br />
73<br />
B3<br />
75<br />
115<br />
214<br />
176<br />
1.3 ' i . .<br />
166<br />
135<br />
192 291<br />
ZÍ2<br />
-16,161 360<br />
86 132 231<br />
54 1 m | 198<br />
H-<br />
72 116<br />
47<br />
39<br />
2,4<br />
1 S S i<br />
ill!<br />
268 270 24^ 206 í<br />
298 300 27' ! 236<br />
237 1219 2'0 174 '<br />
75 177<br />
47 SO 130<br />
43 1 a7 9!<br />
163 165<br />
146 10! 111<br />
135<br />
81<br />
4,'i »• | 122 ' UTj 151<br />
46 W<br />
ni<br />
.1 151<br />
64 AS | 92<br />
122| 24<br />
47 |<br />
S!|<br />
» 48 62<br />
3B| JO<br />
113<br />
r<br />
i-'.<br />
66<br />
<strong>45</strong><br />
13<br />
3D 66<br />
1<br />
Ji " M i<br />
DHCINS NÍCIÜNAL DE EVALUACIÓN DE RECURSOS NATORALES<br />
OXERN<br />
SIEBRA NORTE DE CAJAMARCA<br />
MAPA HIDROLÓGICO<br />
Y DE TRANSPORTES<br />
Esca<strong>la</strong> 1:200.000<br />
CUADRO DE DISTANCIAS APROXIMADAS ( ES KM. )<br />
DE CAJAMARCA A LOS FOCOS DE CONSUMO<br />
\ PE<br />
\<br />
.*.-<br />
\}-<br />
CA.AMARC-<br />
TRUJLLO<br />
CHICL4YO<br />
L7M<br />
PIURA<br />
í ijl<br />
i 3D0 i II 2<strong>45</strong> «49 i<br />
2W<br />
B49<br />
53i<br />
M<br />
n^Biv<br />
546<br />
ASI m [1019<br />
s<br />
536<br />
48)<br />
i<br />
i<br />
1W | 230*<br />
107<br />
270 102<br />
¡¿r* 5<br />
138<br />
74<br />
m<br />
PACASMAYO<br />
CHEPEN<br />
199<br />
»•<br />
107 102 6S<br />
138 1 74 686 «Tj II<br />
^ORU-UEfiA &,<br />
^<br />
^<br />
/ A<br />
V<br />
'<br />
'--VCHOT^ .^ :<br />
[y \<br />
,V"~—"Í!H. Odo. Chol<strong>la</strong> O -<br />
.p.„„„ \<br />
|«-<br />
íiB Jaan Pamun<br />
^MARCA<br />
V<br />
Ci E"E|C.<br />
B.,. í^^fV....<br />
"'*':••<br />
iw^&aw^<br />
**&*» heprnto<br />
S1MB0L0GIA<br />
C«wl <strong>de</strong> Ds^dín E»,^,^<br />
TferibfóM-<br />
J<br />
-<br />
-<br />
— E<br />
•Jr^l sn C^sti-^iÓr<br />
í /'<br />
... y<br />
,,c' r \ s — euiics^<br />
^OH<br />
PpaHuacarume<br />
A<br />
tí<br />
'<br />
í<br />
^<br />
l<br />
\<br />
..o 1<br />
u<br />
rsralfre^.t-ao<br />
Cmdücto CiibiartD Proyectado |=<br />
Centn.lHldr«ll«7iC. Exista<br />
fo»^»*,^*<br />
6.^60 HldWfr^ £,:««.<br />
Saetín Hl^M*, P^i^dg<br />
E¡rtl.,6.HidomÍKCOP,0/6C)a<strong>de</strong><br />
Cortrol<strong>de</strong>Calidod^Ag.,,<br />
RáP.d0<br />
t<br />
= =====:|<br />
ft<br />
= = = <<br />
E^'<br />
«<br />
0<br />
«<br />
*<br />
^ s =<br />
EPALBAQTES SISTEMA VIAL<br />
CUS FICACI0N SEGÚN HPORTANCIA Y SUPERFICIE DE RODADURA SÍMBOLO 0F CIAL<br />
feáFeo<br />
tt.Rua. <strong>de</strong> Churabil<br />
<strong>de</strong>l'Monre<br />
•Co rn<br />
PDZ 0 Seco •<br />
53<br />
c,..-,.<br />
( 2>a<br />
/<br />
J^<br />
O<br />
INTENSIDAO DE TRAFICO<br />
CAJAMARCA<br />
SIGNOS CONVENCIONALES<br />
CHOTA<br />
Conrhín<br />
! V-tmi<br />
MAPA DE UBICACIÓN<br />
Í ~ - Í<br />
1 /._<br />
-A l =<br />
-<br />
¿íl
i^<br />
n ¿t<br />
""""••'-••ffir-Trrr.twi -gitjimwuijiL<br />
«""««wwm<br />
A rio. 5 |<br />
g y ^Timni.BWI.iniii.iaAffll<br />
^««.«iL
• ' • • ' • • • - ^<br />
•'<br />
' • %<br />
CLASES DE PENDIENTES<br />
ASOCIACIONES DE GEAMDES GRUPOS DE SUELOS ( FAO-1974<br />
1<br />
SÍMBOLO<br />
A<br />
B<br />
C<br />
D<br />
E<br />
RANGO<br />
0 - 5 %<br />
5 - 15 %<br />
15 - 25%<br />
25 - 50%<br />
+ 50%<br />
TERMINO DESCRIPTIVO<br />
A nivel oaa.I a nivel<br />
Llgeramer'e inclinado a Inclinado<br />
Fueitemente inclinado<br />
Mod.,.d.m„., .mpMo o .Pi..do<br />
Mu/ empnado a ex'i-emadamen'e smpinado<br />
SUPERFINE<br />
500 C<br />
1<strong>03</strong>,750 18.9<br />
-B<br />
»-«.-!=<br />
"<br />
H - le<br />
H-lc<br />
Kaitano^em - Phaeojem calcáneo<br />
Kastanozem - Phoeozem calc'arico -<br />
fWozen,<br />
Phaeozem - Litosol ¿utrico<br />
Phaeozem - Litoiol calcárico ,<br />
Litosol calcárico<br />
1,950<br />
2,100<br />
39,250<br />
93,100<br />
34,800<br />
0.4<br />
7.2<br />
1S,9<br />
6.4<br />
Litaol dórico<br />
9,250 1.7<br />
B<br />
Cambisol<br />
10,100<br />
l.B<br />
Litowl calca-rico<br />
16,400 3.0<br />
B -le<br />
Camblsol - Litosol ¿utrioo<br />
10,200<br />
1.8<br />
le - le<br />
Lito.01 oalcdrico - Litosol luWoo<br />
Cambisol-Litosol dórico<br />
6,000<br />
1.2<br />
E - 1=<br />
Rendzino - Litosol calcáneo<br />
Paramosol éutrico<br />
11,050<br />
2.1<br />
EXPLICACIOH DEL SÍMBOLO<br />
- Gran Grupo <strong>de</strong> Suelos FAO<br />
:<br />
L,'-,:<br />
i"::;-<br />
Rendzina - Kaitanoiem - Lilosol calcó<br />
Andoiol<br />
Andosol mSlico<br />
'-.ridosol - Litosol éutrico<br />
" < : - •. Paramosol -dritrico<br />
mmk<br />
Paramcol éutrico - Litoiol éutrico<br />
PSd-ld Paramosol dístrico - Litosol dlVrlco<br />
PA Páramo andosol<br />
2,000<br />
8,750<br />
3.100<br />
13,400<br />
0.3<br />
1.6<br />
1.5<br />
2.4<br />
| faMe Andool mólico - LitosoUutrico<br />
PA - le<br />
Páramo ondosol - Litoiol éutrico<br />
17,<strong>45</strong>0<br />
3.2<br />
f" , '•'• '• t<br />
f<br />
fe<br />
•.•m<br />
Andoiot vírico - Litosol éutrico<br />
Xerosol calcico<br />
Xerolol - Lltojol éutrico<br />
PA - Id ]<br />
mm<br />
Páramo andosol - Litosol dFstrico<br />
SUBTOTAL<br />
Misceláneos: Cfc= 1 C),'loyonn ii ÍHM.»*-ÍM).<br />
Tierral urbana, y <strong>la</strong>guna.<br />
4,iO0<br />
547,200<br />
3,300<br />
500<br />
O'.B<br />
99.É<br />
0.4<br />
TOTAL<br />
550,000<br />
100.0<br />
(*} Menor <strong>de</strong> 0.1 %<br />
oE vos<br />
AHP! S _.<br />
\ ^ •--••-•.-.<br />
FAO | 1 974 |<br />
SOIL TAXONOMY (1973<br />
GRAN GRUPO<br />
GRAN GRUPO<br />
Fluvi.ol coicórico Uitlfluvent trpico<br />
Gleisol éutrico Tropacuept aérico<br />
Gleiiol calcárico Tropacuept trpico<br />
Gleiiol mélico Haplocuol fluvacuénftco<br />
Regosol éutrico Uitortent tFpico<br />
Begoiol calcárico U.tortent rfplco<br />
Uitocrepl liVico y Eutran<strong>de</strong>pt IT^ico<br />
Litoiol dütHco Disfrocrept lilico, Diitron<strong>de</strong>pt mico y Haplumbrept IHico<br />
Llfosol calcárico Uitoo^r irtico<br />
Rendzina<br />
Haplusto!, Rendol<br />
Cromustert éntico<br />
Andoiol mélico Eutran<strong>de</strong>pt ádico<br />
Andoial ócrico . Eutran<strong>de</strong>pt éntico<br />
Andosol vftrico Vitron<strong>de</strong>pf molleo<br />
XeK»oltóptIeo Combortld ustólico<br />
Xeroiol calcico Calciortid típico<br />
Kaitanazem háplico Haplurtoi trpico<br />
Kaitanorem calcico Calciuitol típico<br />
Phaeozem hápllco Hap udol trpico y Haplustol<br />
Hapluttol<br />
Phaeozem Wylco Argiudol típico y Argiustol<br />
Carriisol éutrico EutrqMpf típico<br />
CarrWsol gleico Eutrocrept ácuico<br />
Cambiiol húmico Hcplurrfcrept tfplco<br />
Paramoiol lutrico Criumbrept fFpico<br />
Paramoioldr.trico Criumbrept típico<br />
Páramo andosoi Crion<strong>de</strong>pt típico<br />
Chernozem calcico Crioborol típico<br />
(<br />
i<br />
/<br />
C<br />
M<br />
\<br />
\<br />
\ - ' • - ' Í<br />
\ t<br />
T<br />
x "o"<br />
\ \<br />
/ .<br />
-í?<br />
i<br />
í<br />
/<br />
-ir / E<br />
1<br />
Í<br />
~¿"<br />
a<br />
A<br />
-.S:<br />
"'••i*.<br />
• : yr- m<br />
'.*• íó^aí^pi<br />
>/<br />
f<br />
1<br />
¡<br />
H i «a,<br />
- t<br />
SIGNOS CONVENCIONALES<br />
Capital <strong>de</strong> provincia BAMBAMARCA<br />
Capital <strong>de</strong> distrito<br />
Conchan<br />
Pob<strong>la</strong>do.<br />
QuiT-ndia<br />
Puente =;<br />
Mina<br />
^<br />
Cota comprobado<br />
Ruina arqueológico<br />
Tin. dk<br />
MAPA No. 6
78° M-
i EMPALME COK F<br />
DIAGííAMA DE EMPALME<br />
=4,. MAPA DE UBICACIÓN<br />
. o<br />
1<br />
f f!<br />
M —<br />
J<br />
3<br />
•<br />
l<br />
1<br />
PERU<br />
»•<br />
-<br />
.wlfl<br />
ASOCIACIONES DE GRANDES GRUPOS DE SUELOS ( FAO-1974 )<br />
ASOCIACIONES<br />
SUPERFICIE<br />
550 ¡ 0.1<br />
1,750 0.3<br />
-5Q0 (*)<br />
1<strong>03</strong>,750 18.9<br />
1 i<br />
e,- 19"<br />
FAO( 1974)<br />
GRAN GRUPO<br />
SOIL TAXONOMY ( 1973)<br />
GRAN GRUPO<br />
:alcárico - Li-oso éutric:<br />
Fluvisol calcdrico<br />
Uitlfluvent trplco<br />
.v<br />
I &<br />
K • íolRendzina - Kostaíioi<br />
Gleiiol éutrico<br />
Gleiiol calcárico<br />
Tropacuepi aér'co<br />
Tropacuept tfpico<br />
¡ • I ^ H 1 Andosol<br />
,«,..1-1..,<br />
30,200 5.6<br />
Regoiol éutrico<br />
Regosol calcárico<br />
Uilortent tipico<br />
Ustortent tfpico<br />
Lirosol éutrico<br />
Ustocrep- Iftico y Eu'-arr<strong>de</strong>pt Iftico<br />
fcndoiol vítñco - Litosol éutrico<br />
Litosol dTslrico<br />
Diitrocrepf irtico, Distran<strong>de</strong>pt Irlico y Haplumbrept írtic<br />
Rendzina<br />
Hapluitol, Rendol<br />
s<br />
it'<br />
T<br />
'-V<br />
M<br />
/<br />
\<br />
/<br />
SIGNOS CONVENCIONALES<br />
Capüal <strong>de</strong> provincia<br />
CHOTA<br />
Capifal<strong>de</strong>dlsfrlto<br />
Chup.r<br />
Pob<strong>la</strong>dos<br />
LUd¿,<br />
H - le<br />
H - le<br />
i<strong>la</strong>nozBm - Phaeozem calcárit<br />
Phoeozem - L : tosol éut-li<br />
Phaeoiem - Litosol calcé<br />
7,150 1.3<br />
1,950 0.3<br />
2,100 0,-<br />
39,250 7.2<br />
93,100 16.9<br />
34,800 ' 6.4<br />
!0,10C 1.8<br />
Ardosol móiico Eutran<strong>de</strong>pt údico<br />
Anco-oi a — .-o ít iran<strong>de</strong>p' éntico<br />
Andoso v^ir'co V'^an<strong>de</strong>pt- molleo<br />
Xsrosol háplico Cambortid ullólico<br />
Xerosol célcieo Colciortid típico<br />
Kaitanozem hóplico Hapluífol típico<br />
Phaeoiem háplico Hoplydol típico y Haplusiol<br />
Puente<br />
imbisol - Litoso Nutrí co<br />
10,200<br />
\ \ \<br />
- /<br />
. : • • • • . . . • .<br />
;•••• . •;•• ;v;._:;v • •• .•<br />
T.,.d 1|;'<br />
É|<br />
Mina<br />
Cota comprobada<br />
Ruina arqueológica<br />
,<br />
irmlte<strong>de</strong> estudio<br />
®<br />
éutrico - Litosol éutrit<br />
PSd -Sd Paramosol d'sfrico - Litosol d's<br />
6,000<br />
11,<strong>03</strong>0<br />
2,000<br />
8,750<br />
Phoeozem lúvico<br />
Combiiol éutrico<br />
Cambisol gleico<br />
Cambliol húmico<br />
Paramoiol éutrico<br />
Argludol tfpi 0yA<br />
Eutropept tip co<br />
Eutrocrapt ác uleo<br />
Haplumbrept rtptcc<br />
Criumbrept t liCO<br />
andoso. - L i-xo JU! •;<br />
Páramo ondosol<br />
Criumbrept t ilea<br />
Crian<strong>de</strong>pt tfp co<br />
•;-.':<br />
< ^-Sr.:::-:<br />
- • • : • • .<br />
r , ^<br />
547,200<br />
2,300<br />
Chernozem calcico<br />
Crioborol Cp<br />
co<br />
> : . ;: -^<br />
Tierral urbonas )<br />
TOTAL<br />
{•) Menor <strong>de</strong> 0.!%<br />
OFICINA NACIONAL DE CVALOACION DE RECORCOC NATJRALEC<br />
ONKRN<br />
SIERRA NORTE DE CAJAMAEOA<br />
MAPA DE<br />
GRANDES GRUPOS DE SUELOS<br />
ESCALft 1:100,000<br />
L ^ J ' f f t<br />
B<br />
? ^ ^<br />
FUENTE : Carta Nacional Fotogramétrica 1:100,000 IGM. Información temál<br />
y comprobación <strong>de</strong> campo obtenidas por ONERN con fotografías aér<br />
USAF<strong>de</strong>l961.<br />
•1« \<br />
"A %i:s,!^;k;ás:J<br />
«i**-»,,--<br />
Santa Cruz <strong>de</strong> Toledo '<br />
i<br />
^-o<br />
í^fl*<br />
"••:<br />
"i "<br />
- -<br />
^í;-<br />
• *<br />
CLA. ES DE PENDIENTES<br />
EXPLICACIÓN DEL SÍMBOLO<br />
Tf»<br />
'<br />
i-'<br />
SÍMBOLO<br />
A<br />
B<br />
RANGO<br />
0 - 5 %<br />
5 - 15 %<br />
TERMINO DESCRIPTIVO<br />
A nivel o coil o nivel<br />
Ligeramente inclinado o inclinado<br />
— Gran Grupo <strong>de</strong> Suelos FAO<br />
JP"<br />
C<br />
15 - 25%<br />
Fuertemente inclinado<br />
- Cloíe <strong>de</strong> pendiente<br />
0<br />
25-50%<br />
Mo<strong>de</strong>radomen-e empnado a empinado<br />
E +50%
MAPA No. 6
HOJA 1<br />
78" 30-<br />
I<br />
CLASES DE PENDIEKTE<br />
RANGO DE PENDIENTE<br />
- 25 %<br />
- 50%<br />
+ 50 %<br />
EXPLICACIÓN DEL SÍMBOLO<br />
TERMINO DESCRIPTIVO<br />
Ligeramente nd nado c inclinado<br />
Puertements inclinado<br />
Mo<strong>de</strong>íadamanM empinado a empinado<br />
Muy emp'nado a e «tremada man te emp'nado<br />
n<br />
GRDPOS Y ASOCIACIÓN DE GBDPOS DE CAPACIDAD DE USO MAYOR<br />
GRUPO O<br />
ASOCIACION|<br />
DE GRUPOS<br />
LX<br />
í<br />
i<br />
Tierras aptos para cultivos intensivos criofTl'-<br />
iltivs p.r-<br />
Tierras aptas pora pastoreo ( activ'dad pecuo<br />
rio).<br />
Tierras no optas para prop&ilos agropecuarios,<br />
rv e^Iotaeión forestal.<br />
Tierras con aptitud <strong>de</strong> los Grupos 1 y 2<br />
SUPERFICIE<br />
Ha. ' %<br />
60,400 | 11.0<br />
22,300 | 4.i<br />
15,600 2.8<br />
34,400 I 6.3<br />
130,500 23.7<br />
I<br />
— Grupo o Aiocioción <strong>de</strong> Gnjpo» <strong>de</strong><br />
Capacidad <strong>de</strong> UJO Mayor.<br />
> :<br />
Tierras con aptitud <strong>de</strong> los Grupos I c / 2<br />
T'srras con aptitud <strong>de</strong> los Grupos 2 y 4<br />
Tierras con aptitud <strong>de</strong> los Grupos 3 y 4<br />
SUBTOTAL<br />
r^zr<br />
Tierras urbanos y <strong>la</strong>guna<br />
16,900 3.1<br />
9,700 1.8<br />
227,200 , 41 .3<br />
32,300 ' 5.9<br />
549,500 | 100.0<br />
500 | (*)<br />
550,000 100,0<br />
\ c
o, ¿«i* I<br />
"^ "-f'"'*•<br />
f.'APA N«. 7
^•"•rv--<br />
.ndrCB lie Úíitttrv. ' \
DIAGKAMA DE EMPALME<br />
•f<br />
MAPA DE UBICACIOH<br />
ar "° 73° 65°<br />
• V \\<br />
i-<br />
^<br />
l II<br />
\<br />
. •<br />
'<br />
'y<br />
w<br />
J*/<br />
..<br />
V^ ?* ' ^ ' V^/fr^<br />
'^^r-<br />
1<br />
_<br />
v<br />
PERU<br />
/'.'""^T<br />
mm.<br />
-,,_x?<br />
' ^"T<br />
'"' L<br />
/'í<br />
•emL^<br />
.1- „• 73- »•<br />
..<br />
'"<br />
• • ii •<br />
CLASES DE PENDIENTE<br />
GRDPOS Y ASOCIACIÓN DE GRUPOS DE CAPACIDAD DE USO MAYOR<br />
v<br />
SÍMBOLO<br />
A<br />
c<br />
D<br />
E<br />
RAflGO DE PENDIENTE • TERMINO DESCRIPTIVO<br />
0 - 5 %<br />
A nivel o casia nivel<br />
5 - 15 %<br />
Ligeramente inclinado a inclinado<br />
15 - 25%<br />
Fuertemente Inclinado<br />
25 - 50%<br />
Mo<strong>de</strong>radamente empinada a empinado<br />
+ 50 %<br />
Muy empinado o extremadamente empinado<br />
GRUPO O<br />
ASOCIACIÓN<br />
DE GRUPOS<br />
LiZ<br />
ü<br />
1 2<br />
APTITUD<br />
Tierras generalmente aptas pora cultivos inten<br />
Tierras aptas poro cultivos intensivos criof'li-<br />
Tierras generalmente optas paro cultivos permanentes,<br />
postas y forestales.<br />
SUPERFICIE<br />
Ha.<br />
60,400<br />
22,500<br />
15,600<br />
%<br />
11.0<br />
4.1<br />
2.8<br />
3<br />
Tierras aptas para pastoreo ( actividad pecua<br />
rio).<br />
34,400<br />
6.3<br />
- /<br />
1<br />
1<br />
\<br />
\<br />
i<br />
\ ^<br />
-<br />
1 c<br />
D"<br />
1<br />
EXPLICACIÓN DEL SÍMBOLO<br />
r.,.- „ Asocionón <strong>de</strong> Girjpos <strong>de</strong><br />
Copacid qd <strong>de</strong> Uso Mayor.<br />
"" luic "<br />
Asociación <strong>de</strong> C<strong>la</strong>ses <strong>de</strong> Pendiente<br />
'<br />
1 , 2<br />
•^ .2<br />
ni explotación forestal.<br />
Tierras =on aptitud <strong>de</strong> los Grupos 1 y 2<br />
Tierras con aptitud <strong>de</strong> los Grupos 1 c y 2<br />
Tierras con aptitud <strong>de</strong> los Grupos 2 / 4<br />
Tierras con aptitud <strong>de</strong> los Grupos 3 y 4<br />
130,500<br />
16,900<br />
9,700<br />
227,200<br />
32,300<br />
23.7<br />
3.1<br />
l.B<br />
41.3<br />
5.9<br />
SUBTOTAL<br />
549,500<br />
100.0<br />
Tierras urbanas y <strong>la</strong>gunas<br />
500<br />
{*)<br />
(')<br />
Menor <strong>de</strong> 0.1 %<br />
TOTAL<br />
550,000<br />
100.0<br />
SIGNOS CONVENCIONALES-<br />
CAJAMARCA<br />
^<br />
Capital <strong>de</strong> provincia<br />
Capital <strong>de</strong> distrito<br />
Pob<strong>la</strong>das<br />
Carretera pavimentada<br />
Otras carTEteras<br />
CHOTA<br />
Chusur<br />
L<strong>la</strong><strong>de</strong>'n<br />
Puente<br />
Mina<br />
Cota comprobada<br />
Ruino arqueológica<br />
\ \<br />
Linea <strong>de</strong> contacto<br />
Limite <strong>de</strong><br />
estudio<br />
I<br />
I<br />
í<br />
OFICINA NÍCIONflL DE EVÍLUIGION E RECURSOS NATURALES<br />
OKERN<br />
SIERRA NORTE DE CAJAMARCA<br />
I<br />
I<br />
1<br />
I<br />
MAPA DE GRUPOS DE CAPACIDAD<br />
DE USO MAYOR DE LAS TIERRAS<br />
ESCALA i::no<br />
1 c , ? ^<br />
B ^«M,<br />
FUEN E : Carta Nacional Fotog romo trica 1:100,000 IGM. Información temótlca<br />
y comprobación <strong>de</strong> campo obtenidas por ONERN con Fotografías aéreas<br />
U5AF<strong>de</strong>l961.<br />
coo<br />
,x<br />
/v.<br />
"""""W.<br />
'-'-ir<br />
y
MAPA INK 7<br />
i<br />
IÍ
SECTOR CUTERVO<br />
•.-..<br />
SUB SECTOR Sí<br />
DIAGRAMA. DE UBICACIÓN<br />
78=30'<br />
SECTOR CHOTA<br />
5U6SECTOIÍ CONCHAN<br />
i"""! ' I<br />
••, i,<br />
piij ^ =<br />
R4MBAMAECA<br />
C° Chueolfana<br />
« "••'m •'<br />
..<br />
MAPA No. 8<br />
r" •—<br />
*
DIAGRAMA DE UBICACIÓN<br />
. SVIOiAMARCA i<br />
onmnuu<br />
i i<br />
i<br />
i<br />
sutscrot CURACAIK<br />
KHmXAWLfou<br />
OFICIHk HICrtHH Of EMlUáCIN BE KCIISIS RITIIRLES<br />
ONERN<br />
SIERRA NORTE DE CAJABdARCA<br />
MAPA DE SISTEMA DE RIEGO<br />
ZONA<br />
CHOTA-BAnBAHARCA<br />
Esca<strong>la</strong> 1 50.000<br />
FUENTE: Corto Nocional fotoarontH.ca 11 tOO.OOO IGM. Uvon>ar>i*nto aonfotivronf.lco<br />
1^20/X»SAM. InAnaeW* rMAIaya>|H' '<br />
ONEKN ecn fotivnTa. oim USAf «n 1961.
iSEo-X—^s.^.<br />
S4L<br />
i<br />
"^^ ^i» ,mi •tyi& m v* ,r "\ ' "' ^•"•^"••^•ifit ^^i-^^^'imfc • r^ift^yi^^y^^iww--^^r >,a ff^<br />
aJii.-rn.. .nrihfeiSKfc,-^