

Informe sobre la PYME 2010 - Dirección General de PolÃtica de la ...
Informe sobre la PYME 2010 - Dirección General de PolÃtica de la ...
Informe sobre la PYME 2010 - Dirección General de PolÃtica de la ...

Create successful ePaper yourself
Turn your PDF publications into a flip-book with our unique Google optimized e-Paper software.
<strong>Informe</strong> <strong>sobre</strong> <strong>la</strong> <strong>PYME</strong> <strong>2010</strong><br />
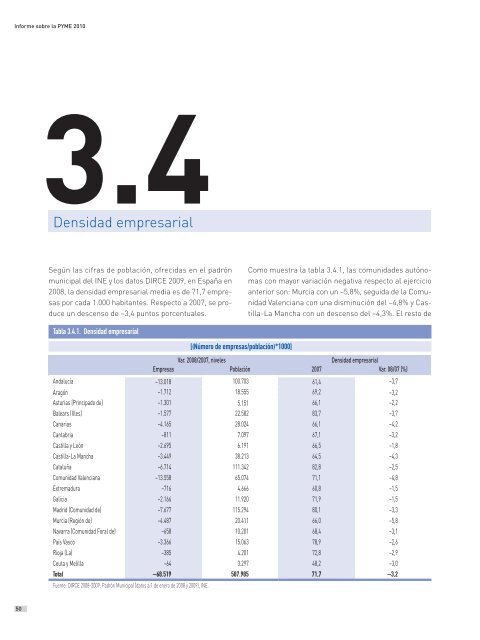
3.4<br />
Densidad empresarial<br />
Según <strong>la</strong>s cifras <strong>de</strong> pob<strong>la</strong>ción, ofrecidas en el padrón<br />
municipal <strong>de</strong>l INE y los datos DIRCE 2009, en España en<br />
2008, <strong>la</strong> <strong>de</strong>nsidad empresarial media es <strong>de</strong> 71,7 empresas<br />
por cada 1.000 habitantes. Respecto a 2007, se produce<br />
un <strong>de</strong>scenso <strong>de</strong> –3,4 puntos porcentuales.<br />
Como muestra <strong>la</strong> tab<strong>la</strong> 3.4.1, <strong>la</strong>s comunida<strong>de</strong>s autónomas<br />
con mayor variación negativa respecto al ejercicio<br />
anterior son: Murcia con un –5,8%, seguida <strong>de</strong> <strong>la</strong> Comunidad<br />
Valenciana con una disminución <strong>de</strong>l –4,8% y Castil<strong>la</strong>-La<br />
Mancha con un <strong>de</strong>scenso <strong>de</strong>l –4,3%. El resto <strong>de</strong><br />
Tab<strong>la</strong> 3.4.1. Densidad empresarial<br />
[(Número <strong>de</strong> empresas/pob<strong>la</strong>ción)*1000]<br />
Var. 2008/2007, niveles<br />
Densidad empresarial<br />
Empresas Pob<strong>la</strong>ción 2007 Var. 08/07 (%)<br />
Andalucía –13.018 100.703 61,4 –3,7<br />
Aragón –1.712 18.555 69,2 –3,2<br />
Asturias (Principado <strong>de</strong>) –1.301 5.151 66,1 –2,2<br />
Balears (Illes) –1.577 22.582 83,7 –3,7<br />
Canarias –4.165 28.024 66,1 –4,2<br />
Cantabria –811 7.097 67,1 –3,2<br />
Castil<strong>la</strong> y León –2.695 6.191 66,5 –1,8<br />
Castil<strong>la</strong>-La Mancha –3.449 38.213 64,5 –4,3<br />
Cataluña –6.714 111.342 82,8 –2,5<br />
Comunidad Valenciana –13.558 65.074 71,1 –4,8<br />
Extremadura –716 4.666 60,8 –1,5<br />
Galicia –2.166 11.920 71,9 –1,5<br />
Madrid (Comunidad <strong>de</strong>) –7.677 115.294 80,1 –3,3<br />
Murcia (Región <strong>de</strong>) –4.487 20.411 66,0 –5,8<br />
Navarra (Comunidad Foral <strong>de</strong>) –658 10.201 68,4 –3,1<br />
País Vasco –3.366 15.063 78,9 –2,6<br />
Rioja (La) –385 4.201 72,8 –2,9<br />
Ceuta y Melil<strong>la</strong> –64 3.297 48,2 –3,0<br />
Total –68.519 587.985 71,7 –3,2<br />
Fuente: DIRCE 2008-2009, Padrón Municipal (datos a 1 <strong>de</strong> enero <strong>de</strong> 2008 y 2009), INE.<br />
50


